Investor Presentation - September 2021 - Greif, Inc.
←
→
Page content transcription
If your browser does not render page correctly, please read the page content below
Investor Presentation
September 2021
Safe harbor
FORWARD-LOOKING STATEMENTS
This presentation contains certain forward-looking information within the meaning of the Private Securities Litigation Reform Act of 1995.
The words “may,” “will,” “expect,” “intend,” “estimate,” “anticipate,” “aspiration,” “objective,” “project,” “believe,” “continue,” “ontrack” or
“target” or the negative thereof and similar expressions, among others, identify forward-looking statements. All forward looking statements
are based on information currently available to management. Such forward-looking statements are subject to certain risks and
uncertainties that could cause events and the Company’s actual results to differ materially from those expressed or implied. Please see
the disclosure regarding forward-looking statements immediately preceding Part I of the Company’s Annual Report on the most recently
filed Form 10-K. The company assumes no obligation to update any forward-looking statements.
REGULATION G
This presentation includes certain non-GAAP financial measures like Adjusted EBITDA and other measures that exclude special items
such as restructuring and other unusual charges and gains that are volatile from period to period. Management of the company uses the
non-GAAP measures to evaluate ongoing operations and believes that these non-GAAP measures are useful to enable investors to
perform meaningful comparisons of current and historical performance of the company. All non-GAAP data in the presentation are
indicated by footnotes. Tables showing the reconciliation between GAAP and non-GAAP measures are available at the end of this
presentation and on the Greif website at www.greif.com
September 29,
2021 P.2
Greif: the leading industrial packaging solutions provider
– 145+ years of packaging experience –
Most comprehensive packaging portfolio with leading
product shares in multiple substrates
Extensive geographic portfolio with wide reach
Demonstrated commitment to customer service
excellence and industry partnership
Recognized sustainability leader
Predictable capital deployment strategy and risk
adjusted return philosophy
Strong free cash flow generation and commitment to
progressive dividends
September 29,
2021 P.3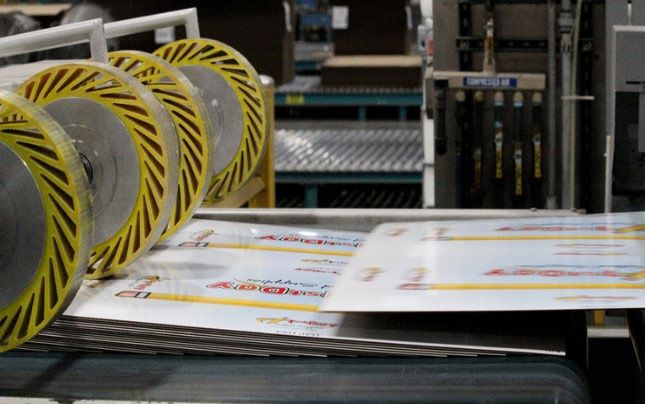
Company overview
FY20 Net Sales by Segment                                                                   Leading Positions in Multiple Packaging Substrates1
                                                                                                    Upstream Ops                                                            Industrial Packaging
                                                                                         Uncoated
                               Global Industrial Packaging
                                                                                         recycled                                                                                Flexible                    Rigid
                                                                                                                                           Steel
                                                                                         boxboard                                                                                 IBCs                       IBCs
                                                                                          (URB)                                #2                                      #1                          #1                         #3
                               Paper Packaging & Services
                                                                                           Coated
                                                                                          recycled                                         Fibre                                 Tube
                                                                                          boxboard                                                                              & Core
                                                                                                                               #3                                      #1                          #2
                               Land Management                                             (CRB)

                                                                                        Recovered                                      Industrial
                                                                                           fiber                                       Closures                                 Plastic
                                                                                          group                                                                        #1                          #2

FY20 Adj. EBITDA1 by Segment                                                                     Financial Performance
                                                                                                                                                               TTM
                               Global Industrial Packaging                                                                                                                                     FY20                   FY18
                                                                                                                                                             (7/31/21)
                                                                                           Revenue                                                              $5.1B                         $4.5B                   $3.9B
                               Paper Packaging & Services
                                                                                           Adjusted EBITDA2                                                    $707M                         $643M                $503M

                               Land Management                                             Adjusted EBITDA Margin                                              13.8%                          14.2%               13.0%

                                                                                           Adjusted Free Cash Flow2                                            $353M                         $346M                $179M

                                              (1) Ranking denotes standing in global product market. Based on company estimates.
                                              (2) A summary of all adjustments that are included in Adj. EBITDA and Adj. Free Cash Flow is set forth in the appendix of this presentation             September 29,
                                              Note: A reconciliation of the differences between all non-GAAP financial measures used in this presentation with the most directly comparable GAAP              2021      P.4
                                              financial measures is included in the appendix of this presentation.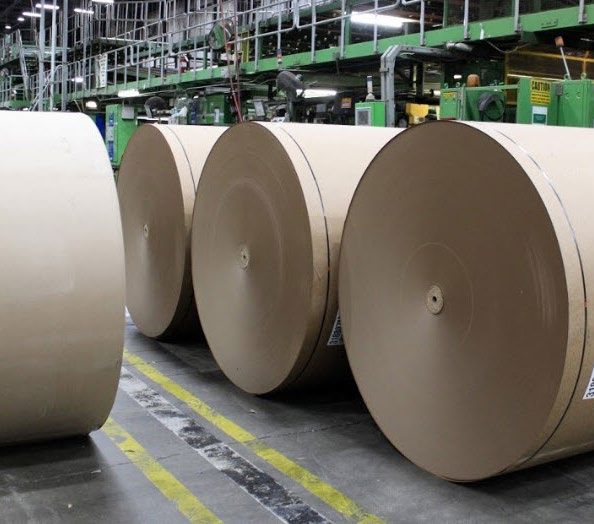
Evident step change in financial performance
Net Sales Growth ($ in Billions)                                             +5% CAGR                                   Adjusted EBITDA1 ($ in Millions)                                                                             +10% CAGR

                                                                                                                                                                                                                                                  $785 –
                                                                                            $5.1                                                                                                                                                   $865
                                                             $4.6        $4.5                                                                                                                                                       $707
                                                                                                                                                                                                 $659             $643
                                             $3.9                                                                                                                              $503
   $3.6                        $3.6                                                                                                         $428              $446
                                                                                                                           $394
                 $3.3

                                                                                                                           2015              2016             2017              2018             2019              2020           TTM           2022
   2015      2016              2017          2018           2019        2020              TTM                                                                                                                                   (7/31/21)    Commitment
                                                                                        (7/31/21)

Adjusted Free Cash Flow1 ($ in Millions)                                    +34% CAGR
                                                                                          $410 –
                                                                                                                        Class A / B Dividend ($/sh)                                                                                 +1% CAGR
                                                                                           $450
                                                                                                                                   $2.51                 $2.51                $2.51                 $2.54                   $2.63           $2.63
                                                               $346        $353

                                                $268                                                                        $1.68                 $1.68                $1.68                 $1.72                 $1.76              $1.76
          $201          $209
                                      $179

 $81

 2015     2016          2017          2018          2019        2020       TTM             2022                                 2015                  2016                 2017                  2018                  2019                2020
                                                                         (7/31/21)      Commitment

                                                           CAGR        (1) A summary of all adjustments that are included in Adj. EBITDA and Adj. Free Cash Flow is set forth in the appendix of this presentation
                                                                       Note: A reconciliation of the differences between all non-GAAP financial measures used in this presentation with the most directly comparable GAAP
                                                           ’15-’20     financial measures is included in the appendix of this presentation.
Fiscal 2021 anticipated to build on prior performance
               Adj. Class A EPS (actual and outlook)                                                                                 Financial outlook ($/sh, $M)                                                                                        FY 2021
$5.50
                                                                                                                                     Adj. Class A EPS1                                                                                              $5.10 – $5.30
$5.00                                                                                                                                Adj. Free Cash Flow2                                                                                             $335 – $365

$4.50                                                                                                                                Financial assumptions (%, $M)                                                                                       FY 2021
$4.00                                                                                                                                Interest expense                                                                                                   $95 – $99
                                                                                                                                     DD&A                                                                                                             $233 – $239
$3.50
                                                                                                                                     Non-GAAP tax rate                                                                                                   20 – 23%
$3.00
                                                                                                                                     Adj. Capital expenditure                                                                                         $130 – $145
$2.50
                                                                                                                                     Other outlook assumptions
$2.00                                                                                                                                • Q4 21 OCC = $183/ton (FY21 OCC = $116/ton)

$1.50
                                                                                                                                     • Anticipate operating working capital to be a cash use between
                                                                                                                                       $115M – $145M
$1.00

$0.50

$0.00
        FY15      FY16   FY17    FY18                 FY19                 FY20                FY21
                                                                                              outlook
                                (1)   No reconciliation of the fiscal 2021 Class A earnings per share before adjustments guidance or tax rate excluding the impact of adjustments guidance, both non-GAAP financial measures which exclude gains and losses on the
                                      disposal of businesses, timberland and properties, plants and equipment, non-cash pension settlement (income) charges, acquisition and integration related costs, incremental COVID-19 costs, net, restructuring and impairment
                                      charges, is included in this release because, due to the high variability and difficulty in making accurate forecasts and projections of some of the excluded information, together with some of the excluded information not being
                                      ascertainable or accessible, we are unable to quantify certain amounts that would be required to be included in the most directly comparable GAAP financial measure without unreasonable efforts                                 September 29,
                                (2)   A reconciliation of 2021 adjusted free cash flow guidance to forecasted net cash provided by operating activities, the most directly comparable GAAP financial measure is included in the appendix of this presentation.
                                Note: A reconciliation of the differences between all non-GAAP financial measures used in this presentation with the most directly comparable GAAP financial measures is included in the appendix of this presentation.                        2021    P.6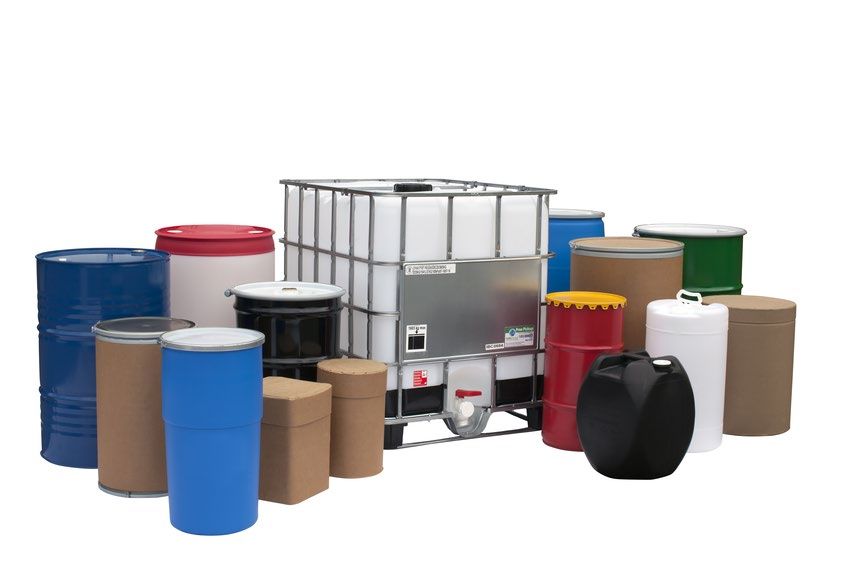
An experienced and well-respected sustainability leader
Significant milestones sustainability / ESG journey milestones
                                                                                                               2019                                   2021
                                                                                                      Named to Newsweek’s                      Second materiality
                                                                         2017                             inaugural most                          assessment
                                                                   First materiality                        responsible                          conducted and
                 2009                             2015                                                companies list; Tholu
                                                                     assessment                                                                new climate goals
                 First                        Receive Silver                                           (IBC reconditioner)
                                                                   conducted and                                                                   developed;
             sustainability                     EcoVadis                                               acquired; reporting
                                                                     2025 targets                                                               reporting aligned
           report published                    recognition                                               aligned to SASB
                                                                      developed                                                                     to TCFD

                                                                                                                                 2020
                                                             2016                          2018                               PCR IBCs
                                                        Join UN Global                 Receive Gold                       produced for first
      2008                                             Compact (UNGC)                    EcoVadis                             time; IBC
   Join World               2010                        and receives A-                 recognition                           circularity
Business Council      Greif Green Tool                    CDP score                                                      enhanced with JVs
 for Sustainable      first developed                                                                                      with Centurion,
  Development                                                                                                              LAF and Delta
                                                                                                                               plastics

Recent recognition of our leadership

                                         A-
                                                                                                                                                  September 29,
                                                                                                                                                          2021    P.7
Elevating ESG even further to enhance performance
Environmental Social Governance
Building upon our track record of success as a Further enhancing our culture of safety and Strong oversight established and “top-down”
strong steward of the environment and a leader engagement alignment in place
in circularity
Introduced “Zero Harm” safety commitment Ongoing board oversight, committee engagement
Climate – achieve 28% reduction in scope 1 & 2 and regular updates
greenhouse gas emissions by 2030; determine Expanding DE&I initiatives – launched 4 colleague
scope 3 reduction feasibility by 2023 resource groups; deploying unconscious bias and Internal sustainability management team in place;
inclusive leadership training quarterly ESG management reviews conducted
Waste – divert 90% or more of waste to landfill by
2025 at all production facilities Increase women in management positions by 25% Measurement and tracking via the Greif Business
by 2025 System
September 29,
2021 P.8
Consistent capital deployment strategy
Reinvest in the business Return cash to shareholders De-lever the balance sheet
Fund maintenance to sustain the “cash machine” Board recently approved: Transfer enterprise value from debt-to-equity
and organic growth opportunities that exceed ‒ Class A: $0.46/sh dividend (+0.02 increase)1 holders and achieve targeted leverage ratio (2.0-
required returns ‒ Class B: $0.69/sh (+$0.03 increase)1 2.5x)
Aggressive debt Compliance
Predictable capital Industry leading Total debt
leverage
($B) Reduction
deployment dividend2 ratio
(actual and forecast)
5.0% $2,700 Total debt 4.0x
4.5% 3.8x
$2,600 Compliance
leverage ratio 3.6x
4.0%
3.5% $2,500 3.4x
3.0% 3.2x
$2,400
2.5% 3.0x
$2,300 2.8x
2.0%
1.5% $2,200 2.6x
1.0% 2.4x
$2,100
0.5% 2.2x
0.0% $2,000 2.0x
Greif.B Greif.A Barclays US S&P 500 Q3'20 Q4'20 Q1'21 Q2'21 Q3'21 Q4'21F
Maintenance Growth Compliance
Aggregate bond
Index
(1) Increase versus FQ2 2021
(2) Data as of Aug 27, 2021 and sourced from Factset.
September 29,
2021 P.9
Risk adjusted framework in place to screen future growth
                          Organic Growth                                      Capital Expenditure                                            Acquisition

                                                           • New equipment in existing  • New plant in existing                 • Footprint consolidation / expansion
                 • Strategic customer alignment and
 Description                                                 facility                     geography                             • Product and process adjacency
                   share expansion
                                                           • New plant in new geography                                         • Product expansion / new platform

 Greif WACC

      +

 Risk factor

      =

 Hurdle rate                       Lower hurdle                                                                                    Higher hurdle

                      •   Proximity to Core                        •   Operational Footprint                      •   Integrate ERP / IT System
                      •   Industry Structure                       •   Competitive Environment                    •   Supply Chain & Sourcing Strategy
                      •   Market Power & Influence                 •   Utility / Energy Availability              •   Manufacturing Technology
  Risk factor         •   Barriers to Entry                        •   Cost to Implement / Transaction Size       •   Asset Condition
considerations
                      •   Cultural Complexity / Fit                •   Pace of Synergy Capture / Payback          •   Existing Capability / Know How
                      •   Labor Market / Unions                    •   Management Team / People & Retention       •   Tax Strategy
                      •   Customer Retention & Concentration       •   Integration Across Business / Geography    •   ESG / Sustainability Benefits & Risks

                                                                                                                                                      September 29,
                                                                                                                                                              2021    P.10
Further step-up in Free Cash Flow on the horizon
FY ‘22 Adj. FY ‘22 Adj.
$M
EBITDA1 Free Cash Flow2
GIP $342 – $379
PPS $437 – $477
Land $6 – $9
Total Company $785 – $865 $410 – $450
FY 2022 commitments assume a 2018 like economy
(1) No reconciliation of the fiscal year 2022 Adjusted EBITDA, a non-GAAP financial measure which excludes gains and losses on the disposal of businesses, timberland and property, plant and equipment, acquisition costs, non-cash pension
settlement charges, restructuring and impairment charges is included in this presentation because, due to the high variability and difficulty in making accurate forecasts and projections of some of the excluded information, together with some
of the excluded information not being ascertainable or accessible, we are unable to quantify certain amounts that would be required to be included in the most directly comparable GAAP financial measure without unreasonable efforts.
(2) No reconciliation of the fiscal year 2022 Adjusted free cash flow, defined as net cash provided by (used in) operating activities, less cash paid for purchases of properties, plants and equipment, plus cash paid for acquisition-related costs, September 29,
plus cash paid for debt issuance costs, plus cash paid for incremental COVID-19 costs, net, plus cash paid for acquisition-related Enterprise Resource Planning (ERP) systems, is included in this presentation because, due to the high 2021 P.11
variability and difficulty in making accurate forecasts and projections of some of the excluded information, together with some of the excluded information not being ascertainable or accessible, we are unable to quantify certain amounts that
would be required to be included in the most directly comparable GAAP financial measure without unreasonable effortsCompelling investment thesis and strong track record
Compelling customer Consistent capital
Robust and diverse Numerous avenues for
value proposition due allocation, compelling Committed to
product portfolio with incremental low risk
to demonstrated dividend and focus on sustainability
exposure to a variety growth and margin
commitment to Free Cash Flow leadership
of end markets globally enhancement
customer service expansion
Leading producer of steel / Creating stickier customer Utilizing the Greif Business Actively de-levering the Embedding ESG deeper into
plastic / fibre drums; rigid / relationships through System to drive cost control, balance sheet to accelerate the business:
flexible intermediate bulk industry leading customer operating discipline and shift in enterprise value to
containers; industrial service and commitment to capture incremental returns equity holders A” rating from MSCI
closures; uncoated recycled solving customer problems on investment
boxboard “Low Risk” rating from
Sustainalytics
“A-” rating from CDP
September 29,
2021 P.12Appendix
September 29,
2021 P.13Grounded in purpose, vision and three strategic priorities
To safely package and protect our customers’ goods and materials to
Purpose
serve the essential needs of communities around the world
In industrial packaging, be the best performing
Vision
customer service company in the world
Engaged Teams Differentiated Customer Service Enhanced Performance
• Best in class health and safety • Deliver Superior customer • Value driven growth
experience
Strategic • Top decile colleague • Margin and Free Cash
Priorities engagement • Create value for our customers Flow expansion via the
through a solutions-based Greif Business System
• Accountability aligned to value approach
creation • Sustainability commitment
• Earn our customers’ trust and
loyalty
Key
Enabler
The Greif Business System
Values THE GREIF WAY
September 29,
2021 P.14An organization focused on winning and built on culture
A values-based culture built upon With industry leading colleague And a vision to serve customers with
Servant Leadership… engagement… excellence…
Greif’s Global Team Behaviors Gallup Engagement Score Customer Satisfaction Index1
Communicate with 93
90
respect, candor, 4.20 86 87
4.17 82
and trust
3.97 73
89th 90th
Think Greif Act with the 3.81
first mindset of a
champion
74th
Model the 55th
behaviors of a
servant leader
2018 2019 2020 2021 2015 2016 2017 2018 2019 2020
Denotes manufacturing sector percentile ranking
The best players don’t always win but the best teams do
1CSI is an internal measure of a plant’s or business’ performance against selected parameters that customers experience, giving us an indication
of our level of meeting our customers basic needs. Components include: customer complaints received; customer complaints open greater than 30
days; credits raised; number of late deliveries; and the number of deliveries. September 29,
2021 P.15Focused on value, driven by servant leadership
Assisting those in their time of need
• Donated GCUBE IBC’s to help provide Greif Ultimate Upcycle Challenge
drinking water to thousands in the region • Colleagues challenged to design and
make an upcycled item – creative reuse National Wear Red Day Greif Week at Recreation Unlimited
• In support of American Heart Association • 13th year of supporting summer camp for
children with disabilities!
Ongoing support for DE&I and June Recognized as a top workplace Ongoing support of Habitat for Funding scholarships for the next
Pride month activities Humanity generation of leaders
Leading through service and contributing to our communities
September 29,
2021 P.16Well positioned to capitalize on external growth drivers
Global growth recovery post Expanding influence of Increasing importance of
Expansion of
COVID; Ongoing growth in sustainability and multi-use food safety and overall
e-commerce
emerging markets packaging hygiene needs
Extensive reach with operations in Expanding IBC collection and Utilizing “Sheet-feeder plus” network Penetrating food and beverage end
> 40 countries reconditioning network to provide full range of capabilities markets in both GIP and PPS
and support (i.e., light / heavy
Leading producer of steel / plastic / Developing "greener" coatings and weights, cold storage, etc.)
fibre drums; rigid / flexible paper grades with 100% recycled
intermediate bulk containers; content
industrial closures; uncoated
recycled boxboard
September 29,
2021 P.17Business Segment Overview
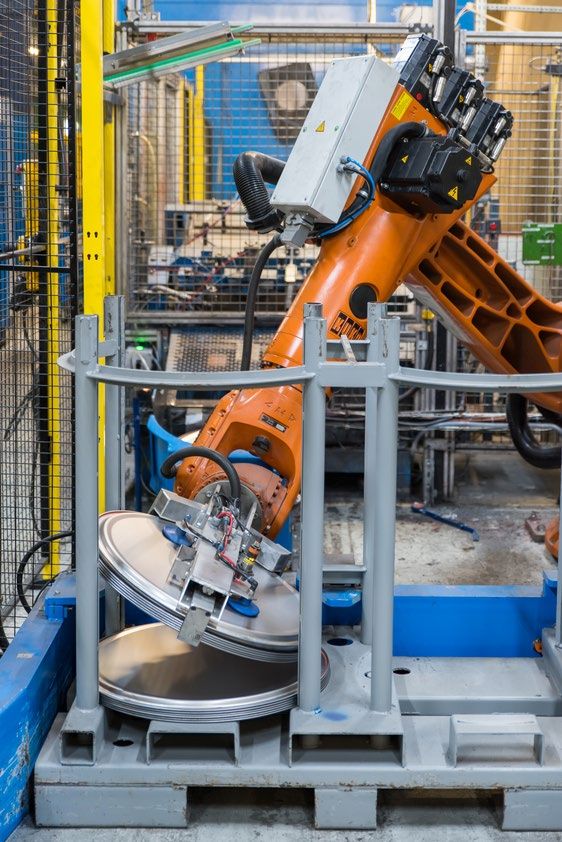
Global Industrial Packaging (GIP) Segment Overview
FY20 Net Sales by Product / Geography / End Market                                              Highlights & Capabilities
                                                                                                • Extensive global expertise and operational footprint
 Steel
 Large / Med Plastic                                                   N. America               • Industry’s most comprehensive product line offering
 Small Plastic
                                                                       L. America
                                                                                                        ─ #1 product share in steel drum, fibre drums and Flexible
 Fibre
                                                                                                          Intermediate Bulk Container (FIBC); #2 in plastic drums; and #3
 IBC
                                                                       EMEA
 1&2 Loop FIBC                                                                                            in Intermediate Bulk Containers (IBC)
 4 Loop FIBC                                                           Asia Pacific
                                                                                                • Differentiated customer service focus with long-term relationships
 Other

                                   Petrol Prod, Lube Oils & Adds.
                                   Specialty chemicals                                               Financial Performance
                                   Bulk / Commodity chemicals
                                   Packaging distributors
                                   Paints, Coatings, Inks & Adhesives
                                   Solid food prod, pastes                                                                                                                                      FY20             FY18
                                   Agro chemicals
                                   Pharmaceuticals & personal care                                   Revenue                                                                                    $2.6B            $2.9B
                                   Juice & beverage products
                                   Blenders, Fillers & Chem. Distr.
                                   Flavors & Fragrances                                              Adjusted EBITDA1                                                                          $324M            $299M
                                   Silicones
                                   Waste industry                                                    Adjusted EBITDA Margin                                                                    12.6%            10.1%
                                   Detergents & Surfactants
                                   Solvents & Glycol based prord.
                                   Other

                                                  (1) A summary of all adjustments that are included in Adj. EBITDA for the GIP segment is set forth in the appendix of this presentation
                                                  Note: A reconciliation of the differences between all non-GAAP financial measures used in this presentation with the most directly comparable GAAP    September 29,
                                                  financial measures is included in the appendix of this presentation.                                                                                          2021    P.19
GIP: Q3 FY21 performance review
Financial Performance ($M)
Q3 FY21 Q3 FY20
Net sales $907.8 $617.8
Gross profit $199.4 $128.7
Adjusted EBITDA1 $146.2 $84.5
Adjusted EBITDA % 16.1% 13.7%
Key points
• Strong YoY volume performance across all key substrates
• Ongoing inflation recovery through strategic pricing actions and
contractual price adjustment mechanisms
• Little indication of customer stock building; key end markets
remain strong
• Q3’21 results include a non-recurring $9M Brazilian operating
tax refund and $8M Adj. EBITDA F/x tail wind
• Q3’20 results include a non-recurring $5M opportunistic
sourcing benefit
(1) A summary of all adjustments that are included in Adjusted EBITDA is set forth in the appendix of this presentation.
Note: A reconciliation of the differences between all non-GAAP financial measures used in this presentation with the most directly comparable GAAP financial measures is included in the appendix of this presentation.
September 29,
2021 P.20GIP: segment strategy focused on execution and growth
Protect Utilize GBS to enhance “Pivot to Plastic” and
the core underperforming assets grow IBC portfolio
Maintain leadership positions in steel, fibre Pursue plans / actions to improve assets Expand IBC and IBC reconditioning
and FIBCs and innovate to provide underperforming relative to their potential capabilities through greenfield investment
customers with optimal packaging solutions and strategic partnership and further
and expertise penetrate attractive markets (i.e. food,
pharma)
Leading product positions in steel, Adj. EBITDA1 margin expansion Global IBC volume growth
fibre and FIBCs
16.1%
14.8%
13.3%
10.6% 10.8%
Q2'18 Q2'19 Q2'20 Q2'21 Q3'21 2017 2018 2019 2020
(1) A summary of all adjustments that are included in the Adj. EBITDA is set forth in the appendix of this presentation
Note: A reconciliation of the differences between all non-GAAP financial measures used in this presentation with the most directly comparable GAAP September 29,
financial measures is included in the appendix of this presentation. 2021 P.21GIP: track record of improving business results
GIP Adj. EBITDA1 Margin Expansion Operational excellence and commercial execution
underpinning margin expansion:
12.6%
Enhanced price / product mix management
10.9% ─ Improved pricing realization and price adjustment mechanism
10.7%
10.1% (PAM) execution
─ Further investment into plastic and IBC products and
reconditioning
Network consolidation savings and production cost efficiencies
─ Back-office sales, procurement and G&A efficiency efforts
─ Global footprint optimization and standardization across
manufacturing, sales, sourcing and supply chain
─ Greif Business System deployment to sub-optimal performing
assets
FY17 FY18 FY19 FY20
(1) A summary of all adjustments that are included in Adj. EBITDA is set forth in the appendix of this presentation
Note: A reconciliation of the differences between all non-GAAP financial measures used in this presentation with the most directly comparable GAAP September 29,
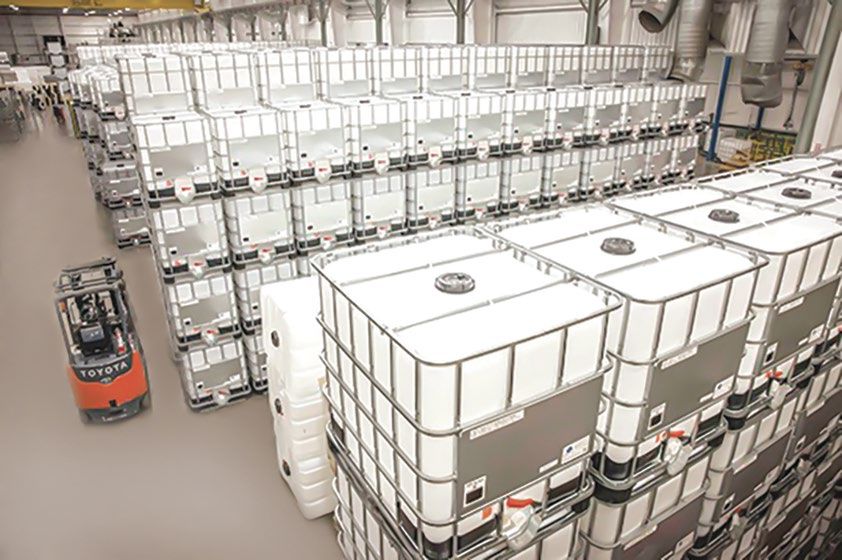
financial measures is included in the appendix of this presentation. 2021 P.22GIP: pivot to plastic and grow IBC portfolio
• IBCs are the fastest growing industrial packaging
substrate and offer numerous advantages
‒ Ease of movement and discharge
‒ Greater space efficiency
‒ Greater durability and product strength
‒ Enhances sustainability (circularity / PCR)
• Greif’s strategy: grow IBC capacity and expand IBC
reconditioning expertise / capabilities
Plastic products as % of Plastic products as % of
total GIP sales (2015) total GIP sales (2021F)
Plastic products All other Plastic products All other
• New partnerships offer more market experience and
expertise
Note: Plastic products comprised of large plastic drums and rigid intermediate bulk containers (IBC).
September 29,
2021 P.23Paper Packaging & Services (PPS) Segment Overview
FY20 Net Sales by Product & Geography Highlights & Capabilities
• Niche position in containerboard and CRB; strong position in URB
Mills and tubes/cores
• Best in class, differentiated customer service orientation
Corrugated
sheets North America
• Vertically integrated from recycled fiber to paperboard to converted
Box Board products
Products (JV)
Tube / cores
• Unique converting capabilities; specialty product portfolio; speed to
market focus
Q3 FY21 Tube / Core End Market Demand
Film cores
Financial Performance
Paper Mill cores
Protective packaging
Cloth cores FY20 FY18
Construction tubes
Revenue $1.9B $0.9B
Yarn carriers
Carpet & floor cores Adjusted EBITDA1 $306M $192M
Roofing cores
Adjusted EBITDA Margin 16.0% 21.4%
Metal, foil and strapping cores
Other
(1) A summary of all adjustments that are included in Adj. EBITDA for the PPS segment is set forth in the appendix of this presentation
Note: A reconciliation of the differences between all non-GAAP financial measures used in this presentation with the most directly comparable GAAP September 29,
financial measures is included in the appendix of this presentation. 2021 P.24PPS: Q3 FY21 performance review
Financial Performance ($M)
Q3 FY21 Q3 FY20
Net sales $578.8 $459.3
Gross profit $118.0 $88.9
Adjusted EBITDA1 $89.9 $72.0
Adjusted EBITDA % 15.5% 15.7%
• Strong YoY volume performance and higher published
containerboard and boxboard prices
• Order book remains robust; executing on announced price increases
Price increase / effective date Recognition
+$50/ton CRB (7/5/21) +$30/ton & $20/ton
+$70/ton containerboard (7/12/21) +$50/ton liner & $60/medium
+$50/ton URB (7/26/21) +$50/ton
+$50/ton CRB (8/30/21) +$40/ton
+$70/ton URB (9/13/21) +$40/ton
• OCC headwind of $24M YoY
(1) A summary of all adjustments that are included in Adjusted EBITDA is set forth in the appendix of this presentation.
Note: A reconciliation of the differences between all non-GAAP financial measures used in this presentation with the most directly comparable GAAP financial measures is included in the appendix of this presentation.
September 29,
2021 P.25PPS: segment strategy focused on integration and growth
Capitalize on sustainable
Integrate and Boost containerboard Grow specialty
packaging &
achieve Caraustar synergies integration products
e-commerce trends
Complete Caraustar integration, Through new Palmyra sheet feeder Growth in higher margin products Further penetrate e-commerce
realize synergies and identify and ongoing growth in such as litho-laminates, coating market and provide packaging
additional opportunities specialty products products and bulk packaging solutions in support of
sustainability strategy
PPS Caraustar New Palmyra PPS specialty
Litho-laminates
synergies sheet feeder sales
$80 25%
$70
20%
$60
$50 15%
$40
$30 10%
$20
5%
$10
$0 0%
Deal FY19 FY20 FY22
FY18 FY19 FY20 Long term
Assumption Realized Realized Expected
target
September 29,
2021 P.26Reconciliation tables
GAAP to Non-GAAP Reconciliation:
Segment and Consolidated Financials: Operating Profit to Adjusted EBITDA

                                                       Note: Adjusted EBITDA is defined as net income, plus interest expense, net, plus income tax expense, plus depreciation, depletion and amortization
                                                       expense, plus restructuring charges, plus acquisition and integration related costs, plus non-cash asset impairment charges, plus non-cash pension      September 29,
                                                       settlement charges (income), plus incremental COVID-19 costs, net, plus loss (gain) on disposal of properties, plants, equipment and businesses, net,           2021    P.28
                                                       plus timberland gains, net.
GAAP to Non-GAAP Reconciliation:
Reconciliation of Segment Operating Profit to Adjusted EBITDA
Note: Adjusted EBITDA is defined as net income, plus interest expense, net, plus income tax expense, plus depreciation, depletion and amortization
expense, plus restructuring charges, plus acquisition and integration related costs, plus non-cash asset impairment charges, plus non-cash pension September 29,
settlement charges (income), plus incremental COVID-19 costs, net, plus loss (gain) on disposal of properties, plants, equipment and businesses, net, 2021 P.29
plus timberland gains, net.GAAP to Non-GAAP Reconciliation:
Adjusted Free Cash Flow
Note: Adjusted free cash flow is defined as net cash provided by operating activities, less cash paid for purchases of properties, plants and equipment,
plus cash paid for acquisition and integration related costs, plus cash paid for incremental COVID-19 costs, net, plus cash paid for acquisition and September 29,
integration related Enterprise Resource Planning (ERP) systems. 2021 P.30GAAP to Non-GAAP reconciliation:
Historical Net Income and Class A Earnings Per Share Excluding Adjustments
Income be fore
Income Tax
(Be ne fit) Expe nse Ne t Income Dilute d
and Equity Earnings Income Tax Non- (Loss) C lass A
of Unconsolidate d (Be ne fit) Equity C ontrolling Attributable Earnings
(in millions, excpet for per share amounts) Affiliate s, ne t Expe nse Earnings Inte re st to Gre if, Inc. Pe r Share
Twelve Months Ended October 31, 2020 186.1 63.3 (1.5) 15.5 108.8 1.83
(Gain) loss on disposal of properties, plants, equipment and businesses, net 19.6 (4.7) - 0.6 23.7 0.40
Restructuring charges 38.7 9.0 - 1.0 28.7 0.48
Non-cash asset impairment charges 18.5 3.9 - - 14.6 0.25
Acquisition and integration related costs 17.0 4.1 - - 12.9 0.22
Non-cash pension settlement charges 0.3 - - - 0.3 0.01
Incremental COVID-19 costs, net 2.6 0.7 - - 1.9 0.03
Excluding Adjustments 282.8 76.3 (1.5) 17.1 190.9 3.22
Twelve Months Ended October 31, 2019 262.0 70.7 (2.9) 23.2 171.0 2.89
(Gain) loss on disposal of properties, plants, equipment and businesses, net (10.2) (2.4) - (2.5) (5.3) (0.09)
Restructuring charges 26.1 4.4 - 0.8 20.9 0.36
Non-cash asset impairment charges 7.8 1.9 - 0.1 5.8 0.10
Acquisition and integration related costs 29.7 4.3 - - 25.4 0.43
Debt extinguishment charges 22.0 5.3 - - 16.7 0.28
T ax net benefit resulting from the T ax Reform Act - 0.5 - - (0.5) (0.01)
Excluding Adjustments 337.4 84.7 (2.9) 21.6 234.0 3.96
Twelve Months Ended October 31, 2018 299.8 73.3 (3.0) 20.1 209.4 3.55
(Gain) loss on disposal of properties, plants, equipment and businesses, net (6.4) (0.9) - (0.5) (5.0) (0.09)
Restructuring charges 18.6 3.1 - 0.6 14.9 0.26
Non-cash asset impairment charges 8.3 1.5 - - 6.8 0.11
Acquisition and integration related costs 0.7 - - - 0.7 0.01
Non-cash pension settlement charge 1.3 0.2 - - 1.1 0.02
Provisional tax net benefit resulting from the T ax Reform Act - 19.2 - - (19.2) (0.33)
Excluding Adjustments 322.3 96.4 (3.0) 20.2 208.7 3.53
Twelve Months Ended October 31, 2017 200.3 67.2 (2.0) 16.5 118.6 2.02
(Gain) loss on disposal of properties, plants, equipment and businesses, net 1.3 (0.7) - (0.2) 2.2 0.04
Restructuring charges 12.7 (2.2) - 0.6 14.3 0.24
Non-cash asset impairment charges 20.8 0.1 - 0.1 20.6 0.35
Acquisition and integration related costs 0.7 0.2 - - 0.5 0.01
Non-cash pension settlement charge 27.1 10.2 - - 16.9 0.29
Excluding Adjustments 262.9 74.8 (2.0) 17.0 173.1 2.95
Twelve Months Ended October 31, 2016 141.2 66.5 (0.8) 0.6 74.9 1.28
(Gain) loss on disposal of properties, plants, equipment and businesses, net 4.2 (2.1) - (0.7) 7.0 0.12
Restructuring charges 26.9 4.9 - 2.9 19.1 0.33
Non-cash asset impairment charges 51.4 5.2 - 3.8 42.4 0.71
Acquisition and integration related costs 0.2 0.1 - - 0.1 -
Excluding Adjustments 223.9 74.6 (0.8) 6.6 143.5 2.44
Twelve Months Ended October 31, 2015 114.8 48.4 (0.8) (4.7) 71.9 1.23
(Gain) loss on disposal of properties, plants, equipment and businesses, net 2.2 3.5 - 1.5 (2.8) (0.05)
T imberland gains (24.3) (9.4) - - (14.9) (0.25)
Restructuring charges 40.0 7.7 - 4.1 28.2 0.48
Non-cash asset impairment charges 45.9 5.2 - - 40.7 0.69
Acquisition and integration related costs 0.3 0.1 - - 0.2 -
Venezuela devaluation of invesntory on other income/expense (4.9) - - - (4.9) (0.08)
Venezuela devaluation of invesntory on cost of products sold 9.3 - - - 9.3 0.16
Excluding Adjustments 183.3 56.0 (0.8) 0.4 127.7 2.18
September 29,
2021 P.31GAAP to Non-GAAP reconciliation:
Reconciliation of Segment Operating Profit to Adjusted EBITDA
September 29,
2021 P.32GAAP to Non-GAAP reconciliation:
Projected 2021 Adjusted Free Cash Flow guidance reconciliation
Fiscal 2021 Guidance Range
(in millions) Scenario 1 Scenario 2
Net cash provided by operating activities $ 447.5 $ 488.5
Cash paid for purchases of properties, plants and equipment (130.0) (145.0)
Free cash flow $ 317.5 $ 343.5
Cash paid for acquisition and integration related costs 7.0 9.0
Cash paid for incremental COVID-19 costs, net 3.0 4.0
Cash paid for acquisition and integration related ERP systems 7.5 8.5
Adjusted free cash flow $ 335.0 $ 365.0
September 29,
2021 P.33GAAP to Non-GAAP Reconciliation:
TTM (7/31/21) Adjusted EBITDA and Adjusted Free Cash Flow
GREIF, INC. AND SUBSIDIARY COMPANIES
GREIF, INC. AND SUBSIDIARY COMPANIES
GAAP TO NON-GAAP RECONCILIATION
CONSOLIDATED ADJUSTED EBITDA - TTM Ended July 31, 2021
GAAP TO NON-GAAP RECONCILIATION
UNAUDITED ADJUSTED FREE CASH FLOW - TTM Ended July 31, 2021
UNAUDITED
Nine Months Three Months Ended TTM
(in millions) Ended July 31, Oct 31, 2020 July 31, 2021
Net income $ 303.3 $ 48.0 $ 351.3 Ended July 31, Three Months July 31,
(in millions)
Plus: Interest expense, net 75.8 26.0 101.8 2021 Ended Oct 31, 2020 2021
Plus: Debt extinguishment charges - - - Net cash provided by operating activities $ 258.7 $ 200.4 $ 459.1
Plus: Income tax expense 56.5 18.5 75.0 Cash paid for purchases of properties, plants
(94.2) (32.6)
Plus: Depreciation, depletion and amortization expense 176.2 60.1 236.3 and equipment (126.8)
EBITDA $ 611.8 $ 152.6 $ 764.4 Free cash flow $ 164.5 $ 167.8 $ 332.3
Net income $ 303.3 $ 48.0 $ 351.3 Cash paid for acquisition and integration related
6.2 3.5 9.7
Plus: Interest expense, net 75.8 26.0 101.8 costs
Plus: Debt extinguishment charges - - - Cash paid for debt issuance costs - - -
Plus: Income tax expense 56.5 18.5 75.0 Cash paid for incremental COVID-19 costs, net 2.6 0.7 3.3
Plus: Non-cash pension settlement charges (income) 9.0 0.4 9.4
Cash paid for acquisition and integration related
Plus: Other (income) expense, net 2.2 (0.8) 1.4 6.0 1.9 7.9
Plus: Equity earnings of unconsolidated affiliates, net of ERP systems
(3.1) (0.3) (3.4) Adjusted free cash flow $ 179.3 $ 173.9 $ 353.2
tax
Operating profit 443.7 91.8 535.5
Less: Non-cash pension settlement charges (income) 9.0 0.4 9.4
Less: Other (income) expense, net 2.2 (0.8) 1.4
Less: Equity earnings of unconsolidated affiliates, net of
(3.1) (0.3) (3.4)
tax
Plus: Depreciation, depletion and amortization expense 176.2 60.1 236.3
EBITDA $ 611.8 $ 152.6 $ 764.4
Plus: Restructuring charges 18.8 11.9 30.7
Plus: Acquisition and integration related costs 6.2 3.5 9.7
Plus: Non-cash asset impairment charges 1.5 1.6 3.1
Plus: Non-cash pension settlement charges (income) 9.0 0.4 9.4
Plus: Incremental COVID-19 costs, net (11) 2.6 0.7 3.3
Plus: (Gain) Loss on disposal of properties, plants,
(1.3) (16.2) (17.5)
equipment, and businesses, net
Plus: Timberland gains, net (95.7) - (95.7)
Adjusted EBITDA $ 552.9 $ 154.5 $ 707.4
September 29,
2021 P.34Credit Agreement leverage ratio
Trailing Twelve Month Credit Agreement EBITDA(in millions) TTM 7/31/2020 TTM 10/31/2020 TTM 01/31/2021 TTM 04/30/2021 TTM 07/31/2021
Net income 146.1 124.3 119.1 257.3 351.3
Plus: Interest expense, net 122.2 115.8 110.3 107.7 101.8
Plus: Income tax expense 57.2 63.3 58.0 48.8 75.0
Plus: Depreciation, depletion and amortization expense 241.7 242.5 240.5 238.1 236.3
EBITDA 567.2 545.9 527.9 651.9 764.4
Plus: Restructuring charges 32.6 38.7 38.5 46.1 30.7
Plus: Acquisition and integration related costs 21.0 17.0 13.9 10.9 9.7
Plus: Non-cash asset impairment charges 22.6 18.5 19.7 18.6 3.1
Plus: Non-cash pension settlement income (0.1) 0.3 8.9 9.0 9.4
Plus: Incremental COVID-19 costs, net (9) 1.9 2.6 3.2 3.5 3.3
Plus: (Gain) loss on disposal of properties, plants, equipment, and businesses, net 29.7 19.6 21.6 (15.3) (17.5)
Plus: Timberland gains, net - - - (95.7) (95.7)
Adjusted EBITDA 674.9 642.6 633.7 629.0 707.4
Credit Agreement adjustments to EBITDA 0.1 (4.3) (5.2) 34.0 31.7
Credit Agreement EBITDA 675.0 638.3 628.5 663.0 739.1
Adjusted Net Debt(in millions) July 31, 2020 October 31, 2020 January 31, 2021 April 30, 2021 July 31, 2021
Long-term debt 2,535.3 2,335.5 2,359.6 2,154.6 2,089.7
Short-term borrowings 2.6 28.4 46.2 44.7 57.6
Current portion of long-term debt 99.7 123.1 133.6 114.1 120.3
Total debt 2,637.6 2,487.0 2,539.4 2,313.4 2,267.6
(2)
Credit Agreement adjustments to debt (24.7) (47.3) (55.2) (90.9) (88.4)
Adjusted debt 2,612.9 2,439.7 2,484.2 2,222.5 2,179.2
Less: Cash (98.5) (105.9) (101.4) (110.4) (99.8)
Adjusted net debt 2,514.4 2,333.8 2,382.8 2,112.1 2,079.4
Leverage Ratio 3.72x 3.66x 3.79x 3.19x 2.81x
September 29,
2021 P.35Fiscal 2022 Financial Commitments Assumptions
Net sales will be approximately $5.0B in FY22 reflecting a 2018 like economy with the impacts of both the COVID-19 pandemic and the
industrial recession in place pre-COVID fully behind us
Raw material costs increase slightly against current indices in the markets in which we participate; assume OCC cost range of $35/ton -
$75/ton (midpoint = $55/ton)
Raw material price changes are passed to customers through price adjustment mechanisms in contracts or otherwise with customary
delay in our GIP business
FX rates flat to FY21 rates
DD&A to increase to $250M - $260M by FY22
Annual other expense to be $5M in FY22
Cash taxes paid to be $65M - $75M in FY22
Interest expense is calculated to be $90M - $95M by FY22 based on debt pay down
OWC is a use of cash in FY22 as a result of higher sales
Annual CapEx to range between $150M – $170M
Synergies of $70M to be realized by FY22 ($10M increase vs 2019 investor day assumption)
Acquisitions or divestitures not contemplated in targets
September 29,
2021 P.36You can also read