Investor Event
June 29, 2021
←
→
Page content transcription
If your browser does not render page correctly, please read the page content below
Investor Event June 29, 2021
Safe Harbor Statement
Certain statements in this presentation are forward-looking and thus reflect the Company's current expectations and beliefs with respect to certain current and future events and anticipated financial and operating
performance. Such forward-looking statements are and will be subject to many risks and uncertainties relating to the Company's operations and business environment that may cause actual results to differ materially
from any future results expressed or implied in such forward-looking statements. Words such as "expects," "will," "plans," "anticipates," "indicates," "remains," "believes," "estimates," "forecast," "guidance,"
"outlook," "goals," "targets" and similar expressions are intended to identify forward-looking statements. Additionally, forward-looking statements include statements that do not relate solely to historical facts, such as
conditional statements, statements which identify uncertainties or trends, discuss the possible future effects of current known trends or uncertainties, or which indicate that the future effects of known trends or
uncertainties cannot be predicted, guaranteed or assured. All forward-looking statements in this presentation are based upon information available to the Company on the date of this presentation. The Company
undertakes no obligation to publicly update or revise any forward-looking statement, whether as a result of new information, future events, changed circumstances or otherwise, except as required by applicable law.
The Company's actual results could differ materially from these forward-looking statements due to numerous factors including, without limitation, the following: the adverse impacts of the ongoing COVID-19 global
pandemic, and possible outbreaks of another disease or similar public health threat in the future, on the business, operating results, financial condition, liquidity and near-term and long-term strategic operating plan of
the Company, including possible additional adverse impacts resulting from the duration and spread of the pandemic; unfavorable economic and political conditions in the United States and globally; the highly
competitive nature of the global airline industry and susceptibility of the industry to price discounting and changes in capacity; high and/or volatile fuel prices or significant disruptions in the supply of aircraft fuel; the
Company's reliance on technology and automated systems to operate its business and the impact of any significant failure or disruption of, or failure to effectively integrate and implement, the technology or systems;
the Company's reliance on third-party service providers and the impact of any significant failure of these parties to perform as expected, or interruptions in the Company's relationships with these providers or their
provision of services; adverse publicity, harm to the Company's brand, reduced travel demand, potential tort liability and voluntary or mandatory operational restrictions as a result of an accident, catastrophe or
incident involving the Company, its regional carriers, its codeshare partners, or another airline; terrorist attacks, international hostilities or other security events, or the fear of terrorist attacks or hostilities, even if not
made directly on the airline industry; increasing privacy and data security obligations or a significant data breach; disruptions to the Company's regional network and United Express flights provided by third-party
regional carriers; the failure of the Company's significant investments in other airlines, equipment manufacturers and other aviation industry participants to produce the returns or results the Company expects; further
changes to the airline industry with respect to alliances and joint business arrangements or due to consolidations; changes in the Company's network strategy or other factors outside the Company's control resulting
in less economic aircraft orders, costs related to modification or termination of aircraft orders or entry into less favorable aircraft orders, as well as any inability to accept or integrate new aircraft into its fleet as
planned; the Company's reliance on single suppliers to source a majority of its aircraft and certain parts, and the impact of any failure to obtain timely deliveries, additional equipment or support from any of these
suppliers; the impacts of union disputes, employee strikes or slowdowns, and other labor-related disruptions on the Company's operations; extended interruptions or disruptions in service at major airports where the
Company operates; the impacts of seasonality and other factors associated with the airline industry; the Company's failure to realize the full value of its intangible assets or its long-lived assets, causing the Company
to record impairments; any damage to the Company's reputation or brand image; the limitation of the Company's ability to use its net operating loss carryforwards and certain other tax attributes to offset future taxable
income for U.S. federal income tax purposes; the costs of compliance with extensive government regulation of the airline industry; costs, liabilities and risks associated with environmental regulation and climate
change; the impacts of the Company's significant amount of financial leverage from fixed obligations, the possibility the Company may seek material amounts of additional financial liquidity in the short-term and
insufficient liquidity on its financial condition and business; failure to comply with the covenants in the MileagePlus financing agreements, resulting in the possible acceleration of the MileagePlus indebtedness,
foreclosure upon the collateral securing the MileagePlus indebtedness or the exercise of other remedies; failure to comply with financial and other covenants governing the Company's other debt; changes in, or failure
to retain, the Company's senior management team or other key employees; current or future litigation and regulatory actions, or failure to comply with the terms of any settlement, order or arrangement relating to these
actions; increases in insurance costs or inadequate insurance coverage; and other risks and uncertainties set forth under Part I, Item 1A., "Risk Factors," of the Company's Annual Report on Form 10-K for the fiscal
year ended December 31, 2020 as well as other risks and uncertainties set forth from time to time in the reports the Company files with the U.S. Securities and Exchange Commission.

                                                                                                                                                                                                                                         2
United Next
The airline customers choose to fly
Scott Kirby, Chief Executive Officer

United Next
Andrew Nocella, EVP & Chief Commercial Officer

Financial targets
Gerry Laderman, EVP & Chief Financial Officer
The airline customers choose to fly
Scott Kirby, Chief Executive Officer

Capitalizing on United's unique competitive advantages

▪ ‘United Next’ is much more than an aircraft purchase

▪ Only airline with hubs in seven of the largest and most premium markets

▪ Only airline that didn’t retire widebody fleet types during the pandemic and had the best pre-crisis
  long-haul margins1

▪ Only airline with a ~30% gauge2 increase leading to CASM-ex3 down ~(8%) in 2026

                        United, like other airlines, is increasingly focused on maximizing individual
                                    competitive advantages to de-commoditize air travel

1Internal company analysis - Flight Profitability System; 2 Assumes 30 seat increase on 2019 average North America mainline and regional gauge of 104 seats;
3As compared to 2019. CASM-ex (operating expense per available seat mile) excludes fuel, profit sharing, third-party business expenses and special charges.
CASM-ex is a non-GAAP financial measure. The Company is not able to provide guidance with respect to CASM, the most comparable GAAP measure, without           5
unreasonable efforts.
United Next
Andrew Nocella, EVP & Chief Commercial Officer

Recall: In 2018, began transformation of our mid-continent hubs

    Required fixing depth, breadth, connectivity                                                                                    Identified 10-point margin2 gap to similar hubs

               Margin1 gap to industry closed by                                                                               Returns immediately positive, margin2 gap to other
                     ~2 points 2018-2019                                                                                        mid-continent hubs began to close as projected
1Adjusted pre-tax margin as reported by carrier, includes DL, AA, WN, AS, B6; adjusted pre-tax margin excludes special charges and the mark-to-market impact
of financial instruments; 2 Internal company analysis - Flight Profitability System
                                                                                                                                                                                      7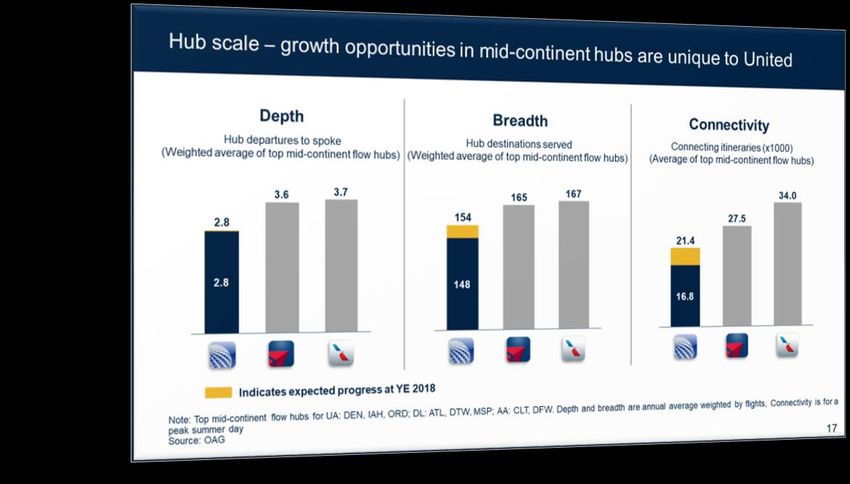
‘United Next’
Strengthening our position as the airline our customers, travel agency partners, and corporate clientele choose

                                                                                          Premier Global Carrier
                                              Signature product | Global | Higher margin | CASM-ex1 ~(8%) lower

      Global Network                                                 Optimized Fleet                                                Leading Product            Best Service

    Unlock full potential                                         Correct gauge gap                                                   De-commoditize              Invest in
    of our premium hubs                                          and optimize premium                                                 and differentiate      customer experience,
    and global gateways                                            seating products                                                    versus others        improving NPS scores

         ‘United Next’ is a plan that finally aligns our network, fleet, and products to the hubs we fly and
                        the customers we serve and will realize the full potential of United

1Refers to 2026 as compared to 2019. CASM-ex (operating expense per available seat mile) excludes fuel, profit sharing, third-party business expenses and
special charges. CASM-ex is a non-GAAP financial measure. The Company is not able to provide guidance with respect to CASM, the most comparable GAAP
measure, without unreasonable efforts. Note: for a GAAP to Non-GAAP reconciliation, see Appendix A
                                                                                                                                                                                    8
United operates from two different types of hubs
    Small gauge is an easily correctable gap in both our mid-continent hubs and coastal gateways

                               Coastal Gateways                                                                                                                 Mid-Continent Hubs
         New York                     San Francisco                      Los Angeles                     Washington D.C.                             Denver           Houston          Chicago

       Facility constraints limit departure growth:                                                                                                                   As before:
    Gauge lowers CASM-ex1 and offers better product                                                                                                     Gauge, scale, and connectivity growth

1 CASM-ex (operating expense per available seat mile) excludes fuel, profit sharing, third-party business expenses and special charges. CASM-ex is a non-GAAP
financial measure.
                                                                                                                                                                                                 9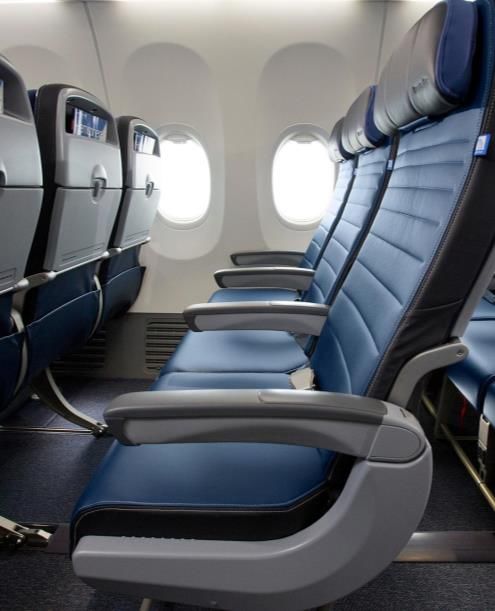
Recall: Our hubs are in the largest markets and business centers,
with the most international demand
Passenger demand Long-haul passenger demand Premium passenger demand
Total passengers – YE 2019 International passengers – YE 2019 Premium passengers – YE 2019
Houston
San Francisco
Houston
Houston
Atlanta
Seattle
San Francisco
Seattle
San Francisco
Seattle
New York
Atlanta
Philadelphia
Atlanta
Chicago
Chicago
Chicago
New York
New York
Denver
Minneapolis
Denver
Denver
Los Angeles
Miami
Detroit
Dallas
Miami
Dallas
Miami
Dallas
Los Angeles
Los Angeles
Washington D.C.
Washington D.C.
Washington D.C.
Our hubs are a uniquely United demographic advantage, positioning United as the U.S. flag carrier
Source: 2019 MIDT, data organized by metro area
10United’s long-haul network outperformed peers, even pre-crisis
Competitors went out of business, retired large widebody fleets, and are eliminating “strategic” flying
Margin by entity vs. legacy peers – FY191
~16 pt
~9 pt
~8 pt
~0 pt
Deep South America Atlantic Pacific Overall Long-Haul
Another uniquely United advantage, global flying has been profitable and we believe it is
best positioned to improve going forward
1 Estimated from company analysis; legacy peers consist of AA/DL, AA/DL estimated using publicly available revenue data; all based on FY2019 data
11However, we have not realized our full potential domestically because we
have been dependent on single-class 50-seaters
North America gauge
(July 2019)
Influenced by single-class regional jets
175
Poor unit economics
114 Spills demand
104
United Legacy Peers U/LCC
(Average) (Average) Subpar product
Regional jets are suboptimal when
Lowest among U.S. major airlines
competing against larger equipment
Gauge is an opportunity largely already addressed by industry – unique tailwind for United
Note: legacy peers consist of AA/DL; U/LCC refers to ultra low-cost carriers and low-cost carriers
Source: OAG
12‘United Next’ plan retires 200+ single-cabin regional jets by 2026
Midwest hub departures on single-cabin regional jets
Large narrowbodies vs RJs
42%
More profitable
28% Avoid spilling demand
18% 19% Improved product
Connectivity
~4%
Lower costs
MSP DTW ORD ORD United Next Better segmentation
(ORD)E
Seamless
Higher NPS
Overall, single-class regional jets will go from 33% of North American departures to ~10%
Source: Diio (2019, percent of Domestic departures, includes Canada); Internal schedules
E Estimated 2026, internal network schedule projection
13Replacing regional jets requires narrowbodies, announced today
Gauge – Boeing 737 MAX 10 and Airbus A321neo are the largest in their class, will join the fleet in 2023
Large narrowbody fleet composition1
+~30pts New large narrowbodies
~33%
27%
Boeing 737 MAX 10
4% Airbus A321neo
Legacy Peers United United NextE
2019
New mainline jets will create jobs – regional pilots from our Aviate program will get first access
1Large narrowbodies (181+ seats) as a percent of total narrowbodies in fleet
E Estimated 2026, based on latest internal delivery and retirement projections
Note: legacy peers consist of AA/DL
14Improving connectivity with gauge remains key to strengthening our hubs
United underperforms on global … Because a high proportion of feeder flights
traffic in small cities1 … operate on small regional jets
% of domestic departures on single-class regional jets
37%
(100%)
26% 27%
13%
0%
United Legacy Peers Legacy Peers United United
(Average) (NYC) (EWR) Next (EWR)
Upgauging feeder flights while maintaining or increasing frequencies and connectivity
1 “SmallCities” – the smallest Continental US airports that, in aggregate sum to 25% of Continental US departing seats (a total of the smallest 92% of airports)
Source: Diio FY19; Share from MIDT for pax traveling abroad excl. Canada and incl. U.S. territories (adjusted FY19)
Note: legacy peers consist of AA/DL 15Improved connectivity leapfrogs competition in mid-continent hubs
Connectivity – adding bank scale without a need to grow above our facility capabilities
% of banks ≥ 70 departures: mid-continent hubs1
+55 pts Driving efficiencies
65%
42%
Gate utilization
Hub staffing
10%
Connectivity
Legacy Peers United United NextE
2019
Low marginal cost
Plan to increase average bank size by 15 flights from 2019 to 2026
1 Top 3 midcontinent hubs per carrier. UA – ORD, IAH, DEN; AA – CLT, ORD, DFW; DL – ATL, DTW, MSP
E Estimated 2026, internal network schedule projection
16Modern, fuel-efficient fleet will close structural gap by 2026
Gauge – optimized for United’s seven hubs at 134 seats by 2026
Unprecedented gauge growth Total seats per short-haul departure
for a major airline North America mainline + regional fleet
~134
+ ~30 seats 104
109
per departure
through 2026
on our North American fleet
2019 2022E 2026E
E Estimated, based on latest internal delivery and retirement projections
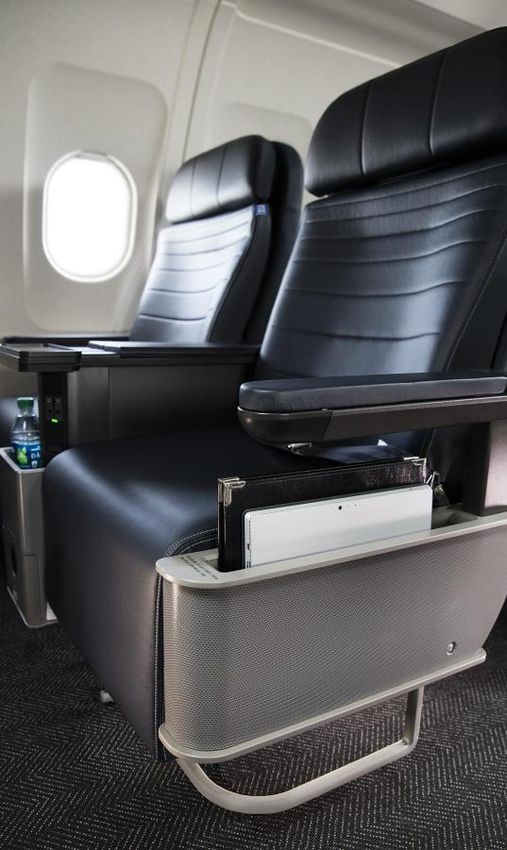
17Narrowbodies enable premium seat growth; match United hub demographics
Product differentiation
Premium seats per short-haul departure
North America fleet
+~75%
53
39
31
Economy
Plus®
United
FirstSM
2019 2022E 2026E
Premium seating will grow faster than non-premium
E Estimated, based on latest internal delivery and retirement projections
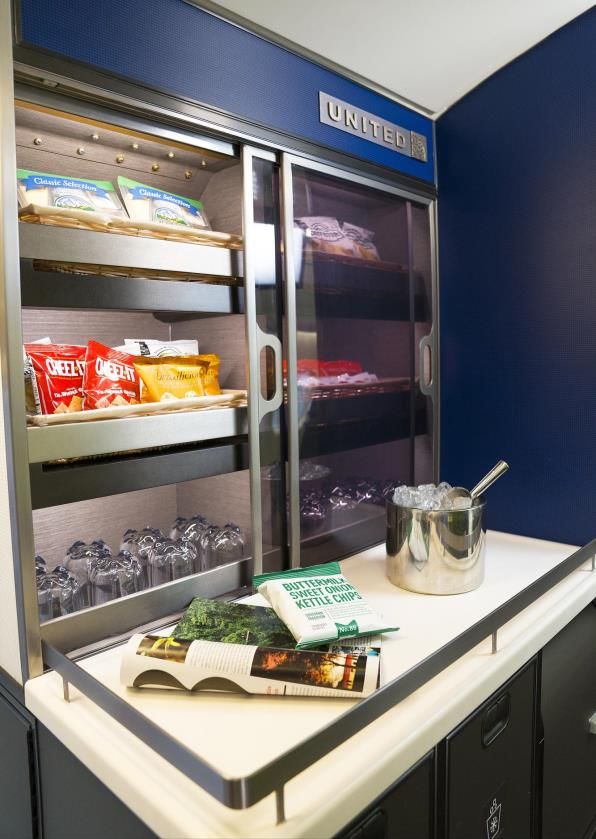
18CRJ-550: Uniquely United product for smaller, competitive markets
matches United hub demographics
CRJ-550 differentiated from other 50-seaters
United FirstSM
Economy Plus®
1:1 carry-on capacity
Onboard snack bar
CRJ-550 deployment focused on Newark and Chicago, closing competitive gaps
19Matching capacity to premium demand; more seats than competitors
Product differentiation – international widebodies
Largest widebody premium cabins We lead U.S. competitors in
amongst U.S. legacy airlines premium cabin seats
2019 Lie-flat seats per long-haul departure (int’l widebodies) Lie-flat seats Q1 2021
+129% +135%
+40% 63
44
32
United Legacy Peers Foreign Flag United Competitor 1 Competitor 2
Legacies1
United hub demographics enable more lie-flat seats than all other U.S. airlines combined
1 International
airlines flying from United hubs to their gateways
Source: Diio 2019, Q1 2021 10-Qs
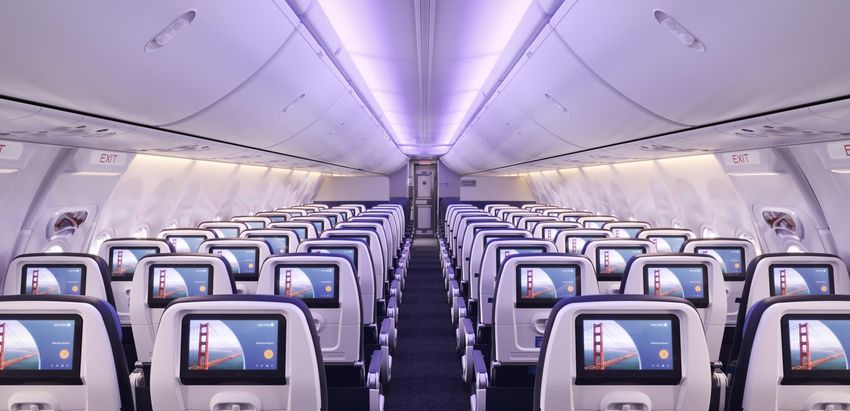
20New leading and differentiated signature interiors on all mainline jets planned
by 2025
Customer experience – enhancements for all cabins, turbocharging NPS
Signature interior features
1:1 overhead bins
Seatback entertainment
LED lighting
Next generation wi-fi
Nose to tail power
New branding elements
Today, United took delivery of its first Boeing 737 MAX 8, the first aircraft with our signature interior
21Culture change, improved customer focus drive higher NPS scores
Customer experience
Net Promoter Score1
2021 J.D. Power study2
+36 pts
+50 Points
Best improvement among
all U.S. airlines
FY 2019 FY 2020 2021 YTD
Despite the hassles and inconveniences of pandemic travel, customers are noticing a change
1 Source: United NPS survey; data through 6/6/2021
2 Source: J.D. Power North America Airline Satisfaction Study (2021 vs. 2020 overall satisfaction improvement)
22‘United Next’ plan will fill six structural gaps to achieve our potential
Gauge impacts most structural gaps positively
Gauge Average domestic gauge grows by ~30 seats1
Leading product Aligned to hub potential; leading experience in all cabins; differentiated
Customer experience Maintain culture momentum, an airline customers choose to fly
Connectivity Banks at critical mass2 increase from 10% to 65%
Scale Daily mid-con hub departures up from ~545 to ~650
Schedule depth Frequencies per market increase by ~10%
1Refers to North America gauge by 2026
2Banks with 70 departures or more
Note: Mid-continent hubs are DEN, IAH, ORD; all percentage figures represent estimated 2026 as compared to 2019
23‘United Next’ growth will primarily come from gauge
Better for customers and CASM-ex1
Expected capacity growth
2019-2026 CAGR2
Higher gauge 2-4%
New routes ~1%
Increased frequency ~1%
Total 4-6%
Our plan maintains an approximately 50/50 split of international and domestic revenue over many years
1 CASM-ex (operating expense per available seat mile) excludes fuel, profit sharing, third party business expenses and special charges. CASM-ex is a non-GAAP financial measure
2 Compound Annual Growth Rate versus 2019
24Premium seat growth and lower stage length will provide unit revenue
tailwinds
Domestic seat growth leans towards premium Structural changes from ‘United Next’
cabins, lowering reliance on economy revenue will provide yield tailwinds
% of Revenue, 2019
(4%)
70% 73% Other
30% Domestic
27% Economy Cabin1
2019 2026 E 2019 2026 E
Domestic Economy1 seats only represented
Domestic stage length declines by 4% by 2026
30% of revenue in 2019; set to drop further
‘United Next’ conservatively assumes TRASM2 down ~(4%) in 2023, and down ~(1%) in 2026 vs. 2019
1 Excludes Economy Plus® seats
2 Totalrevenue per available seat mile (“TRASM”)
E Estimated
25These opportunities are uniquely United
These opportunities provide us a pathway to success even with elevated industry domestic capacity growth
Uniquely United opportunities will provide Network/fleet initiatives –
unit revenue upside drive cost tailwinds
▪ Building connectivity and scale
▪ Unprecedented gauge1 growth;
▪ Proven international potential; unique gateways
+ ~30 seats by 2026
▪ International competitive restructuring
▪ Retiring 200+ single class 50-seaters
▪ More First Class and Economy Plus Seats
▪ Better utilizing existing infrastructure
▪ Complete Premium Plus rollout
▪ Leading and Consistent Product
▪ Hub focus = good RASM growth
▪ Customer service focus
▪ Uniquely United aircraft configurations
Opportunities driven by the unique Unique potential to grow gauge
demographics of our hubs given low starting point and strong hub markets
1 Assumes 30 seat increase versus 2019 average North America gauge of 104 seats
26Financial targets Gerry Laderman, EVP & Chief Financial Officer
'United Next' cost targets will drive greater profitability and more
secure balance sheet

                   $2B+ structural cost savings
                                                                                                                                                       CASM-ex3 will be
                                                                                                                                                     ~(8.0%) lower in 2026
                           ~30% gauge1 increase                                                                                                           versus 2019

                             Cost-efficient growth

                                                                                                                                               Good for the environment
                     ~11% better fuel efficiency2                                                                                                and the bottom line

1Assumes 30 seat increase on 2019 average North America gauge of 104 seats; 2 Defined as fuel gallons consumed per available seat mile, figure versus
2019; 3 CASM-ex (operating expense per available seat mile) excludes fuel, profit sharing, third-party business expenses and special charges. CASM-ex is a
non-GAAP financial measure. The Company is not able to provide guidance with respect to CASM, the most comparable GAAP measure, without unreasonable
efforts.                                                                                                                                                                     28
Implementing over $2B of structural cost savings independent of gauge
increase
Cost savings expected to offset inflationary pressure for several years
~$1.3B: Workforce efficiency ~$0.7B: Non-labor
Economies of scale through vendor
Streamlined management consolidation
Opportunistic contract renegotiations
Productivity improvements through
automation and process redesign Reducing real estate footprint
Improved aircraft and equipment utilization
29'United Next' gauge1 increase provides significant CASM-ex2 tailwind
versus older and smaller aircraft
Airbus A321neo vs. Airbus A319
~55%
13%
~(27%)
Seats per Cost per CASMex2
CASM-ex
departure departure
1Assumes 30 seat increase on 2019 average North America gauge of 104 seats; 2 CASM-ex (operating expense per available seat mile) excludes fuel, profit
sharing, third-party business expenses and special charges.
30Aircraft order provides cost-efficient growth opportunity
CASM-ex1
(48%)
▪ Efficient growth with improved productivity
reduces average labor cost
▪ Better utilization of gates, facilities, and
overhead means only a modest increase
in fixed cost base
Average Domestic Incremental
CASM-ex1 MAX10 CASM-ex1
United can grow with marginal CASM-ex1 below 6¢
1CASM-ex (operating expense per available seat mile) excludes fuel, profit sharing, third-party business expenses and special charges. CASM-ex is a non-GAAP financial measure. The
Company is not able to provide guidance with respect to CASM, the most comparable GAAP measure, without unreasonable efforts.
31New generation large narrowbody aircraft provide significant fuel burn
reduction
Fuel cost per seat1
(56%)
$36
$25
$16
50 seat RJ A319 MAX9
Newer aircraft are at least 50% more fuel efficient per seat than our least efficient fleets
1 Measured as fuel cost per seat at 700 mile stage length
32'United Next' plan results in ~(8%) lower CASM-ex1 in 2026 compared
to pre-crisis levels
CASM-ex1
~0.8
(¢)
~0.6
10.21
(~0.7)
Domestic
$2B anticipated cost ~9.8 stage length
savings offset inflation ~(0.5) down ~(4%)3
through 2023
Inflation ~0.4 ~9.4
2023-2026
~(1.5)
2019 Inflation Structural Gauge and 2023E Inflation Gauge and Seat stage 2026E
CASM-ex1,2 cost efficient CASM-ex1 efficient length CASM-ex1
savings asset asset
utilization utilization
1 CASM-ex (operating expense per available seat mile) excludes fuel, profit sharing, third-party business expenses and special charges. CASM-ex is a non-
GAAP financial measure. The Company is not able to provide guidance with respect to CASM, the most comparable GAAP measure, without unreasonable
efforts; 2 For a GAAP to Non-GAAP reconciliation, see Appendix A; 3 Represents average Domestic stage length; E Estimated; Note: figures may not add due to
rounding 33New orders complement existing orderbook
Aircraft deliveries
New Boeing 737 MAX order 354
New Airbus A321neo order
Existing orders 132
54
138
68
168
40 16
40 54
2022 2023 2024+
Capacity CAGR1 4.0% to 6.0% through 2026
1 Compound Annual Growth Rate versus 2019
34We will retain significant flexibility to manage macro environment
New aircraft can be used
Delivery timing flexibility
for growth or replacement
From 2023-2026, up to 275 Delivery timing can be
aircraft can be retired, driving adjusted in response to macro
fuel efficiency and improved environment
CASM-ex1
We have flexibility for a range of capacity scenarios if the recovery stalls
1CASM-ex (operating expense per available seat mile) excludes fuel, profit sharing, third-party business expenses and special charges. CASM-ex is a non-
GAAP financial measure.
35Projected near-term capital investment
Expected adjusted capital expenditures1
($B)
$8.5
$1.5
$4.5 $4.2
$1.2
$1.5 $7.0
$3.3 $2.7
2021 2022 2023
Non-aircraft Aircraft
1Non-GAAP measure that includes projects acquired through the issuance of debt and finance leases. Non-cash capital expenditures are not determinable at this time. Accordingly, United does
not provide capital expenditures guidance on a GAAP basis. All numbers are approximate.
36‘United Next’ cost structure improvements will enable earnings expansion
Expect margin growth even if TRASM is down ~(4%) in 2023 and down ~(1%) in 2026, versus 2019
Adjusted EBITDA margin1 Adjusted pre-tax margin2
~20.0% ~14.0%
15.7% ~16.0%
9.4% ~9.0%
2019 2023 E 2026 E 2019 2023E 2026E
Expect CASM-ex3 to be down ~(4.0%) in 2023 and down ~(8.0%) in 2026, versus 2019
1 Adjusted EBITDA margin is a non-GAAP financial measure calculated as Earnings Before Interest, Taxes, Depreciation and Amortization (EBITDA), excluding special charges and
unrealized (gains) losses on investments, divided by total operating revenue. We are not providing a target or a reconciliation to profit margin (net income/total operating revenue), the
most directly comparable GAAP measure, because we are unable to predict certain items contained in the GAAP measure without unreasonable efforts. Adjusted EBITDA margin does
not reflect certain items, including special charges and unrealized (gains) losses on investments, which may be significant.; 2 Excludes special charges and the mark-to-market impact of
financial instruments, the nature of which are not determinable at this time. As a result, we are not able to provide guidance with respect to pre-tax margin, the most directly comparable 37
GAAP measure, without unreasonable efforts; 3 Adjusted CASM-ex (operating expense per available seat mile) is a non-GAAP measure that excludes fuel, profit sharing, third-party
business expenses and special charges; E Estimated; Note: for a GAAP to Non-GAAP reconciliation, see Appendix ACash flow
Expect operating cash flow to cover our adjusted capital expenditures in 2022 through 2024
Adjusted free cash flow
conversion1
80%+
58%
EE
2019 2026E
Targeting at least 80% free cash flow conversion1 in 2026+
1 Defined as adjusted free cash flow divided by adjusted net income. Adjusted free cash flow is defined as operating cash flow less adjusted capital
expenditures. Adjusted capital expenditures is a non-GAAP measure that includes projects acquired through the issuance of debt and finance leases. Non-cash
capital expenditures are not determinable at this time. Accordingly, United does not provide capital expenditures guidance on a GAAP basis. Adjusted net
income excludes special charges and the mark-to-market impact of financial instruments, the nature of which are not determinable at this time; E Estimated 38Balance sheet restoration in 2026 to pre-crisis levels
Adjusted net debt1 Adjusted total debt2 to
($B) adjusted EBITDAR3
$25 $25‘United Next’ will ensure higher margins and result in a stronger
balance sheet
Efficient growth with ~30 more seats per
Gauge1 and network
departure by 2026
Uniquely United opportunities to capture
Revenue
premium revenue
Unit cost improvement ~(8.0%) lower CASM-ex2 in 2026 versus 2019
Strategic fleet purchase unlocks United’s profit maximizing potential
1North America gauge; 2 CASM-ex (operating expense per available seat mile) excludes fuel, profit sharing, third-party business expenses and special charges. CASM-ex is a non-GAAP financial
measure. The Company is not able to provide guidance with respect to CASM, the most comparable GAAP measure, without unreasonable efforts.
40Appendix
Financial targets
                                                                                                                                                           FY19                                                                      FY23E             FY26E
               Capacity (CAGR1 vs. 2019)                                                                                                                   285M                                                                  4% - 5%               4% - 6%

               TRASM (vs. 2019)                                                                                                                         15.18¢                                                                        ~(4%)            ~(1%)

               CASM-ex2 (vs. 2019)                                                                                                                      10.21¢                                                                        ~(4%)            ~(8%)

               Fuel price / gallon                                                                                                                         $2.09                                                                      $2.07             $2.20

               Adj. EBITDA margin3                                                                                                                       15.7%                                                                        ~16%              ~20%

               Adj. pre-tax margin4                                                                                                                         9.4%                                                                         ~9%            ~14%

               Adj. net debt ($B)5                                                                                                                            $18                                                                         $25           < $18
               Adj. total debt6 / adj.
                                                                                                                                                             3.2x                                                                    < 4.0x            < 2.5x
               EBITDAR7

1 Compound Annual Growth Rate; 2 Adjusted CASM-ex (operating expense per available seat mile) is a non-GAAP measure that excludes fuel, profit sharing, third-party business expenses and special charges. The Company is not able to
provide guidance with respect to CASM, the most comparable GAAP measure, without unreasonable efforts; 3 Adjusted EBITDA margin is a non-GAAP financial measure calculated as Earnings Before Interest, Taxes, Depreciation and
Amortization (EBITDA), excluding special charges and unrealized (gains) losses on investments, divided by total operating revenue. We are not providing guidance with respect to profit margin (net income/total operating revenue), the most
directly comparable GAAP measure, because we are unable to predict certain items contained in the GAAP measure without unreasonable efforts. Adjusted EBITDA margin does not reflect certain items, including special charges and unrealized
(gains) losses on investments, which may be significant; 4 Excludes special charges and the mark-to-market impact of financial instruments, the nature of which are not determinable at this time. As a result, we are not able to provide guidance
with respect to pre-tax margin, the most directly comparable GAAP measure, without unreasonable efforts; 5 Adjusted net debt is defined as adjusted total debt less cash and cash equivalents and short term investments; 6 Adjusted total debt is a
                                                                                                                                                                                                                                                                 42
non-GAAP measure that includes current and long-term debt, operating lease obligations and finance lease obligations and noncurrent pension and postretirement obligations; 7 Adjusted EBITDAR is a non-GAAP measure that measures
adjusted earnings before interest, income taxes, depreciation, amortization, aircraft rent and excluding special charges, and unrealized (gains) losses impact of investments. Special charges and unrealized (gains) losses impact of investments
are not determinable at this time, accordingly, the Company cannot provide guidance with respect to net income, the most directly comparable GAAP measure, without unreasonable efforts; E Estimated
Appendix A: reconciliation of GAAP to Non-GAAP financial measures
United evaluates its financial performance utilizing various accounting principles generally accepted in the United States of
America (GAAP) and Non-GAAP financial measures, including adjusted earnings before interest, taxes, depreciation and
amortization (adjusted EBITDA) and rent (adjusted EBITDAR), adjusted EBITDA margin, adjusted pre-tax income (loss), adjusted
pre-tax margin, and adjusted net income (loss), excluding special charges, third-party business expenses, fuel, and profit sharing,
among others. UAL believes that adjusting for special charges (credits) and other non-recurring adjustments is useful to investors
because these items are not indicative of UAL's ongoing performance. UAL believes that adjusting for unrealized (gains) losses on
investments, net is useful to investors because those unrealized gains or losses may not ultimately be realized on a cash basis.
United also provides financial metrics, including adjusted total debt, adjusted net debt, free cash flow, and free cash flow
conversion, that we believe provides useful supplemental information for management and investors.
CASM is a common metric used in the airline industry to measure an airline's cost structure and efficiency. UAL reports CASM
excluding special charges (credits), third-party business expenses, fuel and profit sharing. UAL believes that adjusting for special
charges (credits) is useful to investors because special charges (credits) are not indicative of UAL's ongoing performance. UAL
also believes that excluding third-party business expenses, such as maintenance, ground handling and catering services for third
parties, provides more meaningful disclosure because these expenses are not directly related to UAL's core business. UAL also
believes that excluding fuel costs from certain measures is useful to investors because it provides an additional measure of
management's performance excluding the effects of a significant cost item over which management has limited influence. UAL
excludes profit sharing because this exclusion allows investors to better understand and analyze our operating cost performance
and provides a more meaningful comparison of our core operating costs to the airline industry.
43Appendix A: reconciliation of GAAP to Non-GAAP financial measures
Year Ended
December 31, 2019
CASM (cents)
Cost per available seat mile (CASM) (GAAP) 13.67
Special charges 0.09
Third-party business expenses 0.06
Fuel expense 3.14
Profit sharing 0.17
CASM, excluding special charges, third-party business expenses, fuel, and profit sharing (Non-GAAP) 10.21
44Appendix A: reconciliation of GAAP to Non-GAAP financial measures
(continued)
Adjusted total debt and adjusted net debt
Adjusted EBITDA and adjusted EBITDAR As of
Year Ended
December 31,
(In millions) December 31, 2019 (In millions) 2019
Total Operating Revenue $ 43,259 Current maturities of long-term debt $ 1,407
Net income 3,009 Current maturities of finance leases 46
Adjusted for: Current maturities of operating leases 686
Depreciation and amortization 2,288 Long-term debt 13,145
Interest expense, net of capitalized interest and interest income 513 Long-term obligations under finance leases 220
Income tax expense 905 Long-term obligations under operating leases 4,946
Special charges 246 Noncurrent postretirement benefit liability 789
Nonoperating unrealized (gains) losses on investments, net (153) Noncurrent pension liability 1,446
Adjusted EBITDA, excluding special charges and other non-recurring items $ 6,808 Adjusted total debt (Non-GAAP) $ 22,685
Aircraft rent 288 Less: cash and cash equivalents (2,762)
Adjusted EBITDAR, excluding special charges and other non-recurring items $ 7,096 Less: short-term investments (2,182)
Adjusted EBITDA margin 15.7 % Adjusted net debt (Non-GAAP) $ 17,741
Adjusted total debt divided by adjusted EBITDAR 3.2
45Appendix A: reconciliation of GAAP to Non-GAAP financial measures
(continued)
Adjusted pre-tax income and adjusted pre-tax margin
Year Ended Year Ended
December 31, December 31,
(In millions) 2019 2018
Total Operating Revenue 43,259 41,303
Pre-tax income (loss) (GAAP) 3,914 2,648
Adjusted to exclude:
Special charges 246 487
Unrealized (gains) losses on investments, net (153) 5
Interest expense on ERJ 145 finance leases 64 26
Adjusted pre-tax income (loss) (Non-GAAP) $ 4,071 $ 3,166
Pre-tax margin 9.0 % 6.4 %
Adjusted pre-tax margin (Non-GAAP) 9.4 % 7.7 %
46Appendix A: reconciliation of GAAP to Non-GAAP financial measures
(continued)
Free Cash Flow (FCF), Adjusted Net Income, and FCF Conversion
Year Ended Year Ended
(In millions) December 31, 2019 (In millions) December 31, 2019
Capital expenditures (GAAP) $4,528 Net income (GAAP) $3,009
Property and equipment acquired through debt and finance leases 515 Adjusted to exclude:
Adjusted capital expenditures (Non-GAAP) $5,043 Special charges 246
Free Cash Flow Unrealized (gains) losses on investments, net (153)
Net cash provided by operating activities (GAAP) $6,909 Interest expense on ERJ 145 finance leases 64
Less adjusted capital expenditures (Non-GAAP) 5,043 Income tax benefit related to adjustments above, net of valuation allowance (35)
Less aircraft operating lease additions 56 Adjusted net income (Non-GAAP) $3,131
Free cash flow (Non-GAAP) $1,810 Free Cash Flow Conversion (Free cash flow divided by adjusted net income) 58%
47You can also read