Corporate Governance Review - March 2019 - AWS
←
→
Page content transcription
If your browser does not render page correctly, please read the page content below
Corporate Governance Review
March 2019
Financial Update
•   Committed to maintaining an investment grade credit rating, a strong balance sheet
    and paying the regular dividend throughout the cycle
•   Company cash and liquidity balances remain strong and funded pension plans are
    fully funded
•   We are redesigning the company and will focus capital on high performing
    businesses – and will fix or disposition low performing businesses
•   Fitness plans are being implemented to improve cost and efficiencies, and reduce
    capital intensity
•   Ford Credit is a strategic asset that continues to perform well

                                                                                         2
Company Key Metrics Summary
                                                                                            FULL YEAR

                                                                                  2017          2018        H / (L)

                                      Wholesales (000)                            6,607         5,982          (9) %
                                      Market Share (Pct)                            7.0 %         6.3 %      (0.7) ppts

                                      GAAP
                                      Revenue (Bils)                          $ 156.8       $   160.3          2 %
                                      Net Income (Bils)                             7.7           3.7     $ (4.1)
                                      Net Income Margin (Pct)                       4.9 %         2.3 %      (2.6) ppts
                                      EPS (Diluted)                           $ 1.93        $    0.92     $ (1.01)
                                      Cash Flows From Op. Activities (Bils)        18.1          15.0        (3.1)

                                       Non-GAAP
                                      Company Adj. EBIT* (Bils)               $     9.6     $     7.0     $ (2.6)
                                      Company Adj. EBIT Margin* (Pct)               6.1 %         4.4 %      (1.7) ppts
                                      Adjusted EPS* (Diluted)                 $ 1.78        $    1.30     $ (0.48)
                                      Company Adj. Op. Cash Flow* (Bils)            4.2           2.8        (1.4)
                                      Adjusted ROIC* (Trailing Four Qtrs)          11.8 %         7.1 %      (4.7) ppts

 * See appendix for reconciliation to GAAP                                                                                3
2019 Company Outlook
Longer-Term
2019* Target
Revenue Growth > Global GDP
$ Adj. EBIT Margin 8%+
Potential
Adj. ROIC Improvement High Teens+
From 2018
Adj. Cash Conversion 65%+
Adj. Debt To EBITDACreating Tomorrow, Together
Our
Freedom of movement drives human progress.
Belief
Our To become the world’s most trusted company,
Aspiration designing smart vehicles for a smart world.
Passion for Product & Deep Customer Insight
Our Plan for
Value Creation
Winning Propulsion Autonomous Mobility
Portfolio Choices Technology Experiences
Fitness Metrics
Operating Leverage Growth
Build, Partner, Buy EBIT Margin
Capital Efficiency ROIC
Strong Balance Sheet Cash Flow
Our People Culture & Values
5Strategic Highlights
F-Series: Over 1 million sold globally in 2018; largest-ever lead on competition; ATPs about $2k higher than segment
Winning Ranger: In the U.S., launched Ranger, the second best selling medium pickup outside of the U.S.
All-new Focus in China: Higher ATP than segment; new mid-size SUV Territory in dealer showrooms by the end of
Portfolio January
All-new Shelby GT500 revealed, most powerful street legal Ford in history
Explorer: America’s all-time best-selling SUV. All-new in 2019 with performance-tuned ST and no-compromise hybrid.
Propulsion Hybrid is the first of our next generation of advanced hybrids that provide both capability and efficiency
New all-electric utility to be revealed this year and go on sale in 2020
Choices Early work started on all-electric F-150
Autonomous Miami AV drive highlighting technology and business models for moving people and goods – exceeded expectations
Technology
Mobility Acquired e-scooter company SPIN to deliver first-mile / last-mile mobility solutions
Announced plan to deploy cellular vehicle-to-everything technology (C-V2X) in all-new vehicles in the U.S. beginning
Experiences in 2022
Redesign of our global salaried workforce to increase effectiveness and efficiency complete in 2Q
Began consultation with labor partners on restructuring and redesign of European operations to reach sustainable
profitability
Fitness Russia business under strategic review
Auto structural costs flat in 2018 YoY versus average annual increase of $1.7 billion 2013 - 2017
Entered into alliance with VW to develop medium-sized pickup trucks and commercial vans
6Corporate Governance Review
AREAS OF FOCUS
• Risk management
• Governance practices
• Director experience
• Director tenure
• Executive compensation
• Sustainability practices
7Risk Management
• Ford has extensive and effective risk management processes relating to compliance, reporting, operating and
strategic risks
• Board and senior management deeply engaged in risk management, which is shown through top-down and bottom-up
communication and cross-functional participation across Business Units and functional Skill Teams
• Board has delegated responsibility for oversight over specific areas of risk management to certain Committees of the Board
• The Audit Committee reviews our cyber security practices twice each year, with report outs to the Board as needed
OVERSIGHT OF RISK MANAGEMENT
Compliance & Reporting Operating & Strategic
Ford Board Audit Committee Sustainability & Innovation Committee
Oversight Compensation Committee
Finance Committee
Ford Management Compliance Reviews Business Units & Skill Teams
Day-to-Day Sarbanes-Oxley Compliance Business Plan Review
Disclosure Committee Special Attention Review
Product, Strategy and People Forums
Board Maintains Effective Oversight Of Risk Management
8Governance Forums
Board of Directors
Business Plan Review (BPR) /
Special Attention Review (SAR)
• The Plan
• Forecast
• Risks & Opportunities
• Special Attention
Strategic Programming Product Matters Executive Personnel Committee
Meeting (SPM) Meeting (PMM) (EPC)
Strategic Product Leadership
Direction Programs Development
• Strategic Initiatives & Better
Plans • Product Program Approvals • Leadership Development
• Business & Product • Product Program Execution • Human Resource Policies
Strategies
9Governance Practices
• Annual election of all Directors • 75% attendance requirement
• Majority vote standard • Confidential voting
• Independent Board • Shareholders have the right to call special
• Lead Independent Director meetings
• Committee charters reviewed annually • Shareholders may take action by written
consent
• Independent Directors meet regularly
without management and Non-Independent • Strong codes of ethics
Directors • Compensation for NEOs focused on
• Regular Board and Committee performance
self-evaluations
• Independent Audit, Compensation and
Nominating & Governance Committees
• Separate Chairman of the Board and CEO
• Mandatory deferral of compensation for
Directors
Board Has A Long History Of Operating
Under Sound Corporate Governance Practices
10Cultural Change…Different Ways Of Thinking
Critical Thinking Design Thinking
Point of Plan to Implement
Think Implement
View
Strategic Thinking Summary
Winning Aspiration
• Empowering team to develop point of view for
Where-to-Play quicker decisions
How-to-Win
• Utilizing human-centered design to develop
products customers want
Capabilities We
Must Have • Where to play and how to win strategic mindset
Management
Systems Required
focused on winning choices
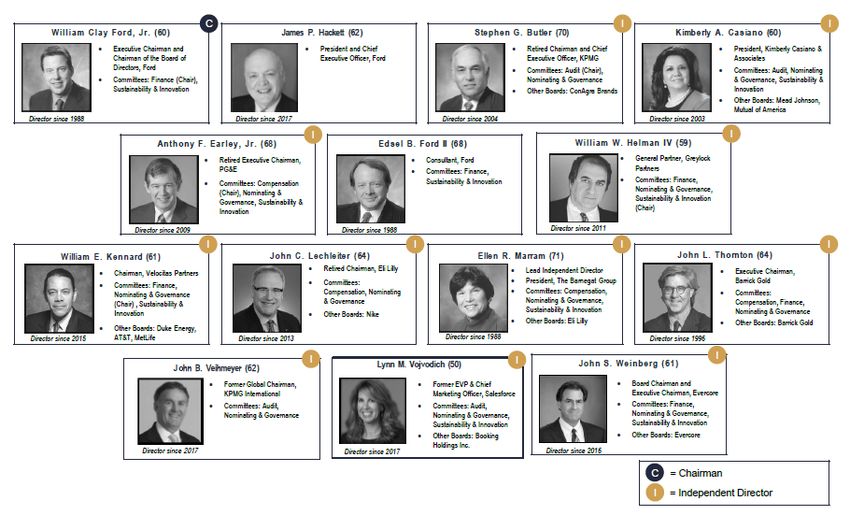
11Directors
Note: Ages are accurate as of the 2018 Proxy Statement
Directors Bring Diverse Experience And Qualifications To Deliver Accountability,
Strong Risk Oversight And Strategic Direction
12Director Experience
Current or Former CEO 8
Public Company Board 13
Manufacturing 5
Industry leaders ready to
Marketing 4 bring unique perspective
and insights on business
International 9 strategy and execution
Government 2
Finance 10
Technology 6
Directors Bring Diverse Experience And Qualifications To Deliver Accountability,
Strong Risk Oversight And Strategic Direction
13Director Tenure
Number of Directors
Average Tenure (Years) 11.4
Average Tenure without Ford Family (Years) 8.4
6 6
2
0 - 4 Years 5 - 9 Years 10+ Years
Served Served Served
Board Has Appropriate Mix Of Short-, Medium- And Long-Tenured Directors
To Ensure Diverse Perspectives
14Executive Compensation
Incentive Total Long-Term
• Executive compensation is Elements of Salary
Bonus Incentives
21%
structured to ensure that Compensation Target 18% 61%
there is appropriate balance Comparators 21% 18% 61%
among various forms of
compensation Fixed vs. Variable Fixed Variable
21% 79%
• The Compensation Comparators 21% 79%
Committee strikes a
balance by looking at Short-Term vs. Short-Term Long-Term
competitive market for Long-Term 39% 61%
executive talent, our Comparators 39% 61%
business results and
forecasts and our key Cash Equity
strategic goals for the year Cash vs. Equity 39% 61%
Comparators 39% 61%
Ford’s Overall Executive Compensation Allocation
Is In Line With Its Comparator Group’s Mean
15Executive Compensation
• In 2018, long-term incentive awards were granted in Time-Based Restricted Stock Units (40%)
and Performance Units with a three-year performance period (60%)
– Our Time-Based Units vest over three years at a rate of 33%-33%-34%
– Our Performance Unit Program aligns executive interests with shareholder interests by
awarding performance to internal financial metrics (75% weighting) and relative TSR
performance against a peer group (25% weighting) over a three-year performance period
2018 2019 2020 2021 And Beyond
Performance Period Final Awards Subject to Ownership Guidelines
• Equity award level based on 2018 - 2020 • Although shares are fully vested, executives must
performance to metrics comply with ownership guidelines
• Performance Units granted on • Final Award in shares of common stock in
March 2, 2018 March 2021
Awards subject to reduction / cancellation / recovery based on clawback policy
Our Equity-Based Incentive Awards Are Tied To Our Performance And
The Future Value Of Common Stock
16Sustainability - Environmental
PRODUCTS
• Investing $11B to put 40 hybrid and fully electric vehicle models on the road by 2022 plus
responsible development of the self-driving car
• Building the Transportation Mobility Cloud, an open platform using connected vehicles and data to
support a more efficient transportation system that can reduce congestion, emissions and improve
the overall quality of life
• On average, 95% of a Ford and Lincoln vehicle can be recycled, reused and remanufactured
• Continue to implement a range of technologies designed to enhance safety
OPERATIONS
• Committed to reducing and minimizing the environmental impact of every stage of our operations
• Achieved our global manufacturing emissions reduction goal eight years ahead of schedule with a
CO2 emissions reduction of more than 3.4 million metric tons from 2010 to 2017
• Reduced our operational water use by 62.5 percent, saving 10.4 billion gallons of water since 2000
• Nine Ford sites achieved zero waste to landfill status in 2017, bringing our global total to 85
17Sustainability - Social
• Committed to respecting human rights and improving working conditions
everywhere we operate
• Leverage our supply chain to make a positive impact on air, water, waste reduction
and renewable energy in the markets in which we do business
• Completed our first UN Guiding Principles Reporting Framework on Salient Human
Rights Issues assessment and was the first auto company to publish the results
• Engage with and invest in the communities in which we operate
• Community service has been an integral part of Ford since 1903, with more than
36,000 employees volunteering in 40 countries in 2017
18Summary
• Highly effective risk management capability shared by Board and senior
management
• Sound corporate governance practices have helped deliver strong operating results
• Highly qualified, independent Board with complementary skills and experience
• Robust governance practices
• Executive compensation aligned with creating long-term shareholder value
• Clear tone at the top regarding ethics and compliance
• Emphasis on sustainability as part of our overall strategy
19Cautionary Note On Forward-Looking Statements
Statements included or incorporated by reference herein may constitute “forward-looking statements” within the meaning of the Private Securities Litigation Reform Act of 1995. Forward-looking
statements are based on expectations, forecasts, and assumptions by our management and involve a number of risks, uncertainties, and other factors that could cause actual results to differ
materially from those stated, including, without limitation:
• Ford’s long-term competitiveness depends on the successful execution of fitness actions;
• Industry sales volume, particularly in the United States, Europe, or China, can be volatile and could decline if there is a financial crisis, recession, or significant geopolitical event;
• Ford’s new and existing products and mobility services are subject to market acceptance;
• Ford’s results are dependent on sales of larger, more profitable vehicles, particularly in the United States;
• Ford may face increased price competition resulting from industry excess capacity, currency fluctuations, or other factors;
• Fluctuations in commodity prices, foreign currency exchange rates, and interest rates can have a significant effect on results;
• With a global footprint, Ford’s results could be adversely affected by economic, geopolitical, protectionist trade policies, or other events, including Brexit;
• Ford’s production, as well as Ford’s suppliers’ production, could be disrupted by labor disputes, natural or man-made disasters, financial distress, production difficulties, or other factors;
• Ford’s ability to maintain a competitive cost structure could be affected by labor or other constraints;
• Pension and other postretirement liabilities could adversely affect Ford’s liquidity and financial condition;
• Economic and demographic experience for pension and other postretirement benefit plans (e.g., discount rates or investment returns) could be worse than Ford has assumed;
• Ford’s vehicles could be affected by defects that result in delays in new model launches, recall campaigns, or increased warranty costs;
• Ford may need to substantially modify its product plans to comply with safety, emissions, fuel economy, and other regulations that may change in the future;
• Ford could experience unusual or significant litigation, governmental investigations, or adverse publicity arising out of alleged defects in products, perceived environmental impacts, or otherwise;
• Ford’s receipt of government incentives could be subject to reduction, termination, or clawback;
• Operational systems, security systems, and vehicles could be affected by cyber incidents;
• Ford Credit’s access to debt, securitization, or derivative markets around the world at competitive rates or in sufficient amounts could be affected by credit rating downgrades, market volatility,
market disruption, regulatory requirements, or other factors;
• Ford Credit could experience higher-than-expected credit losses, lower-than-anticipated residual values, or higher-than-expected return volumes for leased vehicles;
• Ford Credit could face increased competition from banks, financial institutions, or other third parties seeking to increase their share of financing Ford vehicles; and
• Ford Credit could be subject to new or increased credit regulations, consumer or data protection regulations, or other regulations.
We cannot be certain that any expectation, forecast, or assumption made in preparing forward-looking statements will prove accurate, or that any projection will be realized. It is to be expected
that there may be differences between projected and actual results. Our forward-looking statements speak only as of the date of their initial issuance, and we do not undertake any obligation to
update or revise publicly any forward-looking statement, whether as a result of new information, future events, or otherwise. For additional discussion, see “Item 1A. Risk Factors” above.
20Appendix
Company Net Income Reconciliation To Adjusted EBIT (Mils)
                                                                                  FY
                                                                      2017                 2018

      Net income / (Loss) attributable to Ford (GAAP)             $    7,731           $    3,677
      Income / (Loss) attributable to non-controlling interests              26                   18

        Net income / (Loss)                                       $    7,757           $    3,695
      Less: (Provision for) / Benefit from income taxes                 (402)                (650)

        Income / (Loss) before income taxes                       $    8,159           $    4,345
      Less: Special items pre-tax                                       (289)               (1,429)

        Income / (Loss) before special items pre-tax              $    8,448           $    5,774
      Less: Interest on debt                                           (1,190)              (1,228)

           Adjusted EBIT (Non-GAAP)                               $    9,638           $    7,002

       Memo:
      Revenue (Bils)                                              $    156.8           $    160.3

      Net income margin (GAAP) (Pct)                                    4.9%                 2.3%

      Adjusted EBIT Margin (Pct)                                        6.1%                 4.4%

                                                                                                       A1
Company Special Items (Mils)
FY
2017 2018
Pension and OPEB gain / (loss)
Year end net pension and OPEB remeasurement $ (162) $ (877)
Other pension remeasurement - 26
Pension curtailment 354 15
Total Pension and OPEB gain / (loss) $ 192 $ (836)
Separation-related actions $ (297) $ (537)
Other Items
San Luis Potosi plant cancellation $ 41 $ -
Next-generation Focus footprint change (225) (9)
Focus Active cancellation - (7)
Chariot closure - (40)
Total Other Items $ (184) $ (56)
Total pre-tax special items $ (289) $ (1,429)
Tax special items $ 897 $ (88)
A2Company Effective Tax Rate Reconciliation To Adjusted
Effective Tax Rate
Memo:
2018 FY FY 2017
Pre-Tax Results (Mils)
Income / (Loss) before income taxes (GAAP) $ 4,345 $ 8,159
Less: Impact of special items (1,429) (289)
Adjusted earnings before taxes (Non-GAAP) $ 5,774 $ 8,448
Taxes (Mils)
(Provision for) / Benefit from income taxes (GAAP) $ (650) $ (402)
Less: Impact of special items (88) 897
Adjusted (provision for) / benefit from income taxes (Non-GAAP) $ (562) $ (1,299)
Tax Rate (Pct)
Effective tax rate (GAAP) 15.0% 4.9%
Adjusted effective tax rate (Non-GAAP) 9.7% 15.4%
A3Company Earnings Per Share Reconciliation To Adjusted
Earnings Per Share
FY
2017 2018
Diluted After-Tax Results (Mils)
Diluted after-tax results (GAAP) $ 7,731 $ 3,677
Less: Impact of pre-tax and tax special items 608 (1,517)
Adjusted net income – diluted (Non-GAAP) $ 7,123 $ 5,194
Basic and Diluted Shares (Mils)
Basic shares (average shares outstanding) 3,975 3,974
Net dilutive options, unvested restricted stock units and restricted stock 23 24
Diluted shares 3,998 3,998
Earnings per share – diluted (GAAP)* $ 1.93 $ 0.92
Less: Net impact of adjustments 0.15 (0.38)
Adjusted earnings per share – diluted (Non-GAAP) $ 1.78 $ 1.30
A4Net Cash Provided By / (Used In) Operating Activities
Reconciliation To Company Adjusted Operating Cash
Flow (Mils) FY
2017 2018
Net cash provided by / (used in) operating activities (GAAP) $ 18,096 $ 15,022
Less: Items not included in Company Adjusted Operating Cash Flows
Ford Credit operating cash flows 9,300 8,171
Funded pension contributions (1,434) (437)
Separation payments (281) (179)
Other, net (52) 65
Add: Items included in Company Adjusted Operating Cash Flows
Automotive and Mobility capital spending (7,004) (7,737)
Ford Credit distributions 406 2,723
Settlement of derivatives 217 132
Pivotal conversion to a marketable security - 263
Company adjusted operating cash flow (Non-GAAP) $ 4,182 $ 2,781
Cash conversion (GAAP) 234% 409%
Adjusted cash conversion (Non-GAAP) 43% 40%
Note: Numbers may not sum due to rounding A5Adjusted ROIC (Bils)
2017 2018
Adjusted Net Operating Profit After Cash Tax
Net income attributable to Ford $ 7.7 $ 3.7
Add: Non-controlling interest 0.0 0.0
Less: Income tax (0.4) (0.7)
Add: Cash tax (0.6) (0.8)
Less: Interest on debt (1.2) (1.2)
Less: Total pension / OPEB income / (cost) 0.6 (0.4)
Add: Pension / OPEB service costs (1.1) (1.2)
Net operating profit after cash tax $ 7.0 $ 4.0
Less: Special items (excl. pension / OPEB) pre-tax (0.5) (0.6)
Adj. net operating profit after cash tax $ 7.5 $ 4.6
Invested Capital
Equity $ 35.6 $ 36.0
Redeemable non-controlling interest 0.1 0.1
Debt (excl. Ford Credit) 16.5 14.1
Net pension and OPEB liability 12.8 11.9
Invested capital (end of period) $ 65.0 $ 62.1
Average invested capital $ 63.4 $ 64.0
Adjusted ROIC (Non-GAAP)* 11.8% 7.1%
* Calculated as the sum of adjusted net operating profit after cash tax from the last four quarters, divided by the average invested capital over the last four quarters
A6Adjusted Debt / EBITDA Reconciliation
2018
Adjusted Debt
Debt (excl. Ford Credit) $ 14,147
Add: Unamortized discount & issuance costs 316
Add: Operating lease adjustment 1,511
Add: Net pension liability excl. prepaid assets 9,627
Adjusted Debt $ 25,601
EBITDA
Company adjusted EBIT $ 7,002
Less: Ford Credit EBT 2,627
Less: Equity in net income / (loss) of affiliated companies 95
Add: Specials (non-pension) (593)
Pension Adjustment
Interest cost 2,150
Expected return on assets (4,182)
Amortization of prior year service costs 168
Separation programs / other 156
Settlements and curtailments (non-special) (2)
Pension Adjustment (1,710)
Add: Depreciation and tooling amortization 5,384
Add: Operating lease expense 552
Adjusted EBITDA $ 7,913
Total debt to net income attributable to Ford (GAAP) 41.9:1
Adjusted debt to EBITDA (Non-GAAP) 3.2:1
A7Non-GAAP Financial Measures That Supplement GAAP Measures
We use both generally accepted accounting principles (“GAAP”) and non-GAAP financial measures for operational and financial decision making, and to assess Company and
segment business performance. The non-GAAP measures listed below are intended to be considered by users as supplemental information to their equivalent GAAP measures, to
aid investors in better understanding our financial results. We believe that these non-GAAP measures provide useful perspective on underlying business results and trends, and a
means to assess our period-over-period results. These non-GAAP measures should not be considered as a substitute for, or superior to, measures of financial performance
prepared in accordance with GAAP. These non-GAAP measures may not be the same as similarly titled measures used by other companies due to possible differences in method
and in items or events being adjusted.
• Company Adjusted EBIT (Most Comparable GAAP Measure: Net Income Attributable to Ford) – Earnings before interest and taxes (EBIT) includes non-controlling interests and
excludes interest on debt (excl. Ford Credit Debt), taxes, and pre-tax special items. This non-GAAP measure is useful to management and investors because it allows users to
evaluate our operating results relative to other companies in our industry. Pre-tax special items consist of (i) pension and OPEB remeasurement gains and losses, (ii) significant
personnel and dealer-related costs stemming from our efforts to match production capacity and cost structure to market demand and changing model mix, and (iii) other items
that we do not necessarily consider to be indicative of earnings from ongoing operating activities. When we provide guidance for adjusted EBIT, we do not provide guidance on
a net income basis because the GAAP measure will include potentially significant special items that have not yet occurred and are difficult to predict with reasonable certainty
prior to year-end, including pension and OPEB remeasurement gains and losses.
• Company Adjusted EBIT Margin (Most Comparable GAAP Measure: Company Net Income Margin) – Company Adjusted EBIT margin is Company adjusted EBIT divided by
Company revenue. This non-GAAP measure is useful to management and investors because it allows users to evaluate our operating results relative to other companies in our
industry.
• Adjusted Earnings Per Share (Most Comparable GAAP Measure: Earnings Per Share) – Measure of Company’s diluted net earnings per share adjusted for impact of pre-tax
special items (described above) and tax special items. The measure provides investors with useful information to evaluate performance of our business excluding items not
indicative of the underlying run rate of our business. When we provide guidance for adjusted earnings per share, we do not provide guidance on an earnings per share basis
because the GAAP measure will include potentially significant special items that have not yet occurred and are difficult to predict with reasonable certainty prior to year-end,
including pension and OPEB remeasurement gains and losses.
• Adjusted Effective Tax Rate (Most Comparable GAAP Measure: Effective Tax Rate) – Measure of Company’s tax rate excluding pre-tax special items (described above) and tax
special items. The measure provides an ongoing effective rate which investors find useful for historical comparisons and for forecasting. When we provide guidance for
adjusted effective tax rate, we do not provide guidance on an effective tax rate basis because the GAAP measure will include potentially significant special items that have not yet
occurred and are difficult to predict with reasonable certainty prior to year-end, including pension and OPEB remeasurement gains and losses.
29
A8
16Non-GAAP Financial Measures That Supplement GAAP Measures
• Company Adjusted Operating Cash Flow (Most Comparable GAAP Measure: Net Cash Provided By / (Used In) Operating Activities) – Measure of Company’s operating cash flow
excluding Ford Credit’s operating cash flows. The measure contains elements management considers operating activities, including Automotive and Mobility capital spending,
Ford Credit distributions to its parent, and settlement of derivatives. The measure excludes cash outflows for funded pension contributions, separation payments, and other
items that are considered operating cash outflows under U.S. GAAP. This measure is useful to management and investors because it is consistent with management’s
assessment of the Company’s operating cash flow performance. When we provide guidance for Company adjusted operating cash flow, we do not provide guidance for net cash
provided by/(used in) operating activities because the GAAP measure will include items that are difficult to quantify or predict with reasonable certainty, including cash flows
related to the Company's exposures to foreign currency exchange rates and certain commodity prices (separate from any related hedges), Ford Credit's operating cash flows,
and cash flows related to special items, including separation payments, each of which individually or in the aggregate could have a significant impact to our net cash provided
by/(used in) our operating activities.
• Adjusted Cash Conversion (Most Comparable GAAP Measure: Net Cash Provided By / (Used In) Operating Activities divided by Net Income Attributable to Ford (“cash
conversion”)) – Company Adjusted Cash Conversion is Company adjusted operating cash flow divided by Adjusted EBIT. This non-GAAP measure is useful to management and
investors because it allows users to evaluate how much of Ford's Adjusted EBIT is converted into cash flow.
• Adjusted Debt to EBITDA (Most Comparable GAAP Measure: Total Company Debt to Net income attributable to Ford) – This financial leverage ratio is commonly used to assess
a company’s ability to repay its debt. This measure is useful to management and investors because it helps to assess how long we would need to operate at our current level to
repay our debt (excl. Ford Credit’s debt). When we provide guidance for adjusted debt to EBITDA, we do not provide guidance for the most comparable GAAP measure because
the GAAP measure will include potentially significant special items that have not yet occurred and are difficult to predict with reasonable certainty prior to year-end, including
pension and OPEB remeasurement gains and losses. For more information, see the definitions of Adjusted Debt and Adjusted EBITDA.
• Adjusted Debt (Most Comparable GAAP Measure: Total Company Debt) – Measure of total company debt (excl. Ford Credit), adjusted to include unamortized discount/premium
and issuance costs (excl. Ford Credit), operating lease minimum commitments, and net pension liabilities excluding prepaid assets.
• Adjusted EBITDA (Most Comparable GAAP Measure: Net income attributable to Ford) – Measure of Company Adjusted EBIT (see definition), excluding Ford Credit EBT and
equity in net income/(loss) of affiliated companies, and further adjusted to include certain non-pension related special items, depreciation and tooling amortization (excl. Ford
Credit), operating lease expense, and certain pension costs.
• Adjusted ROIC – Adjusted Return on Invested Capital (“ROIC”) provides management and investors with useful information to evaluate the Company’s after-cash tax operating
return on its invested capital for the period presented. Adjusted net operating profit after cash tax measures operating results less special items, interest on debt (excl. Ford
Credit Debt), and certain pension/OPEB costs. Average invested capital is the sum of average balance sheet equity, debt (excl. Ford Credit Debt), and net pension/OPEB liability.
When we provide guidance for adjusted ROIC, we do not provide guidance on an unadjusted ROIC basis because it will include potentially significant special items that have not
yet occurred and are difficult to predict with reasonable certainty prior to year-end.
30
A9
A17Non-GAAP Financial Measures That Supplement GAAP Measures
• Ford Credit Managed Receivables (Most Comparable GAAP Measure: Net Finance Receivables plus Net Investment in Operating Leases) – Measure of Ford Credit’s total net
receivables, excluding unearned interest supplements and residual support, allowance for credit losses, and other (primarily accumulated supplemental depreciation). The
measure is useful to management and investors as it closely approximates the customer’s outstanding balance on the receivables, which is the basis for earning revenue.
• Ford Credit Managed Leverage (Most Comparable GAAP Measure: Financial Statement Leverage) – Ford Credit’s debt-to-equity ratio adjusted (i) to exclude cash, cash
equivalents, and marketable securities (other than amounts related to insurance activities), and (ii) for derivative accounting. The measure is useful to investors because it
reflects the way Ford Credit manages its business. Cash, cash equivalents, and marketable securities are deducted because they generally correspond to excess debt beyond
the amount required to support operations and on-balance sheet securitization transactions. Derivative accounting adjustments are made to asset, debt, and equity positions to
reflect the impact of interest rate instruments used with Ford Credit’s term-debt issuances and securitization transactions. Ford Credit generally repays its debt obligations as
they mature, so the interim effects of changes in market interest rates are excluded in the calculation of managed leverage.
31
A10
A18Definitions And Calculations
Wholesales and Revenue
• Wholesale unit volumes include all Ford and Lincoln badged units (whether produced by Ford or by an unconsolidated affiliate) that are sold to dealerships, units manufactured by
Ford that are sold to other manufacturers, units distributed by Ford for other manufacturers, and local brand units produced by our China joint venture, Jiangling Motors
Corporation, Ltd. (“JMC”), that are sold to dealerships. Vehicles sold to daily rental car companies that are subject to a guaranteed repurchase option (i.e., rental repurchase), as
well as other sales of finished vehicles for which the recognition of revenue is deferred (e.g., consignments), also are included in wholesale unit volumes. Revenue from certain
vehicles in wholesale unit volumes (specifically, Ford badged vehicles produced and distributed by our unconsolidated affiliates, as well as JMC brand vehicles) are not included in
our revenue
Industry Volume and Market Share
• Industry volume and market share are based, in part, on estimated vehicle registrations; includes medium and heavy duty trucks
SAAR
• SAAR means seasonally adjusted annual rate
Market Factors
• Volume and Mix – primarily measures EBIT variance from changes in wholesale volumes (at prior-year average contribution margin per unit) driven by changes in industry volume,
market share, and dealer stocks, as well as the EBIT variance resulting from changes in product mix, including mix among vehicle lines and mix of trim levels and options within a
vehicle line
• Net Pricing – primarily measures EBIT variance driven by changes in wholesale prices to dealers and marketing incentive programs such as rebate programs, low-rate financing
offers, special lease offers and stock accrual adjustments on dealer inventory
• Market Factors exclude the impact of unconsolidated affiliate wholesales
ROE
• Reflects return on equity calculated by annualizing net income for the period and dividing by monthly average equity for the period
Earnings Before Taxes (EBT)
• Reflects Ford Credit’s Income before income taxes
Note: Calculated results may not sum due to rounding
32
A11
A19You can also read