Investor Presentation - First Quarter 2020
←
→
Page content transcription
If your browser does not render page correctly, please read the page content below
Investor Presentation

                                                        First Quarter 2020

         Confidential and proprietary information. © 2019 Sallie Mae Bank. All rights reserved.
Forward-Looking Statements and Disclaimer

Cautionary Note Regarding Forward-Looking Statements

The following information is current as of January 22, 2020 (unless otherwise noted) and should be read in connection with the press release of SLM Corporation (the
“Company”) announcing its financial results for the quarter and full-year ended December 31, 2019, filed with the Securities and Exchange Commission (“SEC”) on January 22,
2020, and subsequent reports filed with the SEC.

This Presentation contains “forward-looking” statements and information based on management’s current expectations as of the date of this Presentation. Statements that are
not historical facts, including statements about the Company’s beliefs, opinions or expectations and statements that assume or are dependent upon future events, are forward-
looking statements. This includes, but is not limited to: the Company’s expectation and ability to pay a quarterly cash dividend on its common stock in the future, subject to the
determination by, and discretion of, the Company’s Board of Directors, and based on an evaluation of the Company’s earnings, financial condition and requirements, business
conditions, capital allocation determinations, and other factors, risks and uncertainties; the Company’s 2020 guidance; the Company’s three-year horizon outlook; the
Company’s expectation and ability to execute loan sales and share repurchases; the Company’s projections for originations and earnings growth and balance sheet position; and
any estimates related to accounting standard changes. Forward-looking statements are subject to risks, uncertainties, assumptions and other factors that may cause actual
results to be materially different from those reflected in such forward-looking statements. These factors include, among others, the risks and uncertainties set forth in Item 1A.
“Risk Factors” and elsewhere in the Company’s Annual Report on Form 10-K for the year ended Dec. 31, 2018 (filed with the SEC on Feb. 28, 2019) and subsequent filings with
the SEC; increases in financing costs; limits on liquidity; increases in costs associated with compliance with laws and regulations; failure to comply with consumer protection,
banking and other laws; changes in accounting standards and the impact of related changes in significant accounting estimates, including any regarding the measurement of the
Company’s allowance for loan losses and the related provision expense; any adverse outcomes in any significant litigation to which the Company or any subsidiary is a party;
credit risk associated with the Company’s (or any subsidiary's) exposure to third parties, including counterparties to the Company’s (or any subsidiary's) derivative transactions;
and changes in the terms of education loans and the educational credit marketplace (including changes resulting from new laws and the implementation of existing laws). The
Company could also be affected by, among other things: changes in its funding costs and availability; reductions to its credit ratings; cybersecurity incidents, cyberattacks, and
other failures or breaches of its operating systems or infrastructure, including those of third-party vendors; damage to its reputation; risks associated with restructuring
initiatives, including failures to successfully implement cost-cutting programs and the adverse effects of such initiatives on the Company’s business; changes in the demand for
educational financing or in financing preferences of lenders, educational institutions, students and their families; changes in law and regulations with respect to the student
lending business and financial institutions generally; changes in banking rules and regulations, including increased capital requirements; increased competition from banks and
other consumer lenders; the creditworthiness of customers; changes in the general interest rate environment, including the rate relationships among relevant money-market
instruments and those of earning assets versus funding arrangements; rates of prepayments on the loans owned by the Company and its subsidiaries; changes in general
economic conditions and the Company’s ability to successfully effectuate any acquisitions; and other strategic initiatives. The preparation of the Company’s consolidated
financial statements also requires management to make certain estimates and assumptions, including estimates and assumptions about future events. These estimates or
assumptions may prove to be incorrect. All forward-looking statements contained in this Presentation are qualified by these cautionary statements and are made only as of the
date of this Presentation. The Company does not undertake any obligation to update or revise these forward-looking statements to conform such statements to actual results or
changes in its expectations.

The Company reports financial results on a GAAP basis and also provides certain non-GAAP “Core Earnings” performance measures. The difference between the Company’s
“Core Earnings” and GAAP results for the periods presented were the unrealized, mark-to-fair value gains/losses on derivative contracts (excluding current period accruals on
the derivative instruments), net of tax. These are recognized in GAAP, but not in “Core Earnings” results. The Company provides “Core Earnings” measures because this is what
management uses when making management decisions regarding the Company’s performance and the allocation of corporate resources. The Company’s “Core Earnings” are
not defined terms within GAAP and may not be comparable to similarly titled measures reported by other companies.

For additional information, see “Management’s Discussion and Analysis of Financial Condition and Results of Operations –’Core Earnings’” in the Company’s Quarterly Report on
Form 10-Q for the quarter ended September 30, 2019 for a further discussion and the “’Core Earnings’ to GAAP Reconciliation” table in this Presentation for a complete
reconciliation between GAAP net income and “Core Earnings”.

                                                                                                                                                                                      2
Well-Positioned for Long-Term Success and Value Creation
MARKET LEADING BRAND ATTRACTIVE PRODUCTS EXCEPTIONAL SERVICE
• Leader of the education • Products designed to provide • Largest salesforce in the
finance market customers success through industry
higher education
• Industry leading 54% market • Complaints per customer
share1 • Diverse portfolio offers decreased 42% over the last
financing solutions for all forms 4 years31
• Over 2,400 actively
of higher education, including
managed university • Customer satisfaction
undergraduate, parent,
relationships across the U.S. reached an all-time high of
medical, dental, MBA, law,
80% in 201931
• Appear on 98% of preferred health professions and general
lender lists studies • Sallie Mae has been
recognized by J.D. Power by
providing “An Outstanding
Customer Service
Experience” for Phone
support30
Providing access, planning outcomes, and helping students and families responsibly
fund their future
3Serving Customers in an Attractive and Growing Market
Expanding Addressable Market
• Private Education Loans represent 2-3% of
Other
the overall spend in higher education annually
$17 Federal
Loans
• Total spend on higher education grows 2-3%
$93 annually primarily due to increases in cost of
Grants
$136 Private attendance
Education
Loans Higher Education Becoming More Prevalent
$458B $12
• Attainment of a four-year college degree or
Annually28 more is up 11% between 2012 and 20172
• 58% of students graduated with student loans
in AY 2017-20185
Family
Contribution
$200 • Of the 58% of bachelor’s degree recipients
who graduated with student loans, the
average debt amount was $29,0005
Academic Year 2018 / 2019
4Higher Education Value Proposition
Unemployment rates and earnings by educational attainment, 2017 2
Unemployment Rate Median Usual Weekly Earnings
Unemployment Rate Median Usual Weekly Earnings
Doctoral Degree 1.50% $1,743
Doctoral Degree 1.50% $1,743
Professional Degree 1.50% $1,836
Professional Degree 1.50% $1,836
Master's Degree 2.20% $1,401
Master's Degree 2.20% $1,401
Bachelor's Degree 2.50% $1,173
Bachelor's Degree 2.50% $1,173
Associate's Degree 3.40% $836
Associate's Degree 3.40% $836
Some College, No Degree 4% $774
Some College, No Degree 4% $774
High School Diploma 4.60% $712
High School Diploma 4.60% $712
Less than a High School Diploma 6.50% $520
Less than a High School Diploma 6.50% $520
Obtaining a College Degrees Prepares Students for Success
• The unemployment rate for individuals age 25 years and over with four-year college degrees
was 1.8%, compared to 3.7% for those with only a high school diploma4
• Students who earn a four-year college degree earn 64.7% more than high school graduates4
5Sallie Mae is an ESG Company
Serving our Customers Providing Financial Education & Assistance
• Financing assistance to 1.2 million families since 2014 • Free Scholarship Search tool with 5 million
to provide access to postsecondary education and scholarships worth more than $25 billion
opportunities for success • 20,000 students earned at least 1 scholarship via our
• Policies help to ensure that 98% of customers are search tool last year and received $61 million
effectively managing their payments • $785,000 in Sallie Mae Bridging the Dream
• Sallie Mae has been recognized by J.D. Power by Scholarships awarded since 2016, with $192,000 of
providing “An Outstanding Customer Service that directly raised by employees
Experience” for Phone support30
Committed to an Ethical & Diverse Workplace Building Strong Communities
• Board of Directors composition is 33% women, • Giving back through employee volunteer work and
earning the Winning “W” Company designation from community investments
Women on Boards • $1.06 million in total charitable giving in 2019
• Marketplace Ethics Award from the Better Business • Employee Volunteer Program that encourages
Bureau employees to participate in activities they are
• Listing among America’s Best Midsize Employers by passionate about
Forbes
Committed to operating with integrity and engaging with
stakeholders on key topics
6Diverse Product Portfolio Driving Increased Shareholder Value
Undergraduate Graduate Parent
RATE TYPE Variable & Fixed Variable & Fixed Variable & Fixed
Medical Health Dental Variable: LIBOR + Variable: LIBOR + Variable: LIBOR +
Professions 1.250% - LIBOR + 2.25% - LIBOR + 3.50% - LIBOR +
INTEREST
9.875% 7.88% 9.88%
RATE RANGES
Fixed: 5.00% - Fixed: 5.75% - Fixed: 5.75% -
12.875% 10.50% 12.88%
Deferred, Interest Deferred, Interest
REPAYMENT Interest Only, Full
General MBA Undergraduate Only & Fixed Only & Fixed
OPTION P&I
Studies Repayment Repayment
20 years for
Medical and Dental
REPAYMENT
5-15 years 15 years for 10 years
TERM
Remaining
Disciplines
Law Parent
GRACE PERIOD 6 months 6-36 months None
• Increased Total Net Private Education INTERNSHIP /
Loan Portfolio 13% in 2019 to $22.9B RESIDENCY Up to 60 months Up to 48 months None
at 12/31/19 DEFERMENT
• Debuting new products designed to ACH discount |
ACH discount |
FICO Score | ACH discount |
meet the needs of all students Cosigner Release |
FICO Score |
FICO Score | Study
Cosigner Release |
• Developing unique and innovative FEATURES GRP | Study
GRP | Student
Starter | Student
Starter | Student Death & Disability
products to diversify portfolio Death & Disability
Death & Disability
Release
Release
Release
7High Quality Private Education Loan Portfolio
Customer FICO at Original Approval7 Smart Option Payment TypeSuccessfully Executing Strategy and Growing Originations
PRIVATE EDUCATION LOANS OUTSTANDING, NET ORIGINATIONS
CAGR: 22% CAGR: 6.8%
$22.9 $5,625
$4,330
$10.5
2015 2019 2015 2019
Expect to maintain momentum and continue originations growth in 2020
9Delivering Strong Financial Results
GAAP DILUTED EPS NET INTEREST INCOME PRIVATE EDUCATION
LOAN YIELD
BPS Improvement:
CAGR: 22% CAGR: 23% 139bps
$1.30 $1,623M 9.32%
$0.59
$702M 7.93%
2015 2019 2015 2019 2015 2019
2019 Financial Highlights (Compared to 2018)
• 2019 GAAP diluted EPS increased 21% to $1.30
• 2019 net interest income increased 15% to $1.6B
• Average yield on Private Education Loans increased 22 basis points to 9.32% 10Product suite tailored to meet the
needs of undergraduate and
graduate students
• Introduced Smart Option Student Loan in
2009
• Flexible repayment options while in school
• Fixed and Variable rates for repayment
• Differentiated products for undergraduates
and graduate students
11Conservative underwriting has
contributed to consistent credit
performance
• Proprietary Scorecard built with Experian
Decision Analytics
• Initial credit screen removes applicants with
low FICO scores or prior derogatory trades
on file
• Manually review ~8% of applications
• Through-the-cycle data was used to develop
our conservative underwriting models
12High Quality, Predictable Credit Program8,9,10
Smart Option Cumulative Gross Defaults by P&I Repayment Vintage
and Years Since First P&I Repayment Period
10%
9%
8%
Disbursed Principal Entering P & I Repayment
7%
Cumulative Defaults as a % of
6%
5%
5.6%
4%
4.1%
3%
3.0%
2%
1% 1.5%
0.3%
0%
0 1 2 3 4 5 6 7 8
Years Since First P&I Repayment Period
2010 2011 2012 2013 2014 2015 2016 2017 2018 2019
13Conservative Funding Optimizes Net Interest Margin
Secured Debt
15% Retail
MMDA & CD
23%
Brokered $13.8b
Retail $10.5b
Secured Debt $4.4b
Retail
H.S.A. & 529
Brokered 14%
Variable
37%
Brokered
Fixed
11%
As of 12/31/19
14Optimizing our Portfolio25
Continue to Focus on High-
Quality Private Education Loan LOAN SALES CONTINUE TO INVEST IN
Originations CREDIT CARD
• Expect to grow • Expect to sell ~$3B in • Launched new credit
originations 6% in loans in 2020, dependent card in October 2019
2020 upon market conditions designed for college
• Discontinued students and young
• Loan sales allow SLM to adults
originations of return excess capital to
Personal Loans shareholders through • Rewards can be used
as of December share repurchases to repay student loan
15, 2019 debt
• To drive continued
success, expect to
invest $0.05 per share
in 2020
15CECL Update24,25
• Financial Accounting Standards Board’s Current Expected Credit Loss (“CECL”) impairment standard will
require “life of loan” estimates of losses to be recorded at origination and became effective for the Company
on January 1, 2020.
• CECL requires the Company to measure its allowance for losses based upon the estimate of current
expected credit losses, and will have a significant impact on diluted GAAP earnings per share and diluted
“Core Earnings” per share as adjustments are made to the allowance for loan losses in future periods to
reflect life-of-loan expected losses.
• CECL will have a material impact on how the Company records and reports its financial condition and
results of operations and on regulatory capital.
• The Company’s first-quarter 2020 financial results will reflect a transition adjustment that is currently
estimated to increase the allowance for loan losses by approximately $1.1 billion, increase the liability
representing its off-balance sheet exposure for unfunded commitments by approximately $115 million,
and increase the deferred tax asset by approximately $300 million, resulting in a cumulative effect
adjustment currently estimated to reduce retained earnings by approximately $950 million.
• The Private Education Loan allowance for losses as a percentage of ending total Private Education
Loan balance after the adoption of CECL is estimated to initially be approximately 6.7 percent.
• These adjustments will be refined and reflected in the Company’s first-quarter 2020 financial results.
• The Company has elected the three-year phase in for the initial impact of adopting CECL for regulatory
capital adequacy purposes.
• Sallie Mae intends to elect the three-year phase in for the initial impact of adopting CECL for regulatory
capital adequacy purposes, and expects to remain above the current definition of “Well Capitalized” after
implementation of CECL.
162020 Guidance25
Metrics 2020 Full-Year Guidance
Diluted “Core Earnings27” per share $1.85 - $1.91
Provisions for credit losses $285 million - $305 million
Total portfolio net charge-offs $275 million - $285 million
Private Education Loan originations growth 6%
Non-interest expenses $570 million - $580 million
Loan sales ~$3 billion to fund $600 million of share repurchases
Well-positioned to build on our momentum and execute on our strategy
17Strong Balance Sheet
Entering 2020, Total Common Equity Tier
Risk-Based Capital 1 Risk-Based Capital
ratio was at ratio of
13.4% 12.2%
Planned loan Expect the balance sheet
asset sales of to be flat over the next
~$3B 3 years
will provide flexibility to despite the impact
the balance sheet25 of CECL25
As of 12/31/19
18Committed to Returning Capital to Shareholders25
INVEST IN HIGH ROE GROWTH
• Continue to focus on high-quality Private Education Loan originations,
including deeper penetration of graduate school market
• Offer credit cards to high-quality customer base
QUARTERLY COMMON STOCK DIVIDEND
INCREASED • Paid $0.03 quarterly common stock dividend on 12/16/19
SHAREHOLDER • Expect to grow common stock dividend with earnings29
RETURNS
SHARE REPURCHASE
• $167M of share authorization repurchased in 2019
• New Authorization to repurchase up to $600M in 2020
• Expected $3B in loans sales expected to enable return of excess
capital to shareholders
193-Year Horizon25
Originations ~6% growth per year
Loan Sales ~$3B per year contingent on market conditions
Balance Sheet Remains at ~$32B due to loan sales
Earnings Per Share Significant increase in 2020 driven by loan sales and share
repurchases, followed by mid single digit EPS growth thereafter
Capital Return • Continue to pay common and preferred stock dividends
• Proceeds of loan sales to opportunistically repurchase up to $1.4B
in common stock over the next three years
Confident in our future and ability to deliver value creation
20ABS Supplement
Sallie Mae’s Smart Option Loan Product Overview

The Smart Option loan product was introduced by Sallie Mae in 2009

                                                                            •   Smart Option payment option may not be
                         The Smart Option loan program                          changed after selected at origination
                         consists of:                                       •   Fixed-rate loans or variable-rate loans
                                                                                indexed to LIBOR

                                                                            •   Consumer credit underwriting, with
   Smart Option          Require full interest payments during in-school,       minimum FICO, custom credit score
   Interest Only loans   grace, and deferment periods                           model and judgmental underwriting

                                                                            •   Marketed primarily through the school
   Smart Option          Require $25 fixed payments during in-school,           channel and also directly to consumers,
   Fixed Pay loans       grace, and deferment periods                           with all loans certified by and disbursed
                                                                                directly to schools

   Smart Option          Do not require payments during in-school and       •   Private education loans are typically non-
   Deferred loans        grace periods                                          dischargeable in bankruptcy, unless a
                                                                                borrower can prove that repayment of the
                                                                                loan would impose an "undue hardship“

                                                                                                                          22
Sallie Mae Bank ABS Summary
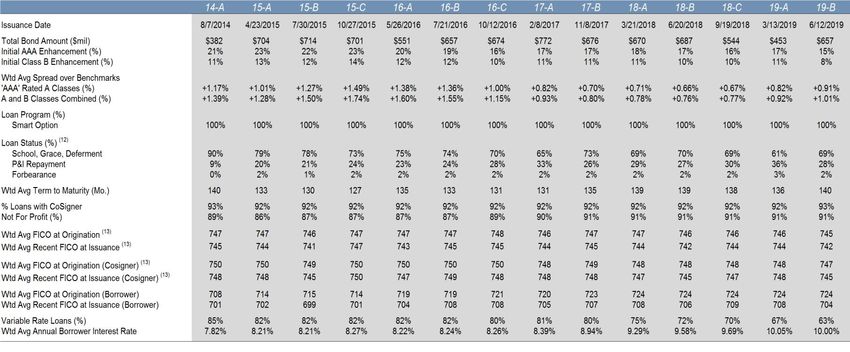
23Sallie Mae Bank ABS Structures
SMB 2019-B SMB 2019-A SMB 2018-C
SIZE $657.0MM $453.0MM $544.0MM
PRICING DATE June 4, 2019 March 5, 2019 September 12, 2018
Smart Option Smart Option Smart Option
COLLATERAL
Private Education Loans Private Education Loans Private Education Loans
SERVICER Sallie Mae Bank Sallie Mae Bank Sallie Mae Bank
OVERCOLLATERALIZATION 14 10% 10% 10%
PRICING
8% 8% 8%
PREPAYMENT SPEED 15
TRANCHE STRUCTURE AT
ISSUANCE Amt Amt Amt
Class ($mm) Mdy's WAL Pricing Class ($mm) Mdy's WAL Pricing Class ($mm) Mdy's WAL Pricing
A-1 201.00 Aaa 0.99 1mL +35 A-1 151.00 Aaa 0.99 1mL +35 A-1 177.00 Aaa 0.99 1mL +30
A-2A 304.00 Aaa 5.43 IntS +95 A-2A 217.00 Aaa 5.41 IntS +87 A-2A 219.00 Aaa 5.46 IntS +68
A-2B 102.00 Aaa 5.43 1mL +100 A-2B 50.00 Aaa 5.41 1mL +87 A-2B 108.00 Aaa 5.46 1mL +75
B 50.00 Aa1 9.88 IntS +150 B 35.00 Aa2 9.52 IntS +140 B 40.00 Aa1 9.68 IntS +130
WA BORROWER INTEREST 10.00% 10.05% 9.69%
RATE
WA FICO AT ORIGINATION13 745 746 746
% LOANS WITH COSIGNER 93% 92% 92%
VARIABLE RATE LOANS 63% 67% 70%
24Appendix
Quarterly Financial Highlights

                                 26
Annual Financial Highlights
27Sallie Mae vs Federal Student Loans
28“Core Earnings” to GAAP Reconciliation
29Important Information Regarding Historical Loan Performance Data
On April 30, 2014 (the “Spin-Off Date”), the former SLM Corporation legally separated (the “Spin-Off”) into two distinct publicly-traded entities: an education loan management, servicing and asset recovery business called Navient Corporation (“Navient”), and a consumer banking
business called SLM Corporation. SLM Corporation’s primary operating subsidiary is Sallie Mae Bank. We sometimes refer to SLM Corporation, together with its subsidiaries and its affiliates, during the period prior to the Spin-Off as “legacy SLM.”
In connection with the Spin-Off, all private education loans owned by legacy SLM, other than those owned by its Sallie Mae Bank subsidiary as of the date of the Spin-Off, and all private education loan asset-backed securities (“ABS”) trusts previously sponsored and administered by
legacy SLM were transferred to Navient. As of the Spin-Off Date, Navient and its sponsored ABS trusts owned $30.8 billion of legacy SLM’s private education loan portfolio originated both prior to and since 2009. As of the Spin-Off Date, Sallie Mae Bank owned $7.2 billion of private
education loans, the vast majority of which were unencumbered Smart Option Student Loans originated since 2009.
Legacy SLM’s Private Education Loan and ABS Programs Prior to the Spin-Off
In 1989, legacy SLM began making private education loans to graduate students. In 1996, legacy SLM expanded its private education loan offerings to undergraduate students. Between 2002 and 2007, legacy SLM issued $18.6 billion of private education loan-backed ABS in 12
separate transactions.
In 2008, in response to the financial downturn, legacy SLM revised its private education loan underwriting criteria, tightened its forbearance and collections policies, ended direct-to-consumer disbursements, and ceased lending to students attending certain for-profit schools. Legacy
SLM issued no private education loan ABS in 2008.
In 2009, legacy SLM introduced its Smart Option Student Loan product and began underwriting private education loans with a proprietary custom credit score. The custom credit score included income-based factors, which led to a significant increase in the percentage of loans
requiring a co-signer, typically a parent. The initial loans originated under the Smart Option Student Loan program (the “Interest Only SOSLs”) were variable rate loans and required interest payments by borrowers while in school, which reduced the amounts payable over the loans’
lives and helped establish repayment habits among borrowers. In 2010, legacy SLM introduced a second option for its Smart Option Student Loan customers, which required a $25 fixed monthly payment while borrowers were in school (the “Fixed Pay SOSLs”). In 2011, legacy SLM
introduced another option for its Smart Option Student Loan customers, which allowed borrowers to defer interest and principal payments until after a student graduates or separates from school (the “Deferred SOSLs”). In 2012, legacy SLM introduced a fixed rate loan option for its
Interest Only, Fixed Pay and Deferred SOSLs. Borrowers must select which of these options they prefer at the time of loan origination and are not permitted to change those options once selected.
In 2011, legacy SLM included private education loans originated under the Smart Option Student Loan program in its ABS pools for the first time. Between 2011 and 2014, the mix of Smart Option Student Loans included in legacy SLM’s private education loan ABS steadily increased as
a percentage of the collateral pools, from 10% initially to 64% in later transactions.
Sallie Mae Bank’s Private Education Loan and ABS Programs Post-Spin-Off
Originations. Following the Spin-Off, Sallie Mae Bank continued to originate loans under the Smart Option Student Loan program. As of December 31, 2019, it owned $23.2 billion of private education loans (gross), the vast majority of which were Smart Option Student Loans
originated since 2013.
Servicing. Immediately prior to the Spin-Off, Sallie Mae Bank assumed responsibility for collections of delinquent loans on the vast majority of its Smart Option Student Loan portfolio. Following the Spin-Off Date, Navient continued to service all private education loans owned by the
two companies on its servicing platform until October 2014, when servicing for the vast majority of Sallie Mae Bank’s private education loan portfolio was transitioned to Sallie Mae Bank. Sallie Mae Bank now services and is responsible for collecting the vast majority of the Smart
Option Student Loans it owns.
Securitization and Sales. In August 2014, Sallie Mae Bank sponsored its first private education loan ABS, SMB Private Education Loan Trust 2014-A (the “SMB 2014-A transaction”). Because this transaction occurred prior to the transfer of loan servicing from Navient to Sallie Mae Bank,
Sallie Mae Bank acted as master servicer for the transaction and Navient as subservicer, and the loan pool is serviced pursuant to Navient servicing policies. In April 2015 and October 2015, Sallie Mae Bank sponsored securitizations and residual sales, SMB Private Education Loan Trust
2015-A and SMB Private Education Loan Trust 2015-C, respectively. Sallie Mae Bank also sponsored on-balance sheet term securitizations as follows:
Date Transaction Date Transaction Date Transaction
July 2015 SMB Private Education Loan Trust 2015-B May 2016 SMB Private Education Loan Trust 2016-A February 2017 SMB Private Education Loan Trust 2017-A
July 2016 SMB Private Education Loan Trust 2016-B October 2016 SMB Private Education Loan Trust 2016-C November 2017 SMB Private Education Loan Trust 2017-B
March 2018 SMB Private Education Loan Trust 2018-A June 2018 SMB Private Education Loan Trust 2018-B September 2018 SMB Private Education Loan Trust 2018-C
March 2019 SMB Private Education Loan Trust 2019-A June 2019 SMB Private Education Loan Trust 2019-B
Sallie Mae Bank services the loans in all of the securitizations it has sponsored following the SMB 2014-A transaction.
Additional Information. Prior to the Spin-Off, all Smart Option Student Loans were originated and initially held by Sallie Mae Bank, as a subsidiary of legacy SLM. Sallie Mae Bank typically then sold certain of the performing Smart Option Student Loans to an affiliate of legacy SLM for
securitization. Additionally, on a monthly basis Sallie Mae Bank sold all loans that were over 90 days past due, in forbearance, restructured or involved in a bankruptcy to an affiliate of legacy SLM. As a result of this second practice, prior to the occurrence of the Spin-Off, historical
performance data for Sallie Mae Bank’s Smart Option Student Loan portfolio reflected minimal later stage delinquencies, forbearance or charge-offs.
Legacy SLM collected Smart Option Student Loans pursuant to policies that required loans be charged off after 212 days of delinquency. In April 2014, Sallie Mae Bank began collecting the vast majority of its Smart Option Student Loans pursuant to policies that required loans be
charged off after 120 days of delinquency, in accordance with bank regulatory guidance. For the reasons described above, a portion of Sallie Mae Bank’s historical performance data does not reflect current collections and charge off practices and may not be indicative of the future
performance of the Bank’s Smart Option Student Loans.
30Important Information Regarding Historical Loan Performance Data (cont.)
Types of Smart Option Student Loan Portfolio Data
The portfolio data we used in this report comes from two separate sources of information:
(1) Combined Smart Option Student Loan Portfolio Data for Legacy SLM, Navient and Sallie Mae Bank. Information in this category is presented on a combined basis for loans originated under the Smart Option Student Loan program, whether originated by
Sallie Mae Bank when it was part of legacy SLM or by Sallie Mae Bank post Spin-Off, and regardless of whether the loan is currently held by an ABS trust, or held or serviced by Navient or Sallie Mae Bank. Data in this category is used in the tables below under
the following headings:
• “Cumulative Defaults by P&I Repayment Vintage and Years Since First P&I Repayment Period” – Only for 2010-2014 P&I Repayment Vintages
This combined Smart Option Student Loan portfolio data provides insight into gross defaults of the covered vintages of Smart Option Student Loans since 2010, regardless of ownership or servicing standard. Data available for earlier periods includes a limited
number of Smart Option Student Loan product types.
Loans contained in the combined Smart Option Student Loan portfolio category were serviced by legacy SLM prior to the Spin-Off, and by either Navient or Sallie Mae Bank after the Spin-Off. As noted above, loans serviced by legacy SLM and Navient were
serviced pursuant to different policies than those loans serviced by Sallie Mae Bank after the Spin-Off. Specifically, legacy SLM charged off loans after 212 days of delinquency, and Navient has continued this policy. Sallie Mae Bank currently charges off loans
after 120 days of delinquency. All loans included in the combined Smart Option Student Loan portfolio that were serviced by legacy SLM prior to the Spin-Off were serviced pursuant to a 212-day charge off policy. Following the Spin-Off, a portion of the loans
included in the combined Smart Option Student Loan portfolio data have been serviced by Navient pursuant to a 212-day charge off policy, and a portion have been serviced by Sallie Mae Bank pursuant to a 120-day charge off policy. As a result, future
performance of loans serviced by Sallie Mae Bank may differ from the historical performance of loans reflected in this combined Smart Option Student Loan portfolio data.
(2) Smart Option Student Loan Portfolio Data for Sallie Mae Bank Serviced Loans. Information in this category is presented for loans originated under the Smart Option Student Loan program, whether originated by Sallie Mae Bank when it was part of legacy
SLM or by Sallie Mae Bank post Spin-Off, and regardless of whether the loan is currently held by an ABS trust. All loans in this category are serviced by Sallie Mae Bank. Data in this category is used in the tables below under the following headings:
• “Cumulative Defaults by P&I Repayment Vintage and Years Since First P&I Repayment Period” – Only for 2015-
2019 P&I Repayment Vintages
In relation to cumulative defaults, the Sallie Mae Bank Serviced portfolio data provides insight into gross defaults of the Smart Option Student Loans covered and serviced by Sallie Mae Bank since 2015, regardless of ownership. We believe historical loan
performance data since 2015 is more representative of the expected performance of Smart Option Student Loans to be included in new Sallie Mae Bank trusts than data available for earlier periods. Loans contained in the Smart Option Student Loan Portfolio
Data for Sallie Mae Bank Serviced Loans category were serviced by legacy SLM prior to the Spin-Off, and by Sallie Mae Bank after the Spin-Off. Sallie Mae Bank currently charges off loans after 120 days of delinquency.
Any data or other information presented in the following charts is for comparative purposes only, and is not to be deemed a part of any offering of securities.
A portion of the Smart Option Student Loan performance data described above was provided to Sallie Mae Bank by Navient under a data sharing agreement executed in connection with the Spin-Off. This data sharing agreement expired on April 29,
2019 and, as a result, cumulative gross default data for pre-2015 P&I Repayment Vintages is held static as of December 31, 2018. Under the data sharing agreement, Navient made no representations or warranties to Sallie Mae Bank concerning the
accuracy and completeness of information that it provided. Sallie Mae Bank has not independently verified, and is not able to verify, the accuracy or completeness of the data provided under the agreement
31Smart Option Loan Program Cohort Default Triangles
Terms and calculations used in the cohort default triangles are defined below:
First P&I Repayment Period – The month during which a borrower is first required to make a full principal and interest payment on a loan.
P&I Repayment Vintage – The calendar year of a loan’s First P&I Repayment Period.
Disbursed Principal Entering P&I Repayment – The total amount of disbursed loan principal in a P&I Repayment Vintage, excluding any interest capitalization.
Reported Default Data –
o For loans that default after their First P&I Repayment Period: Loans enter a particular annual P&I Repayment Vintage at different times during the P&I
Repayment Vintage year. Default data is not reported for loans in a particular annual P&I Repayment Vintage until the First P&I Repayment Period has occurred
for all loans in that annual P&I Repayment Vintage. Once reporting starts, data reflects defaults that occurred in a particular period through the number of months
since December 31 of that annual P&I Repayment Vintage year. For example, in the relevant charts and tables included in this presentation as of December 31,
2019: (i) default data reported for loans in the 2018 P&I Repayment Vintage represents defaults occurring during the first 12 months after a loan’s First P&I
Repayment Period regardless of the month in 2018 during which the first full principal and interest payment for that loan became due; and (ii) default data for
loans in the 2017 P&I Repayment Vintage represents defaults occurring during the first 24 months after a loan’s First P&I Repayment Period regardless of the
month in 2017 during which the first full principal and interest payment for that loan became due.
o For loans that default prior to their First P&I Repayment Period: Loans defaulting prior to their First P&I Repayment Period are included in the P&I
Repayment Vintage corresponding to the calendar year in which the default occurs, and are aggregated and reported in Year 0 of that P&I Repayment Vintage in
the relevant charts and tables. For example: (a) if a loan’s First P&I Repayment Period was scheduled for 2018, but the loan defaulted in 2017, the default
amount is reflected in Year 0 of the 2017 P&I Repayment Vintage; and (b) if a loan’s First P&I Repayment Period occurred in 2018, but the loan defaulted in 2018
before that First P&I Repayment Period, the default amount is reflected in Year 0 of the 2018 P&I Repayment Vintage.
o For loans that pay off prior to their First P&I Repayment Period: Loans paid off prior to their First P&I Repayment Period are included in the Disbursed
Principal Entering P&I Repayment of the P&I Repayment Vintage corresponding to the calendar year in which the payoff occurs.
Periodic Defaults – For any loan in a particular P&I Repayment Vintage, the defaulted principal and interest is reflected in the year corresponding to the number of
years since the First P&I Repayment Period for that loan.
Cumulative Defaults – At any time for a particular P&I Repayment Vintage, the cumulative sum of Periodic Defaults for that vintage.
o Defaulted principal includes any interest capitalization that occurred prior to default
o Defaulted principal is not reduced by any amounts recovered after the loan defaulted
o Because the numerator includes capitalized interest while the denominator (i.e., Disbursed Principal Entering P&I Repayment) does not, default rates are higher
than they would be if the numerator and denominator both included capitalized interest
Note: Cumulative gross defaults for pre-2015 P&I Repayment Vintages are held static as of December 31, 2018.
Note: Historical trends suggested by the cohort default triangles may not be indicative of future performance. Legacy SLM and Navient serviced loans were serviced pursuant to a 212 day charge-off policy. Sallie
Mae Bank serviced loans were serviced pursuant to a 120 day charge-off policy.
32Footnotes
1. Source: MeasureOne CBA Report as of September 2019
2. U.S. Bureau of Labor Statistics, Current Population Survey
3. Source: Trends in Student Aid,© 2019 The College Board, www.collegeboard.org, U.S. Department of Education 2019
4. Source: U.S. Bureau of Labor Statistics- “More education: Lower unemployment, higher earnings” as of December 2019
5. Source: Trends in Student Aid,© 2019 The College Board, www.collegeboard.org, U.S. Department of Education 2019
6. Originations represent loans that were funded or acquired during the period presented.
7. Represents the higher credit score of the cosigner or the borrower.
8. For important information regarding historical performance data and an explanation of the data and calculations underlying th is chart, see pages 30-32.
9. For 2010-2014 P&I Repayment Vintages Only- Data static as of December 31, 2018 for Legacy SLM, Navient and Sallie Mae Bank serviced portfolios combined. Certain data used in the charts above was provided by Navient
under a data sharing agreement which expired on April 29, 2019 (see page 31 for more details). Sallie Mae Bank has not independently verified, and is not able to verify, the accuracy or completeness of the data provided under
the agreement.
10. For 2015-2019 P&I Repayment Vintages Only- Data as of December 31, 2019 for Sallie Mae Bank serviced loans only – All loans covered are serviced by Sallie Mae Bank, regardless of whether the loans were originated by
Sallie Mae Bank when it was part of legacy SLM, or by Sallie Mae Bank post Spin-Off, and regardless of whether the loans were included in an ABS trust. Note: Legacy SLM and Navient portfolio serviced pursuant to a 212 day
charge-off policy. Sallie Mae Bank portfolio serviced pursuant to a 120 day charge-off policy. Historical trends may not be indicative of future performance.
11. We calculate and report our non-GAAP operating efficiency ratio as the ratio of (a) the total non-interest expense numerator to (b) the net revenue denominator (which consists of the sum of net interest income, before provision
for credit losses, and non-interest income, excluding any gains and losses on sales of loans and securities, net and the net impact of derivative accounting as defined in the "‘Core Earnings’ to GAAP Reconciliation" table on
page 29). We believe doing so provides useful information to investors because it is a measure used by our management team to monitor our effectiveness in managing operating expenses. Other companies may use similarly
titled non-GAAP financial measures that are calculated differently from the way we calculate our ratio. Accordingly, our non-GAAP operating efficiency ratio may not be comparable to similar measures used by other companies.
12. Smart Option loans considered in ‘P&I Repayment’ only if borrowers are subject to full principal and interest payments on the loan.
13. Represents the higher credit score of the cosigner or the borrower. Note: Pool characteristics as of the Statistical Cutoff Date for the respective transaction
14. Overcollateralization for Class A & B bonds
15. Estimated based on a variety of assumptions concerning loan repayment behavior. Actual prepayment rate may vary significantl y from estimates.
16. Private education loans are typically non-dischargeable in bankruptcy, unless a borrower can prove that repayment of the loan imposes an "undue hardship“.
17. Source: U.S. Department of Education, Office of Federal Student Aid, https://studentaid.ed.gov/sa/types/loans
18. The difference between “Core Earnings” and GAAP net income is driven by mark-to-fair value unrealized gains and losses on derivative contracts recognized in GAAP, but not in “Core Earnings” results. See page 29 for a
reconciliation of GAAP and “Core Earnings”. Derivative Accounting: “Core Earnings” exclude periodic unrealized gains and losses caused by the mark-to-fair value valuations on derivatives that do not qualify for hedge
accounting treatment under GAAP, but include current period accruals on the derivative instruments. For periods prior to July 1, 2018, “Core Earnings” also exclude the periodic unrealized gains and losses that are a result of
ineffectiveness recognized related to effective hedges under GAAP, net of tax. Under GAAP, for our derivatives held to maturi ty, the cumulative net unrealized gain or loss over the life of the contract will equal $0.
19. “Core Earnings” tax rate is based on the effective tax rate at Sallie Mae Bank where the derivative instruments are held.
20. We calculate and report our non-GAAP “Core Earnings” Return on Assets (“Core Earnings ROA”) as the ratio of (a) “Core Earnings” net income numerator (annualized) to (b) the GAAP total average assets denominator.
21. We calculate and report our non-GAAP “Core Earnings” Return on Common Equity (“Core Earnings ROCE”) as the ratio of (a) “Core Earnings” net income attributable to SLM Corporation common stock numerator (annualized)
to (b) the net denominator, which consists of GAAP total average equity less total average preferred stock.
22. We calculate and report our Return on Assets (“ROA”) as the ratio of (a) GAAP net income numerator (annualized) to (b) the GAAP total average assets denominator.
23. We calculate and report our Return on Common Equity (“ROCE”) as the ratio of (a) GAAP net income attributable to SLM Corporation common stock numerator (annualized) to (b) the net denominator, which consists of GAAP
total average equity less total average preferred stock.
24. Estimated CECL impacts are current as of January 22, 2020 and will be refined and reflected in the Company’s first quarter 2020 financial results.
25. The information on this page constitutes forward-looking statements. See page 2 of this Presentation for a cautionary note regarding forward-looking statements.
26. Derivative Accounting: we provide “Core Earnings” because it is one of several measures management uses to evaluate management performance and allocate corporate resources. “Core Earnings” exclude periodic
unrealized gains and losses caused by the mark-to-fair value valuations on derivatives that do not qualify for hedge accounting treatment under GAAP, but include current period accruals on the derivative instruments. For
periods prior to July 1, 2018, “Core Earnings” also exclude the periodic unrealized gains and losses that are a result of ineffectiveness recognized related to effective hedges under GAAP, net of tax. Under GAAP, for our
derivatives held to maturity, the cumulative net unrealized gain or loss over the life of the contract will equal $0. Management believes the Company’s derivatives are effective economic hedges, and, as such, they are a critical
element of the Company’s interest rate risk management strategy. Our “Core Earnings” are not defined terms within GAAP and may not be comparable to similarly tilted measures reported by other companies.
27. See footnote 26 and “Core Earnings” to GAAP Reconciliation on page 29 for a description of non-GAAP “Core Earnings.” GAAP net income attributable to SLM Corporation common stock is the most directly comparable GAAP
measure. However, this GAAP measure is not accessible on a forward-looking basis because the Company is unable to estimate the net impact of derivative accounting and the associated net tax expense (benefit) for future
periods.
28. Source: Total post-secondary education spending is estimated by Sallie Mae determining the full-time equivalents for both graduates and undergraduates and multiplying by the estimated total per person cost of attendance for
each school type. In doing so, we utilize information from the U.S. Department of Education, National Center for Education Statistics, Projections of Education Statistics to 2027 (NCES 2019, February 2019), The Integrated
Postsecondary Education Data System (IPEDS), College Board -Trends in Student Aid 2016. © 2016 The College Board, www.collegeboard.org, College Board -Trends in Student Aid 2019. © 2019 The College Board,
www.collegeboard.org, College Board -Trends in Student Pricing 2019. © 2019 The College Board, www.collegeboard.org, National Student Clearinghouse - Term Enrollment Estimates, and Company analysis. 2019 Private
Education Loan market assumptions use The College Board-Trends in Student Aid 2016 © 2016 trends and College Board-Trends in Student Aid 2019 © 2019 data. Other sources for these data points also exist publicly and
may vary from our computed estimates. NCES, IPEDS, and College Board restate their data annually, which may cause previous reports to vary. We have also recalculated figures in our Company analysis to standardize all
costs of attendance to dollars not adjusted for inflation. This has a minimal impact on historically-stated numbers.
29. The Company’s expectation and ability to pay a quarterly cash dividend on its common stock in the future will be subject to the determination by, and discretion of, the Company’s Board of Directors, and any determination by
the Board will be based on an evaluation of the Company’s earnings, financial condition and requirements, business conditions, capital allocation determinations, and other factors, risks and uncertainties.
30. J.D. Power 2019 Certified Customer Service Program recognition is based on successful completion of an evaluation and exceeding a customer satisfaction benchmark through a survey of recent servicing interactions. For
more information, visit www.jdpower.com/ccc.
31. Based on internal Company statistics.
33You can also read