Results Presentation for the Six Months Ended 30 November 2017 - Oceania Healthcare
←
→
Page content transcription
If your browser does not render page correctly, please read the page content below

Results
Presentation
for the Six Months Ended 30 November 2017
25 January 2018
Agenda
SECTION                                                    PAGE

01   Highlights of the six months ended 30 November 2017     2
02   Business Overview and Strategy                          7
03   Update on Developments                                 13
04   Financial Results                                      19
05   Appendices                                             33

                                                                  1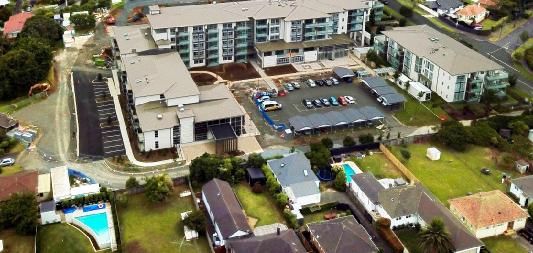
1

                 Highlights of the six months ended 30 November 2017
                                        SECTION 1

STRICTLY CONFIDENTIAL                                                  2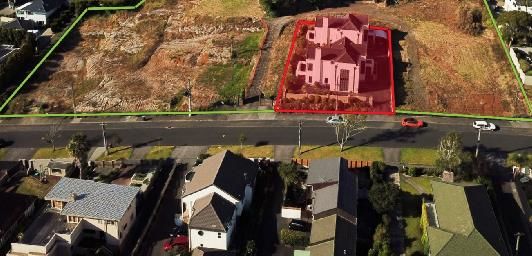
1HY2018 Highlights
We have delivered a strong interim financial result as well as continuing to execute our key developments and
operational initiatives. We expect to achieve our IPO Forecasts for the year ending 31 May 2018

 1        Reported NPAT and Pro forma Underlying1 EBITDA ahead of the previous
          corresponding period
          ● Underlying NPAT of $19.9m, increased 121% from $9.0m in the previous corresponding period (“pcp”)
          ● Reported NPAT of $42.5m, increased 93% from $22.0m in the pcp
          ● Pro Forma Underlying EBITDA of $25.3m, increased 9% from $23.3m in the pcp
          ● Operating cashflow of $17.1m, increased 34% from $12.8m in the pcp
          ● Total assets increased by $160.5m from 1HY2017 to reach approximately $1.0bn

 2        Developments on track
          ● 25 units completed at Elmwood in November 2017 (on time and on forecast cost)
          ● 30 care suites completed and MoH certified, and 62 apartments due for completion in January 2018, at
            Meadowbank (on time and forecast cost)
          ● 10 units completed at Stoke in December 2017 (on time and on forecast cost)
          ● 360 units and care suites are under construction at The Sands (formerly Maureen Plowman), Melrose,
            Meadowbank and Trevellyn
          ● New greenfield acquisition in the prime Auckland suburb of St Heliers
1. Underlying NPAT is a non-GAAP measure used by Oceania to monitor business performance and is a consideration in determining dividend
distributions. Refer to page 41 in the Appendices for a definition of Underlying NPAT. Underlying NPAT is reported in the operating segment note of
Oceania's audited consolidated financial statements. The pro forma adjustments are reconciled on page 21 of this presentation. Refer to page 42
in the Appendices for an explanation of the pro forma adjustments made.
                                                                                                                                                  3
1HY2018 Highlights (continued)
We have delivered a strong interim financial result as well as continuing to execute our key developments and
operational initiatives. We expect to achieve our IPO Forecasts for the year ending 31 May 2018

  3       Operational Excellence
          ● Supreme Winner Overall Excellence in Care Award for the third consecutive year for innovative “I Love
            Music” programme
          ● Continued our strong MoH audit results with 25% of facilities at 4 years, all others at 3 years (up from 20% at
            4 years as at May-17)
          ● Commenced the implementation of a new clinical information system
          ● Continuation of the conversion of care beds (7) and serviced apartments (39) to care suites

  4       Interim dividend declared
          ● Maiden Interim dividend per share announced of 2.10 cents per share (not imputed1), in line with IPO
            forecasts
          ● Record date of 13 February 2018. Payment date of 20 February 2018
          ● Annual target dividend payout of 50-60% of Underlying NPAT

1. The dividends are not imputed due to the availability of existing tax losses.
                                                                                                                              4
1HY2018 Financial highlights

Reported NPAT and Pro Forma Underlying EBITDA are ahead of the pcp. Total assets as at 1HY2018 approximately $1.0b

           Reported NPAT                                                           Pro forma Underlying EBITDA
           50.0                                                                    30.0
                                                                42.5                                                               25.3
                                                                                   25.0    23.6      23.4      23.3
           40.0                                                                                                          21.7
                                                                                   20.0

                                                                        NZD $M’s
                    27.1
NZD $M's

           30.0
                               21.6       22.0       22.9
                                                                                   15.0
           20.0
                                                                                   10.0
           10.0                                                                     5.0

            0.0                                                                     0.0
                   1HY2016    2HY2016    1HY2017    2HY2017   1HY2018                     1HY2016   2HY2016   1HY2017   2HY2017   1HY2018

           Total Assets                                                            Operating Cash Flow
           1.2                                                                     30.0
                                                                1.0                                                      26.1
           1.0                                       0.9                           25.0
                                          0.8                                                        20.2
                    0.7        0.8                                                         19.4
           0.8                                                                     20.0                                            17.1
                                                                        NZD $M's
NZD $B's

           0.6                                                                     15.0                        12.8

           0.4                                                                     10.0

           0.2                                                                      5.0

           0.0                                                                      0.0
                  1HY2016    2HY2016    1HY2017    2HY2017    1HY2018                     1HY2016   2HY2016   1HY2017   2HY2017   1HY2018

                                                                                                                                            5
Operational highlights

Enhancing our clinical care platform, receiving industry recognition and strong MoH certification results

l Winner of the New Zealand Aged Care Association
   overall excellence in care award (third year in a row)
l Continued our excellent MoH audit results with 25% of
   facilities at 4 years, all others at 3 years (up from 20% at
   4 years as at May-17)
l After a successful trial at our Lady Allum site in Milford,
   we are rolling out the Oceania “I Love Music”
   programme across all our sites
                                                                                       2015, 2016 & 2017
l Implementation of our new clinical information system
   has commenced
l Winner of the Senior Lifestyle Cuisine Award (third year
   in a row)
l Continuation of conversions of care beds to care suites,
   with 9 care beds converted to 7 care suites at
   Woodlands and Addington Lifestyle and 39 serviced
   apartments converted to care suites at Elmwood and
   Heretaunga
l Launched new moving and handling training
   programme across all facilities to reduce injury rates
   when transferring residents

                                                                                                            6
2

                        Business Overview and Strategy
                                     SECTION 2

STRICTLY CONFIDENTIAL                                    7
Oceania at a glance

We are a large national operator with a portfolio of 51 sites

Current and future portfolio composition4 – Remaining “needs”                                                                                   Oceania’s site locations
focused

                                                    Care           Care
                                                    Beds           Suites          Units          Total
 North Island                                      1,976            170            741           2,887
 South Island                                        593            118            295           1,006
                                                                                                                                                                              Auckland
 Total Existing1                                   2,569            288           1,036          3,893                                                                                                             Tauranga
 Development Pipeline3                                0             665           1,117          1,782
                                                                                                                                                                                    Hamilton
 Less decommissions                                 (311)             0            (78)           (389)
 Net Development Pipeline2                         (311)            665           1,039          1,393
                                                                                                                                                                                                                    Hawke’s Bay
 Total post development                            2,258            953           2,075          5,286

Current and future portfolio composition4 – Remaining “needs” focused                                                                                                                                    Wellington
                                                                                                                                                                      Nelson

                       27%
                                                                            39%
                       7%

                                                                            18%                                                                                     Christchurch
                                                                                                                                                                                                           Locations with
                       66%                                                                                                                                                                                 Development Land Bank
                                                                            43%                                                                                                                            Locations with No
                                                                                                                                                                                                           Development Land Bank

             Current Composition                            Post Development Composition

                                Care Beds          Care Suites        Units
1. Comprising 48 operating facilities and 3 undeveloped sites. Facility numbers as at 30 November 2017. 2. Current and planned developments. 3. Includes 378 Care Studios which may be initially sold with a PAC, and may subsequently be
sold under an ORA. Meadowbank stage 3 (30 care suites and 62 units) and Stoke (10 units) are included in the development pipeline. These were substantially complete as at 30 Nov 2017 4. Future composition assumes execution of current
planned development of Oceania’s Brownfield Development landbank. Refer to Appendices for movements in the portfolio from 31 May 2017.
                                                                                                                                                                                                                                            8
Summary of Oceania’s investment proposition

Our business model supports a combination of dividend yield with long term growth potential

  Aged care
                 Stable revenue from “needs-based”                            …with growth through premium
               care service and government funding….                          charging and care suite model

                                                                            …and resale margins from existing
    Village         Regular DMF earnings stream….
                                                                                   embedded value

 Development      Developments drive future DMF and                          …as well as upfront development
                       care earnings streams…                                            cashflow

                                                                                                                9
Oceania’s strategic positioning
Our focus is aged care with a growing retirement village business
Comparison to other listed operators
Existing portfolio composition Future portfolio composition
Oceania 66% 7% 27% 43% 18% 39%
Arvida 50% 0.3% 19% 30% 39% 4% 15% 42%
Ryman 35% 19% 45% 33% 19% 48%
Summerset 20% 12% 68% 17% 16% 67%
Metlifecare 7% 11% 82% 11% 8% 81%
Care Beds Care Suites Serviced Units Independent Units
Source: Results presentations of other operators
10We have a clear growth strategy in aged care
The care suite model is integral to us meeting the needs of customers
Estimated population growth1 Care Strategy
● Continuing growth and ageing of the New
800,000
Zealand population is expected to significantly
increase demand for aged care over the next 20
700,000
227,800 years
● Due to the level of returns for operators achieved
600,000 under the traditional funding model, there has
been a low level of net aged Care Bed
Population additions2
500,000
Aged 85+ 489,800
● Industry-led changes to the funding model have
been supported, primarily involving increased
400,000 private charging for aged care services
Population ● Oceania has responded by developing the care
300,000 Aged 75 to 84 suite product (applying the ORA model over
care beds) and increasing PACs
200,000
Benefits of the care suite model
100,000 Ability to recycle capital, improving returns
for the development of aged care beds
-
1995 2000 2005 2010 2015 2019 2024 2029 2034 2039 Regular DMF earnings stream increases
earnings per bed
1. Statistics New Zealand population forecasts as at March 2017. 2. Average annual growth of 0.8% from 2013 – 2016. 11Developing new care facilities
We are transforming our care offering as we execute our brownfields development pipeline. The current
projects under construction will double our number of care suites over the next two years
Trevellyn – Hamilton
10% 20% 30%
Melrose – Tauranga
construction
under
New care suites
New care suites
care beds
care beds
Decommissioned
in pipeline
Decommissioned
Near term
out pipeline
Fully built-
As at 30
Nov 17
Standard Beds Care Suites/Studios
• We currently have 288 care suites in the portfolio which represents 10% of our total care beds
• We currently have 277 care suites under construction at Melrose, Trevellyn, The Sands (formerly Maureen Plowman) and Meadowbank1.
This will almost double the amount of care suites and lift this to 20% of our total beds
• Once the existing brownfields pipeline is fully built-out we will have 953 care suites in the portfolio(30% of our total care offering)
1. This includes 81 at Melrose, 90 at Trevellyn, 44 at The Sands and 62 at Meadowbank (including the 30 that were completed after 30 November 2017).
1233
Developments
SECTION 3
STRICTLY CONFIDENTIAL 13Clear development pipeline
We will deliver our key developments during the IPO Forecast period on time and on forecast cost
Meadowbank – Completed January 2018 (30 care suites, 62 apartments)
Key changes since May-17
l 25 Villas completed at Elmwood in November 2017. 10 villas completed at Stoke in
December 2017
l 30 care suites at Meadowbank are complete with MOH certification with the 62 apartments
practically complete. CPU received and first residents moving in during February
l Stage 4 at Meadowbank commenced in October 2017 (32 care suites, 49 apartments)
l The Sands (formerly Maureen Plowman) is “out of the ground”. On track for completion in
FY2019
l Melrose development (81 care suites) commenced in July 17
l Trevellyn (90 care Suites) commenced in January 2018
l Resource consent issued for Windermere in August 2017
l Waimarie Street, in St Heliers, Auckland, land under contract (66 units and care suites
planned)
l View Road (adjoining Eden Village) under contract (30 units planned)
Elmwood – Completed October 2017 (25 villas) Stoke – Completed December 2017 (10 villas)
14Clear development pipeline
We have a pipeline of 1,782 units. Of this 1,057 units, or 59%, is either under construction or consented
Gross
Facility Location Status May 17 Nov 17 May 18 Nov 18 Future
Residences
Meadowbank
Stage 3 Auckland Substantially Complete 92
Stage 4 Auckland Under Construction 81
Stage 5 Auckland Consented 26
Stoke Nelson Complete 10
The Sands Auckland Under Construction 108
Melrose
Stage 1 Tauranga Under Construction 81
Stage 2 - 5 Tauranga Consented 216
Trevellyn
Stage 1 Hamilton Under Construction 90
Stage 2-3 Hamilton Consented 133
Green Gables Nelson Consented 88
Windermere
Stage 1 Christchurch Consented 75
Stage 2-3 Christchurch Consented 53
Wharerangi Taupo Under Construction 4
Total Consented or Under Construction 1057
Construction period
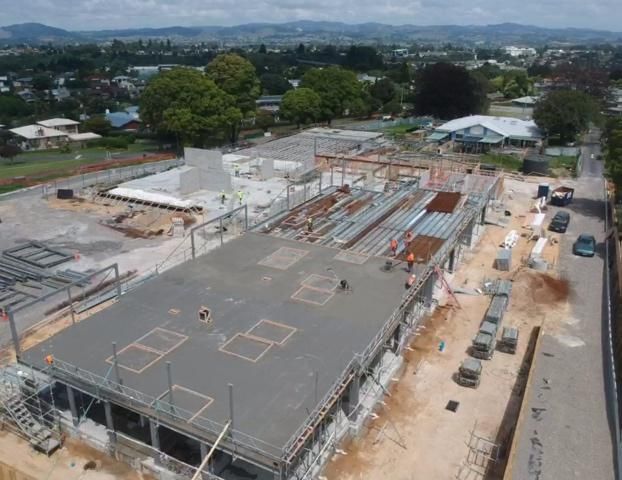
15Meadowbank Stage 3 practically complete
The care facility has been certified and 26 of the 62 apartments are under pre sale application
Stage 3 practically complete delivering
● 30 care suites and studios (completed and
certified), and
● 62 apartments (to be completed January 2018).
Certificate for public use received.
26 apartments under presales application as of the
23 of January 2018 in line with the IPO Forecast
pricing. The IPO Forecast was 28 sales for the full
year to 31 May 2018
Stage 4 under construction with a further:
● 32 care suites and studios, and
● 49 apartments
Meadowbank
Auckland
16The Sands progressing on programme
Construction of The Sands (formerly Maureen Plowman) is “out of the ground” with strong levels of presales interest
● The Sands (formerly Maureen Plowman) in Browns
Bay, Auckland will provide 64 apartments and 44
care suites
● In-ground works were completed in November
2017 with the first floor slab to be poured in
January 2018
● Due for completion around May 2019
● Strong in-bound inquiry from potential purchasers
with presales to commence in March 2018
The Sands
Browns Bay, Auckland
17Addition of premium site to our pipeline
In December 2017 we entered into a contract for the purchase of a 8,945m2 site in the premium suburb of St Heliers, Auckland
Greenfield site under contract in the Auckland
suburb of St Heliers
● 8,945m2 with extensive harbour views
● Premium boutique aged care facility and
retirement village planned
● Strong forecast demand in the catchment area
● Median house price of $1.7m in the area
● 66 units and care suites added to development
pipeline
Waimarie St
St Heliers, Auckland
18Financial Results
01 Income statement and segmental performance 4
02 Balance sheet and drivers of Investment Property valuation
03 Cashflow statement and analysis of operating cashflow
04 Capital structure
19Income statement
Reported net profit after tax of $42.5m was $20.5m (93%) above the pcp result and above the full year FY2017 result
Summary of Income Statement for the six months ended 30 November Commentary
NZDm 1HY2018 1HY20171 FY2017 l $92.1m operating revenue - includes care revenue
Operating revenue 92.1 89.2 174.8
($79.9m), village weekly fees ($2.7m) and village
deferred management fees ($7.8m), and reflects
Change in fair value of investment property 34.1 32.6 57.2 the equal pay settlement for health care assistants
that came into effect in July 2017
Total Income 126.3 121.9 232.0
l Fair value movement in IP and PPE driven by:
Operating expenses (77.5) (73.0) (146.9)
l Revaluation of existing village assets ($7.3m);
Impairment of goodwill and loss on disposal of chattels 0.0 0.0 (1.0)
l Uplift from new Meadowbank apartments
Impairment of property, plant and equipment 1.1 (3.2) (4.3) ($11.7m)
l Uplift from new Elmwood villas ($9.8m)
Total Expenses (76.3) (76.2) (152.2)
l Uplift from sales of Lady Allum apartments
Operating Profit 49.9 45.7 79.8
($5.2m)
Transaction expenses 0.0 (0.9) (4.4) l Existing care assets and development land not
Finance costs (1.4) (10.1) (20.1)
revalued for these interim accounts
l 1HY2018 operating expenses reflect the equal pay
Depreciation and amortisation (4.1) (3.8) (7.9)
settlement for health care assistants
Profit before Income tax 44.4 30.9 47.4
Taxation benefit/(expense) (1.9) (9.0) (2.5)
Reported Net Profit after Tax 42.5 22.0 44.9
1. Note, as disclosed in the FY2017 annual financial statements the 1HY2017 income statement has been restated for an adjustment to the deferred tax expense of $4.3m. All other income statement items
before tax are unchanged. There is no impact on cashflow or non-GAAP Underlying Profit.
20Underlying earnings
Underlying NPAT was $10.9m ahead of the pcp due to increased development margins and the post IPO capital structure
Reconciliation of Underlying Adjustments
NZDm 1HY2018 1HY2017 FY2017 By segment 1HY2018 1HY2017 FY2017
Reported Net profit after tax 42.5 22.0 44.9 Aged Care 16.4 18.4 31.9
less: Change in fair value of investment property and PP&E (35.3) (29.5) (52.8) Retirement Village 16.3 12.1 26.8
add: Impairment of goodwill 0.0 0.2 0.5 Other/Corporate (7.4) (7.2) (13.7)
Pro forma Underlying
add: Loss on disposal of chattels at decommissioned sites 0.0 0.0 0.5 25.3 23.3 45.0
EBITDA
add: Realised gains on resales 6.7 6.4 12.7
add: Realised development margin 4.1 0.9 5.2 Commentary
Add: Deferred tax 1.9 9.0 2.5 l Pro forma underlying EBITDA was $2.0m above
Underlying NPAT 19.9 9.0 13.4 the pcp
Pro forma adjustments: l Reduction in care segment driven by lower
Non-recurring or infrequent items occupancy and decommissioning of
development sites. Earnings per occupied bed
Transaction and Offer costs 0.0 0.9 4.4
in line with the pcp
Structural changes
l Resales margin above 1HY2017 with average
Listed company costs 0.0 (0.4) (0.7) resale gain up to $96.6k per unit/suite, 25.0%
Listed capital structure 0.0 8.5 17.0 above the pcp average of $77.5k
Pro forma Underlying NPAT 19.9 18.0 34.0 l Development margin of $4.1m underpinned
add: Depreciation and amortisation 4.1 3.8 7.9 by sales of new Lady Allum apartments and
Elmwood villas
add: Pro forma finance costs 1.4 1.5 3.0
Pro forma Underlying EBITDA 25.3 23.3 45.0
1. See Appendices for a summary of pro forma adjustments.
21Care segment
EBITDA per occupied bed, excluding decommissioned and development sites, is broadly in line with pcp.
Premium charges (care suite DMF and PAC revenue) increased 26% from the pcp
Commentary
NZ$m 1HY2018 1HY2017 FY2017
l Occupancy was ahead of the national
Daily care fees 75.9 74.3 145.7 average of 86.9%1
PAC revenue 1.6 1.3 2.7 l Care suite DMF revenue increased 28.5% from
the pcp
Care suite DMF 1.8 1.4 3.0
l Premium charging (PAC and DMF) ahead of
Other revenue 0.7 1.1 1.4 the pcp. Average PAC of $13.49 vs $10.88 in
the pcp
Total aged care operating revenue 79.9 78.1 152.8
l A number of sites have been decommissioned
Staff and resident expenses (55.6) (52.5) (105.8)
or had major developments commence on
Occupancy and site overhead expenses (7.9) (7.2) (15.1) site2
Total aged care expenses (63.5) (59.7) (120.9) l The year on year impact on earnings at these
sites is $0.8m
Aged care pro forma Underlying EBITDA 16.4 18.4 31.9
l Occupancy excluding the decommissioned
EBITDA per Care Bed / Suite (excl. decommissioned and
development sites)
$13,814 $14,390 $12,797 and development sites is 89.0%
Occupancy rates versus national average Premium care revenue
CAGR of 26.0% over last 3 years
96.0% 4.0
92.0%
90.9% 91.2%
92.0% 90.8%
NZD $M's 3.0
87.9%
88.6% 1.8
88.0% 86.9% 86.7% 86.9% 2.0 1.7 1.4
85.2%
0.6
84.0% 1.0
1.3 1.3 1.6
1.1
80.0% 0.0
1HY2014 1HY2015 1HY2016 1HY2017 1HY2018 1HY2015 1HY2016 1HY2017 1HY2018
National Occupancy Oceania Occupancy PAC Revenue Care Suite DMF
1. Source – New Zealand Aged Care Association surveys
2. Maureen Plowman and Green Gables were decommissioned for redevelopment. Melrose and Trevellyn both have new care facilities under construction.
22Village segment
Pro Forma Underlying EBITDA was $3.8m ahead of the pcp
Resales Volume and Margin
NZ$m 1HY2018 1HY2017 FY2017
28.4%
Villa and Apartment DMF 7.8 6.6 13.3 100 30%
24.7% 25.4%
Retirement village service fees 2.7 2.7 5.3
22.1% 25%
80
Other revenue 1.1 1.2 2.1
18.3% 20%
Total retirement village operating revenue 11.5 10.5 20.6 15.9%
60
15%
40 10.3%
Realised gains on resales 6.7 6.4 12.7
10%
Realised development margin 4.1 0.9 5.2
20
5%
Village site operating expenses (5.4) (5.0) (9.5) 75 65 48 71 90 83 69
0 0%
Resident share of capital gains (0.5) (0.7) (2.2) 1HY2012 1HY2013 1HY2014 1HY2015 1HY2016 1HY2017 1HY2018
Total retirement village expenses (6.0) (5.7) (11.7)
Development Sales Volume and Margin
Retirement village pro forma Underlying EBITDA 16.3 12.1 26.8 60 36.4% 40%
Commentary 35%
50
30%
l Deferred Management Fees continue to grow (18.2% c.f the pcp) as new 40
25%
developments are completed and resales occur at higher prices 18.4%
30 15.1% 20%
l Gains on resale were above the pcp despite lower volumes as margins
12.6%
improved from 25.4% in the pcp to 28.4% in 1HY2018. This was driven by an 11.8% 9.9% 10.3% 15%
20
increase in resale prices 7.5%
10%
l Lower resales volumes in 1HY2018 due to low stock levels as at 31 May 2017 10
5%
l Development margin reflects the sales of the new Lady Allum apartments in 18 21 30 54 41 25 23
0 0%
Milford, Auckland with prices in line with IPO Forecasts
1HY2012 1HY2013 1HY2014 1HY2015 1HY2016 1HY2017 1HY2018
23Village segment – key indicators
Resale prices and margins were above the pcp
Resales Prices Resales Prices vs CBRE Valuation Assumption
500 18.0% 16.5%
16.0%
400 435 14.0% 12.0%
372 386 376 12.0%
NZD $000’s
300 9.5%
313 314 326 318 331 10.0%
299
7.3%
246 252 250 263 250 8.0% 5.9%
200
188
6.0%
163 173 158
156 4.0%
100 132
2.0%
0 0.0%
1HY2012 1HY2013 1HY2014 1HY2015 1HY2016 1HY2017 1HY2018 1HY2016 2HY2016 1HY2017 2HY2017 1HY2018
Villa Apartment Care Suite
Closing Stock (incl stock under application) - Resales
l Average resale margin increased from 25.4% in the pcp
40 37 36 to 28.4%, higher than any other comparable period
35 33
31 l This was, in part, due to a material increase in the
30 average resale price for care suites (up 33% to $250k)
25 22 l Resales prices achieved in 1HY2018 were, on average,
20
20 17
5.9% higher than the May 2017 CBRE valuation. The
15 chart depicts the variance to the prior annual valuation.
15
9 l After 12 months of relatively low stock levels, vacancies
10 arising in October and November increased stock by
5 29% compared to 30 November 2016. This will underpin
resales volumes through the second half of FY2018
0
Nov-16 May-17 Nov-17 l Of the 93 units available for resale at 30 Nov 17, 36
Villas Apartments Care Suites were under application
24Embedded value
The embedded value in Oceania’s portfolio has increased significantly over the last four years to $188.5m and will
underpin ongoing DMF cash flows and resale gains
Embedded value per unit1 Commentary
160 145.5 l Embedded value in Oceania’s portfolio is $188.5m
141.3
140 l This is an indicator of DMF and resale gains to be realised
115.5 in future periods and underpins our operating cash flow
120
forecasts
100 86.4 89.3
80.5
66.8 l Embedded value per unit in 1HY2018 of c. $145,500
80 68.1
includes:
60 38.0
31.0 ̶ ~$56,200 of DMF cash flows per unit to be realised; and
40
48.8 54.9 56.2 ̶ ~$89,300 of resale gains per unit and suite
20 37.2 42.6
-
FY2014 FY2015 FY2016 FY2017 1HY2018
DMF Resale gains
Summary of Embedded Value Calculation
NZ$m FY2014 FY2015 FY2016 FY2017 1HY2018
322.4 350.2 402.7 499.0 595.8
Estimated sale/resale price of all Units1
less: Unsold stock2 (32.4) (25.3) (14.3) (33.8) (125.1)
less: Resident liabilities (contractual) (206.2) (223.3) (243.4) (282.1) (282.2)
equals: Embedded value 83.8 101.6 145.0 183.1 188.5
Embedded value per Unit (NZ$) 68,119 80,531 115,545 141,298 145,461
1. Calculated as the current/estimated sale or resale price of all units/care suites as determined by CBRE. Note, the valuation of care suites held as PPE have been estimated using the May-17 valuation as
only Investment Properties was valued by CBRE in Nov-17. 2. The value of unsold stock represents the sales prices of units/care suites which are not under contract, as they either newly constructed or have
been bought-back from the previous outgoing residents.
25Developments – key indicators
Development margin of 36.4% was significantly above the pcp, with strong sales prices achieved at key developments.
We are bringing to market a high quality product that will generate considerable uplift in DMF in future periods
Development Volumes and Margins Gross Units Delivered
60 40% FY2014 FY2015 FY2016 FY2017 1HY2018
36.4%
35% Villas 42 24 11 2 25
50
13 30% Apartments 40 14 0 44 0
40 Total 82 38 11 46 25
25%
14 15
30 18.4% 20%
15.1%
7 15%
12.6%
20 3 14 10 7
6 9.9%
8 17
10.3%
10% l Development margins have increased from 15.1% in the
1 27 7
10 7.5% 15 5% pcp to 36.4% in 1HY2018 with prices in line with IPO
11 10 12 9
0
6
0%
Forecasts
1HY2012 1HY2013 1HY2014 1HY2015 1HY2016 1HY2017 1HY2018 l Average sales prices have increased from $233.0k (per
Villa Apartment Care Suite Development Margin unit/care suite) in the pcp to $487.7k in 1HY2018
l 25 units (excluding decommissions) delivered in 1HY2018
at Elmwood
Sales Prices
l 62 units and 30 care suites delivered at Meadowbank in
1,000
January. 10 villas completed at Stoke in December
943
800
l A further 113 units and 247 care suites currently under
NZD $000’s
construction
600 683
400 469 477
440
341 368
288 291 311 286
200
200 196 188 211 186
98 85 140 154
0
1HY2012 1HY2013 1HY2014 1HY2015 1HY2016 1HY2017 1HY2018
Villa Apartment Care Suite
26Balance sheet
Total assets increased by $160.5m from 1HY2017 due to significant development capital expenditure during the 12 months
to November 2017 and revaluations reflecting improved trading performance and the completion of key developments
NZ$m 1HY2018 1HY2017 FY2017 ● Our net adjusted value per share (CBRE plus WIP less
debt) was $1.01 per share as at 30 Nov 2017
Assets
● This represents the value of existing sites and the WIP at
Cash and trade receivables 21.4 13.8 22.2
development sites but excludes the present value of net
Property, plant and equipment 279.2 244.5 268.0 development cashflows and earnings at both current
Investment properties 681.3 562.9 611.0 and future developments (including The Sands and
Intangible assets 17.3 17.3 17.1
Meadowbank Stage 4 which are under construction)
Total assets 999.1 838.6 918.2
NZ$m 1HY2018 FY2017
Liabilities PP&E (inc WIP) 279.2 268.0
Trade, other payables and provisions 28.1 23.6 27.8
IP (incl WIP) 681.3 611.0
Deferred management fees 18.8 18.9 19.5
Sub Total 960.4 879.0
Refundable occupation right agreements 290.8 266.7 282.9
less ORA Gross Up (309.6) (302.4)
Borrowings 123.8 275.8 95.2
Deferred tax liability 26.7 29.7 24.8 add: Adj for CBRE – Chattels 9.5 7.9
Total liabilities 488.2 614.6 450.3
add: Adj for CBRE – Care Goodwill 61.0 59.0
Equity add: Other 10.9 4.5
Contributed Equity 579.5 372.6 579.5 CBRE plus WIP 732.1 647.9
Retained Deficit (153.4) (218.9) (196.0) less: Net Debt (117.6) (84.4)
Reserves 84.8 70.3 84.4 Net Adjusted Value 614.5 563.5
Total equity 510.9 224.0 468.0
Shares on Issue 610.3 610.3
Net tangible assets 493.6 206.6 450.9 Net Adjusted Value per Share 1.01 0.92
27Balance sheet drivers
Significant uplifts in IP through development capital expenditure and revaluations
Investment Property
710,000
690,000 681,261
7,266
35,723 376
670,000
NZD $000’s
650,000
5,185
9,761
630,000 11,748
611,016 186
610,000
590,000
570,000
550,000
May-17 Site remediation Meadowbank Elmwood Lady Allum Capex Transfer from Existing village Nov-17
work PP&E reval
CBRE Valuation Assumptions - IP
Driver 1HY2018 FY2017 l A desktop portfolio valuation was completed by CBRE to
determine the fair value of Investment Property as at
PPGR – Long Term (low-high) 2.50% 3.50% 2.50% 3.50% November 20171
PPGR – Short Term (low-high) 0.00% 3.00% 0.0% 3.00% l PPE (Care Segment) and development land were held at the
May-17 valuation plus additions
Discount Rates (low-high) 14.00% 22.00% 14.00% 22.00%
l Material increase in the average incoming villa and
Average Incoming Price - Villas $378,013 $359,350 apartments price due to the inclusion of Meadowbank and
Average Incoming Price – Apartments $653,011 $570,291
Elmwood developments
1. The CBRE valuation was dated 31 October 2017. Management performed a roll forward for settlements in the month of November.
28Development capital expenditure
We have significantly increased our growth capital expenditure following the IPO
Growth Capital Expenditure (IP and PPE)
45.00
40.00
35.00
30.00
NZD $M's
25.00
20.00
15.00
10.00
5.00 Melrose
- Tauranga
1HY2015 2HY2015 1HY2016 2HY2016 1HY2017 2HY2017 1HY2018
Growth Capex
Our growth capital expenditure will create incremental development cashflows as well as increased care earnings
and deferred management fees
29Cash flow
Operating cash flows, ahead of the pcp, due to the reduced gearing of the business
Statement of cash flows Commentary
NZD $m’s 1HY2018 1HY2017 FY2017 l Government funding of care fees
Receipts from customers 78.5 81.5 159.3 (c.80% of aged care revenue, paid
Payments to suppliers and employees (76.1) (74.6) (141.1) fortnightly) underpin the generation
Receipts from new Occupational Rights Agreements 34.4 31.3 68.8 of cash flows from our aged care
Payments for outgoing Occupational Rights Agreements (18.6) (16.7) (30.9) business
Interest received 0.1 0.1 0.1
l In addition, our mature and growing
Interest paid (1.3) (8.8) (17.3)
retirement village portfolio provides
Tax paid 0.0 0.0 0.0
recurring DMF revenue and resale
Net cash inflow from operating activities 17.1 12.8 38.9
gains, which support cash
generation
Proceeds from sale of property, plant and equipment 0.2 0.0 0.0
l Our Embedded Value of $188.5m
Proceeds from sale of business 0.0 0.0 0.0
underpins the next 5-7 years of
Payments for PPE and intangible assets (14.3) (8.7) (33.5)
Payments for investment property and investment property under
retirement village cash flows
(34.6) (21.0) (47.6)
development l Note – Reported Operating
Net cash outflow from investing activities (48.8) (29.7) (81.1) Cashflow includes $3.8m of ORA
buy backs for new developments
Proceeds from borrowings 44.8 31.6 145.0
and $2.7m for deposits for land
Repayment of borrowings (17.7) (16.7) (285.4)
acquisitions.
Transaction costs 0.0 0.0 (10.7)
Proceeds from issue of shares 0.0 0.0 200.0
Dividend paid 0.0 0.0 0.0
Net cash inflow from financing activities 27.1 15.0 48.9
Net increase in cash and cash equivalents (4.6) (2.0) 6.8
Cash and cash equivalents at beginning of the period 10.9 4.1 4.1
Cash and cash equivalents at end of the period 6.2 2.1 10.9
1. See Appendices for a reconciliation of Operating Cash flow to the adjusted operating cash flow metric previously presented
30Dividend
An interim dividend of 2.1 cents per share has been declared
l A maiden dividend of 2.1 cents per share (not imputed) has been declared
l This is in line with the IPO forecast
l Record date of 13 February 2018. Payment date of 20 February 2018
l Subject to a range of factors, including market conditions and future funding requirements, our dividend policy is to
target an annual dividend of between 50-60% of Underlying NPAT
l The IPO forecast dividend declared of $28.3m for FY2018 is based on approximately 55% of FY2018F Underlying NPAT
and represents a gross yield of 4.61% based on a 30 day VWAP to 16 January of $1.0 per share
31Capital structure
Gearing of 18.7% as at 30 November 2017 and headroom under our debt facilities provides the flexibility to accelerate our
existing brownfield development pipeline and/or undertake further brownfield and greenfield acquisitions
Net Debt Credit metrics
Drawn Amount
Debt Facilities Facility limit Period ending 1HY2018 FY2017
(30/11/17)
General / corporate $60m $20.0m Net debt $118.1m $84.4m
Cash n/a ($6.2m) Net debt / (net debt + equity) 18.70%1 15.30%
Finance leases n/a $5.8m Loan to value ratio 16.76% 15.79%
Development facility $175m $98.6m
Total net debt $235m $118.1m
1. Note- including the settlement of Waimarie Street and land at Eden this becomes 22.0% (using the November 2017 equity figure)
32Appendices
01 Portfolio Summary
02 Development Pipeline
03 Reconciliation of Portfolio Movements
04 Summary of Unit Sales
05 Capital Expenditure
06 Adjusted Operating Cash Flow
07 Resales Cash Flow Reconciliation
08 Definition of Underlying NPAT
09 Pro Forma Adjustments
10 Glossary
11 Disclaimer
33Portfolio summary (30 Nov 2017)
Facility Region Category Care Beds Care Suites Village Units
Totara Park Village Rodney Village - - 30
Greenvalley Rest Home North Shore Care Beds 50 - -
Lady Allum Lifestyle Care & Village North Shore Care Beds, Care Suites, Village 128 15 129
Te Mana Rest Home North Shore Care Beds 46 - -
Amberwood Rest Home Waitakere Care Beds 67 - -
Eden Lifestyle Care & Village Auckland Care Suites, Village - 67 40
Everil Orr Specialist Senior Care Centre Auckland Care Beds 67 - -
Meadowbank Lifestyle Care & Village Auckland Village - - 56
Wesley Specialist Senior Care Centre Auckland Care Beds 71 - -
Elmwood Lifestyle Care and Village Manukau Care Beds, Care Suites, Village 111 48 129
St Johns Village Manukau Village - - 18
Takanini Specialist Senior Care Centre Manukau Care Beds 91 - -
Franklin Rest Home Franklin Care Beds 44 - -
Trevellyn Lifestyle Care & Village Hamilton Care Beds, Village 106 - 43
Raeburn Rest Home Cambridge Care Beds 54 - -
North Island
Whitianga Rest Home Whitianga Care Beds 53 - -
Elmswood Rest Home Tauranga Care Beds 38 - -
Melrose Lifestyle Care & Village Tauranga Care Beds, Village 80 - 60
Ohinemuri Rest Home Paeroa Care Beds, Village 68 - 6
Victoria Place Tokoroa Care Beds 51 - -
St Johns Wood Rest Home & Village Taupo Care Beds, Care Suites, Village 40 6 33
Wharerangi Rest Home Taupo Care Beds, Village 47 - 17
Dunblane Rest Home & Village Gisborne Care Beds, Village 75 - 13
Duart Rest Home Hastings Care Beds 66 - -
Eversley Lifestyle Care & Village Hastings Care Beds, Village 50 - 6
Gracelands Lifestyle Care & Village Hastings Care Beds, Village 92 - 69
Atawhai Lifestyle Care & Village Napier Care Beds, Care Suites, Village 68 14 46
Woburn Resthome Hawke's Bay Care Beds 33 - -
Chiswick Park Rest Home Palmerston North Care Beds 50 - -
Palmerston Manor Resthome Palmerston North Care Beds 48 - -
Eldon Specialist Senior Care Centre Paraparaumu Care Beds 128 - -
Elderslea Specialist Senior Care Centre Upper Hutt Care Beds 124 - -
Heretaunga Resthome & Village Upper Hutt Care Beds, Care Suites, Village 30 20 -
Hutt Gables Retirement Village Upper Hutt Village - - 46
Marina Cove Village Picton Village - - 22
Green Gables Resthome & Village Nelson Village - - 12
Otumarama Resthome Nelson Care Beds 43 - -
Stoke Retirement Village Nelson Village - - 104
Whareama Specialist Senior Care Centre Nelson Care Beds 77 - -
South Island
Redwood Lifestyle Care & Village Blenheim Care Beds, Care Suites, Village 65 13 46
Woodlands Resthome & Village Tasman Care Beds, Village 56 5 30
Holmwood Rest Home Christchurch Care Beds 56 - -
Middlepark Rest Home & Village Christchurch Care Beds, Care Suites 49 12 -
Palm Grove Lifestyle Care & Village Christchurch Care Beds, Care Suites, Village 42 42 32
Resthaven Rest Home Christchurch Care Beds 49 - -
The Oaks Lifestyle Care & Village Christchurch Care Beds, Care Suites, Village 69 36 32
Windermere Lifestyle Care & Village Christchurch Village - - 17
Addington Lifestyle Care Christchurch Care Beds, Care Suites 87 10 -
Total 2,569 288 1,036Development pipeline
Site Stage Status Gross Units Net Units Notes:
Meadowbank Stage 3 Under Construction 92 92 Construction complete in January 2018
Construction began in Oct-17. Expected
Stage 4 Under Construction 81 81
completion May 2019
Stage 5 Consented 26 26
Stage 6 Planned 40 40
The Sands (formerly Maureen Plowman) Under Construction 108 108 Expected completion May 2019
Stoke Under Construction 10 10 Construction complete in January 2018
Construction began July-17. Expected
Melrose Stage 1 Under Construction 81 81
completion 2Q2018
Stage 2-5 Consented 216 107
Trevellyn Stage 1 Under Construction 90 87 Construction began January 18
Stage 2-3 Consented 133 27
Green Gables Consented 88 88
Windermere Stage 1 Consented 75 75
Stage 2-3 Consented 53 36
Wharerangi Consented 4 (2)
Eden Planned 30 30
Waimarie Street Planned 66 66
Other Hawkes Bay Planned 165 159
Christchurch Planned 224 175
Nelson Planned 115 22
Various Planned 85 85
Total Consented/under construction 1,057 816
Total Pipeline 1,782 1,393
35Reconciliation of portfolio movements
Movements in capacity and pipeline since May-17
Changes in Conversion of Conversion of Changes in Changes in
New units
May-17 existing beds to care units to care pipeline – gross pipeline - Nov-17
delivered
capacity suites suites units added decommissions
Existing
Care beds 2,580 (2) (9) 2,569
Care Suites 242 7 39 288
Units 1,054 (4) (39) 25 1,036
Pipeline
Care beds (354) 43 (311)
Care Suites 635 30 665
Units 1,001 (25) 69 (6) 1,039
Total 5,158 (6) (2) 0 0 99 37 5,286
Movements in gross pipeline since May-17 (from above)
36Summary of unit sales
New Sales
1HY2012 1HY2013 1HY2014 1HY2015 1HY2016 1HY2017 1HY2018
Care Suite 6 3 7 13 15 10 7
Apartment 1 8 17 14 14 0 7
Villa 11 10 6 27 12 15 9
Total 18 21 30 54 41 25 23
Development Margin 9.9% 7.5% 12.6% 10.3% 18.4% 15.1% 36.4%
Resales
1HY2012 1HY2013 1HY2014 1HY2015 1HY2016 1HY2017 1HY2018
Care Suite 10 13 4 28 26 32 25
Apartment 23 17 14 16 28 20 12
Villa 42 35 30 27 36 31 32
Total 75 65 48 71 90 83 69
Resales Margin 10.27% 15.90% 18.26% 22.11% 24.69% 25.44% 28.36%
Average resale gain per unit/care suite
1HY2012 1HY2013 1HY2014 1HY2015 1HY2016 1HY2017 1HY2018
Care Suite 11,850 13,731 17,500 20,563 22,712 29,818 56,480
Apartment 25,522 19,105 32,929 75,994 69,050 99,345 96,542
Villa 25,899 59,111 61,363 78,352 100,190 112,506 127,926
Total 23,910 39,572 49,415 55,030 68,119 77,455 96,582
37Capital expenditure
We increased our development capital expenditure significantly during 1HY2018
NZ$m 1HY2018 1HY2017 FY2017 l During 1HY2018 we completed the conversion of 7 care beds
and 39 service apartments to care suites as well as continued
Acquisitions 0.0 3.0 23.0
the remediation of Heretaunga. This is due to complete in
Development capital expenditure 41.5 22.8 48.8 2HY2018
l Cost of remediating the balance of sites identified in our IPO
Remediation expenditure 2.0 0.3 1.8 due diligence revised downwards by $2.7m following more
detailed investigation of building issues. These exercise should
be complete by FY2018
Care refurbishment 0.0 0.6 1.1
Care conversion and premium room upgrades 0.9 0.4 0.7
Maintenance capital expenditure – aged care 1.4 1.1 2.7
Maintenance capital expenditure – retirement
2.0 1.2 2.2
village
Maintenance capital expenditure – IT and other 0.5 0.3 0.7
Total conversions and maintenance 4.8 3.6 7.4
Adjustment for accruals 0.6 (0.0) 0.0
Total Capex per statutory cashflow statement 48.9 29.7 81.1
Assets under finance leases 0.3 1.4 3.0
Total capital expenditure (including assets under
49.2 31.1 84.1
finance leases)
38Adjusted operating cash flow
We generated $13.3m of adjusted operating cash flow (excludes new sales proceeds, includes net
development cashflow) in 1HY2018
Adjusted operating cash flow
l Our steady operating cashflows fund our dividend
20.0
17.1 payments
15.0 12.8 13.3 l These cashflows are supported by the government
funding of 80% of our care revenues
NZD $M's
10.0
6.8 l As our development pipeline is predominantly
5.0 brownfields we generate incremental net
development cashflows (including recovering the
0.0 costs of community amenities etc). In 1HY2018 our
1HY2017 1HY2018
net development cashflow was $4.8m compared to
Operating cash flow Adjusted cash flow our development margin of $4.1m in our underlying
profit.
l Forecast dividend payment of $28.3m for FY2018
NZD $m’s 1HY2018 1HY2017 FY2017
represents a gross yield of 4.61% based on a 30 day
Operating Cash Flow 17.1 12.8 38.9 VWAP to 16 January of $1.0 per share
less: New Sales Proceeds (11.2) (5.8) (22.8)
add: Development Buybacks 3.8 1.0 3.2
add: Land Acquisition Deposits1 2.7 0.0 0.0
add: Net Development Cashflow2 4.8 1.4 6.7
Sub Total: 17.2 9.4 26.0
less: maintenance capex (3.9) (2.5) (5.6)
Adjusted Operating Cash Flow 13.3 6.8 20.4
1.The deposits paid for the land acquisitions at View Rd and Waimarie St are included in payments to suppliers and employees in the cashflow statement in the interim financial statements
2. Net development cashflow is the difference between the sales prices and all construction costs and finance costs (including communal areas). It excludes brownfields land. It captures the incremental
cashflow generated from a development on a per unit basis once sold
39Reconciliation of resales cash flow
Reconciliation of resales cash flow
NZD $m’s 1HY2018 1HY2017 FY2017
Receipts from New ORAs 34.4 31.3 68.8
less: Payments for Outgoing ORAs (18.6) (16.7) (30.9)
less: Cash Inflow From New Sales (11.2) (5.8) (22.8)
Net Resales Cash flow 4.6 8.8 15.1
Made up of :
Resale Gains 6.7 6.4 12.7
DMF Realised on Resales 2.9 4.1 6.8
less: Net Buybacks1 (3.8) (1.0) (3.2)
less: Resident Share of Capital Gains (0.8) (0.6) (1.1)
less: Other Cash amounts paid/received from resales (0.3) (0.1) (0.1)
Net Cash flows from Resales 4.6 8.8 15.1
1. The net buybacks comprised $2.8m at development sites and $1.0m at Heretaunga to facilitate the remediation work.
40Underlying NPAT
Underlying Profit (or Underlying NPAT) Development Margin
Underlying Profit is a non-GAAP measure used by the Group to monitor financial performance The Directors’ estimate of realised development margin is calculated as the cash received on
and is consideration in determining dividend distributions. It is reported in the operating segment settlement of the first sale of new ORA Units and care suites less the development costs
note of the audited consolidated financial statements. Underlying measures require a associated with developing the ORA Units and care suites. The development costs include:
methodology and a number of estimations to be approved by Directors in their preparation. Both
the methodology and the estimations may differ among companies in the retirement village • Construction costs directly attributable to the relevant project, including any required
sector that report underlying financial measures. Underlying profit is a measure of financial infrastructure (e.g. roading) and amenities related to the units (e.g. landscaping) as well as
performance and does not represent business cash flow generated during the period. any demolition and site preparation costs associated with the project. The costs are
apportioned between the ORA units and care suites, in aggregate, using estimates provided
Oceania calculates Underlying Profit by making the following adjustments to Reported Net Profit by the project quantity surveyor. The construction costs for the individual ORA units or care
after Tax: suites sold are determined on a pro-rated basis using gross floor areas of the ORA units and
care suites;
• Removing the change in fair value of investment properties and the impairment of property,
• An apportionment of land valued based on the gross floor area of the ORA units and care
plant and equipment (from the Statement of Comprehensive Income);
suites developed. The value for Brownfield development land is the estimated fair value of
• Removing any impairment of goodwill; land at the time a change of use occurred (from operating as a care facility or retirement
• Removing any loss on disposal of chattels from the decommissioning of development sites; village to a development site), as assessed by an external independent valuer. Greenfield
• Adding back the Directors’ estimate of realised gains on occupation right agreement units development land is valued at historical cost; and
and care suites; • Capitalised interest costs to the date of project completion apportioned using the gross floor
• Adding back the Directors’ estimate of realised development margin on the cash settlement area of ORA units and care suites developed.
of the first sale of new ORA units or care suites following the development, or conversion of an
existing care bed to a care site or conversion of a rental unit to an ORA Unit; and
Development costs do not include:
• Adding back the deferred taxation component of taxation expense so that only current tax
expense is reflected. • Construction, land (apportioned on a gross floor area basis) and interest costs associated with
common areas and amenities or any operational or administrative areas.
The Directors’ estimate of development margin for conversions of care beds to care suites and
Resale Gain
rental units to ORAs is calculated based on the difference between the ORA licence payment
The Directors’ estimate of realised gains on resales of ORA is calculated as the net cash flow received on the settlement of sales of newly converted ORA units and care suites and the
received by the Group on the cash settlement of the resale of pre-existing ORAs (i.e. the associated conversion costs. Conversion costs comprise:
difference between the ORA licence payment received from the incoming resident and the ORA
• In the case of conversion of care beds to care suites, the actual refurbishment costs incurred;
licence payment previously received from the outgoing resident).
and
• In the case of conversions of rental units to ORA units, the actual refurbishment costs incurred
and the fair value of the rental unit prior to conversion.
41Pro forma adjustments
Transaction and offer costs
Total transaction and offer costs of $11.9m were incurred relating to joint lead manager fees, due diligence expenses, travel expenses, advertising, printing costs, and other costs
associated with the IPO. Of these $4.4m million were expensed by Oceania in FY2017. A pro forma adjustment has been made to remove these one-off expenses to illustrate
Oceania’s financial performance in FY2017 and prior periods on a consistent basis.
Listed company costs
Oceania has incurred additional costs associated with the listed environment including Directors’ fees, additional audit and tax costs, listing fees, share registry fees, investor relations
costs, company secretarial costs, and annual general meeting costs. To ensure that the historical financial information is presented on a comparable basis, a pro forma adjustment
has been made to include estimated listed company costs representing Oceania as if it was a listed company in each of those periods.
Listed company capital structure
The proceeds of the IPO were used to substantially repay a portion of Oceania’s prior debt facilities. This means that Oceania’s reported NPAT and Underlying NPAT measures for
FY2017 do not reflect Oceania’s financial performance on a normalised, annual basis under its current capital structure because the structural reduction in debt (and interest
expense) that arose from the IPO was not in effect for all 12 months of FY2017. Accordingly, a pro forma adjustment has been made to present the interest expense and Underlying
NPAT that would have arisen had a listed capital structure been in place from the start of the financial year. This enables the financial performance for FY2017 to be more effectively
assessed and compared to FY2018 and future periods.
This pro forma adjustment includes an adjustment for the write-off of prepaid facility fees on Oceania’s historical debt facility. The prepaid facility fees relating to the historical debt
facility were required to be written off in accordance with accounting standards as the IPO occurred prior to the maturity date of the historical debt facility.
This pro forma adjustment includes an adjustment for the acquisition of the freehold land and building at the Elderslea aged care facility which has previously been recognised as a
finance lease in Oceania’s historical financial statements.
In addition, a shareholder loan of $13.4 million was advanced to Oceania from its immediate holding company in June 2016 to facilitate the construction of the Stage 3 development
at Meadowbank. The shareholder loan was settled by way of a subscription for equity in Oceania in January 2017. A pro forma adjustment has been made to remove the interest
charges incurred on the shareholder loan in FY2017.
42Glossary
l Care Suite: A room or studio certified for the provision of care by the Ministry of Health which has been licensed under an ORA
l DMF: Deferred management fees, charged under an ORA, which accrue monthly to a specified maximum and are deducted from the refund
paid to the departing resident upon resale of the unit or care suite
l IP: Investment Property
l IPO Forecasts: Prospective Financial Information contained in the Product Disclosure Statement and Supplementary Financial Information
dated 31 March 2017
l MoH: Ministry of Health
l ORA: An occupation right agreement that confers on a resident the right to occupancy a unit or care suite subject to certain terms and
conditions set out in the agreement
l PAC: Premium accommodation charge on a care bed for accommodation provided above the mandated minimum
l PPE: Property, Plant and Equipment
l Unit: Includes independent villas and apartments
l WIP: Work in progress
43Important notice and disclaimer
This presentation has been prepared solely by Oceania Healthcare Limited ("Oceania"). You must read this disclaimer before making any use of
this presentation and the accompanying material or any information contained in it ("Document").
The presentation includes non-GAAP financial measures for development sales, resales and occupancy which assist the reader with
understanding the volumes of units settled during the period and the impact that development sales and resales during the period had on
occupancy as at the end of the period.
The addition of totals and subtotal within tables and percentage movements may differ due to rounding.
The information set out in this Document is an overview and does not contain all information necessary to make an investment decision. It is
intended to constitute a summary of certain information relating to the performance of Oceania for the period ending 30 Nov 2017. Please refer to
the Financial Statements for the period ended 30 Nov 2017 that have been released along with this presentation.
The information in this presentation does not purport to be a complete description of Oceania. In making investment decisions, investors must rely
on their own examination of Oceania, including the merits and risks involved. Investors should consult their own legal, tax and/or financial advisors
in connection with any acquisition of financial products.
The information contained in this presentation has been prepared in good faith by Oceania. No representation or warranty, expressed or implied,
is made to the accuracy, adequacy or reliability of any statements, estimates or opinions or other information contained in this presentation, any
of which may change without notice. To the maximum extent permitted by law, Oceania, its directors, officers, employees and agents disclaim all
liability and responsibility (including without limitation any liability arising from fault or negligence on the part of Oceania, its directors, officers,
employees and agents) for any direct or indirect loss or damage which may be suffered by any person through the use of or reliance on anything
contained in, or omitted from, this presentation.
This presentation is not a product disclosure statement, prospectus, investment statement or disclosure document, or an offer of shares for
subscription, or sale, in any jurisdiction.
Receipt of this Document and/or attendance at this presentation constitutes acceptance of the terms set out above in this disclaimer.
44You can also read