TSX.V:CANS Investor Presentation June 2021
←
→
Page content transcription
If your browser does not render page correctly, please read the page content below

TSX.V:CANS

Investor Presentation
     June 2021

                        1
          1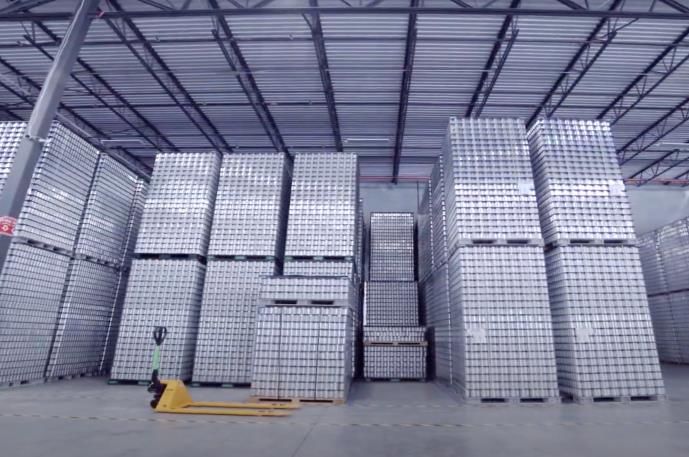
Disclaimer
Cautionary Note
The information contained in this presentation is provided by Wildpack Beverage Inc. (“Wildpack” or the “Company”) for informational purposes only and does not constitute an offer to issue or arrange to issue, or the solicitation of an offer to issue,
securities of Wildpack or other financial products. The information contained herein is not investment or financial product advice and is not intended to be used as the basis for making an investment decision. The views, opinions and advice provided in
this presentation reflect those of the individual presenters, and are provided for information purposes only. The presentation has been prepared without taking into account the investment objectives, financial situation or particular needs of any particular
person. No representation or warranty, express or implied, is made as to the fairness, accuracy, completeness or correctness of the information, opinions and conclusions contained in this presentation. To the maximum extent permitted by law, none of
Wildpack or its directors, officer, employees or agents, nor any other person accepts any liability, including, without limitation, any liability arising out of fault or negligence, for any loss arising from the use of the information contained in this presentation.
.
Forward-Looking Statements and Information
Certain information set forth in this Presentation contains forward-looking statements or forward-looking information under applicable securities legislation that involve substantial known and unknown risks and uncertainties. These forward-looking
statements or information are subject to numerous risks and uncertainties, certain of which are beyond the control of the Company. Such forward-looking statements are based on current expectations, estimates and projections about Wildpacks’
industry, management beliefs and certain assumptions made by management. Readers are cautioned that the factors and assumptions used in the preparation of such information, although considered reasonable at the time of preparation, may prove
to be imprecise or incorrect and, as such, undue reliance should not be placed on forward-looking statements or information. Forward-looking statements or information typically contain statements with words such as “anticipate”, “believe”, “expect”,
“plan”, “intend”, “estimate”, “propose”, “project”, “should”, “target”, “will”, “may”, “potential” or similar words (including negative and grammatical variations) suggesting future outcomes or statements regarding an outlook. Forward-looking statements or
information in this Presentation include, but are not limited to, statements or information with respect to: the anticipated performance of the Company’s operations; the Company’s plans to market, sell and distribute its products; the Company’s business
strategy and objectives and plans; expected demand for the Company’s products and services; and other expectations, beliefs, plans, objectives, assumptions, intentions or statements about future events or performance.
Actual results, performance or achievements could differ materially from those expressed in, or implied by, these forward-looking statements or information and, accordingly, no assurances can be given that any of the events anticipated by the forward-
looking statements or information will transpire or occur, or if any of them do, what benefits the Company will derive therefrom. In addition to other factors and assumptions which may be identified in this Presentation, assumptions have been made
regarding, among other things: the building greater than three production lines; converting pipeline customers into customers; contractual customers not defaulting on their obligations; maintaining pricing of no less than $2.00 / gallon and $0.22 /
sleeved can; can suppliers not defaulting on their contractual obligations; historical throughput per shift being matched on scale; new equipment meets factory specified throughput; projected inputs to not materially deviate from inflationary growth; final
permits are issued within the indicated timelines; the project follows the projected construction timeline; the Company can expand to adequately create capacity for demand; seasonality is consistent with history seasonality; the Company can secure
financing to build production lines; human resources can be adequately scaled to meet operational requirements; the Company’s assumptions around the proportions of fixed and variable costs are accurate; direct labour being reduced by automation;
no material increases in utility cost in excess of general inflationary rates; decorating remaining the largest operational division; the revenue targets being met for adequate scale; the proportional scale of revenue growing in excess to management cost;
selling expense proportionally decreasing due to more sales per salesperson; increased facility space utilization with new ERP; amortization of managers properly projected by the Company; more efficient use of human capital due to adequate scale of
like requirements leading to expert efficiencies; back-office costs growing at a slower rate than revenue; the Company will succeed with its expansion plans; the impact of competition from other industry participants; the general stability of the economic
and political environment in which the Company operates; the timely receipt of any required regulatory approvals for the business plans of the Company; the ability of the Company to obtain qualified staff, equipment and services in a timely and cost
efficient manner; the anticipated demand for the Company's products and services; currency, foreign exchange and interest rates; the regulatory framework regarding taxes and regulatory matters in the jurisdictions in which the Company operates; the
success that the Company will have in developing its products and services and the results from such products and services; that counterparties to material agreements will perform in a complete and timely manner; that the Company will have sufficient
capital to conduct its business plan as well as those risk factors outlined under the heading “Risk Factors” in the filing statement in respect of Wildpack which is available under the Company’s profile at www.sedar.com. . Readers are cautioned that the
foregoing list is not exhaustive of all factors and assumptions which have been used.

                                                                                                                                                                                                                                                                             2
Disclaimer
Forward-looking statements or information are based on current expectations, estimates and projections that involve substantial known and unknown risks and uncertainties which are beyond the control of the Company and which could cause actual
results to differ materially from those anticipated by the Company and described in the forward-looking statements or information. Although the Company has attempted to identify important factors that could cause actual actions, events or results to
differ materially from those described in the forward-looking statements, there may be other factors that cause actions, events or results not to be as anticipated, estimated or intended. All subsequent forward-looking statements or information, whether
written or oral, attributable to the Company or persons acting on its behalf are expressly qualified in their entirety by these cautionary statements. Furthermore, the forward-looking statements or information are made as at the date of this Presentation
and unless required by law, the Company undertakes no obligation to update publicly any forward-looking statements, whether as a result of new information, future events, or otherwise to reflect future events or circumstances or reflect the occurrence
of unanticipated events.
Future-Oriented Financial Information
To the extent any forward-looking statements in this Presentation constitute future-oriented financial information or financial outlooks within the meaning of applicable securities laws, such information is being provided to demonstrate the Company’s
internal projections and readers are cautioned that this information may not be appropriate for any other purpose and that they should not place undue reliance on such future-oriented financial information and financial outlooks. While such information
has been prepared using assumptions, including projections and forecasts, considered reasonable by management of the Company at the time of preparation, such assumptions may not materialize as forecast as a result of unanticipated events and
circumstances that may occur subsequent to the date of the forecast. Accordingly, there is a very high risk that actual results achieved will vary from the forecast results and that such variations may be material. There is no representation from the
Company that actual results achieved will be the same in whole or in part as those forecast. Future-oriented financial information and financial outlooks, as with forward-looking information generally, are, without limitation, based on the assumptions and
subject to the risks set out above and elsewhere in this Presentation.

Non-IFRS Measures

This Presentation refers to certain financial performance measures that are not defined by and do not have a standardized meaning under International Financial Reporting Standards (termed "Non-IFRS measures"). Non-IFRS measures are used by
management to assess the financial and operational performance of the Company. The Company believes that these Non-IFRS measures, in addition to conventional measures prepared in accordance with International Financial Reporting Standard,
enable investors to evaluate the Company’s operating results, underlying performance and prospects in a similar manner to the Company’s management. As there are no standardized methods of calculating these Non-IFRS measures, the Company’s
approach may differ from those used by others, and accordingly, the use of these measures may not be directly comparable. Accordingly, these Non-IFRS measures are intended to provide additional information and should not be considered in
isolation or as a substitute for measures of performance prepared in accordance with International Financial Reporting Standards. The Company defines EBITDA as earnings before interest tax depreciation and amortisation and EBITDA Margin % as
EBITDA divided by total revenue. We are presenting these measures because we believe that our current and potential investors, and many analysts, use them to assess our current and future operating results and to make investments decisions.
Management uses these measures in managing the business and making decisions. EBITDA and EBITDA Margin % are not intended as a substitute for IFRS measures.

Market and Industry Data
Market data and industry forecasts contained in this Presentation have been obtained from industry publications, various publicly available sources and subscription-based reports as well as from management’s good faith estimates, which are derived
from management’s knowledge of the industry and independent sources that management believes to be reliable. Industry publications, publicly-available sources and subscription-based reports generally state that the information contained therein has
been obtained from sources believed to be reliable. We have not independently verified any of the information from such third-party sources nor have we ascertained the validity or accuracy of the underlying economic assumptions relied upon therein.
The Company hereby disclaims any responsibility or liability whatsoever in respect of any third party sources of market and industry data or information.

Currency
Unless otherwise indicated, all dollar references herein refer to Canadian dollars (C$).
Cautionary Note To United States Investors
This presentation does not constitute an offer of shares for sale in the United States or to any person that is, or is acting for the account or benefit of, any U.S. person (as defined in Regulation S under the United States Securities Act of 1933, as
amended (the "Securities Act")), or in any other jurisdiction in which such an offer would be illegal. The Company’s shares have not been and will not be registered under the Securities Act.

                                                                                                                                                                                                                                                                  3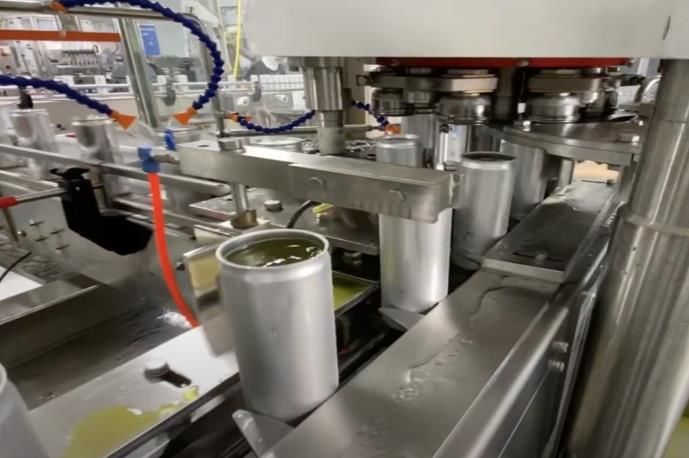
01

Company
Overview

           4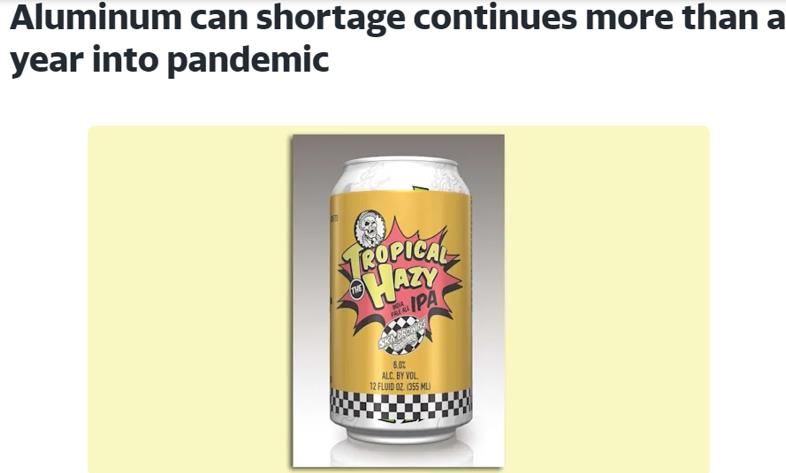
Wildpack Beverage Inc. (TSX.V:CANS)
                                                       Business Overview
Wildpack Beverage Inc. (TSX.V:CANS) (“Wildpack”) is a            Wildpack operates four facilities located in Atlanta,
co-packing company that provides filling, decorating             Baltimore, Las Vegas and Sacramento and intends to
and brokering of aluminum cans for middle-market                 expand its geographic network of manufacturing locations
beverage brands                                                  to cover the U.S. middle-market beverage segment

                                                                                      Missoula                     Twin Cities
                 Can Filling
                 ▪   Customer provides ingredients and formula                                                                          Grand Rapids
                 ▪   We blend, fill and seal                                                     Omaha
                                                                           Sacramento                                       Milwaukee
                                                                                                     Longmont
                 Can Decorating                                                                                             Baltimore
                 ▪   Customer provides artwork
                                                                                       Las Vegas
                 ▪   We apply label                                                                             Austin

                                                                                                                                        Atlanta

                 Can Brokering                                          Current facilities

                 ▪   Customer needs cans                                Cities in negotiation
                                                                                                                                             Miami
                 ▪   We sell cans

                               Sacramento and Baltimore generated ~US$12.3mm in sales in 2020
                                                                                                                                                       5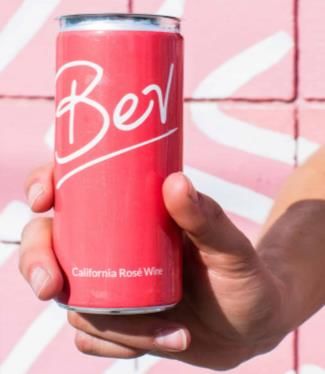
Capitalization
Recently Raised C$20mm Through Convertible Debenture Offering
                                       Capitalization Table                                                    Ownership
 Share Price(1)                                            C$                $1.20
                                                                                                                     1.8%
 Basic Shares Outstanding                                 mm                  66.8
 FDITM Shares Outstanding                                 mm                  76.7             18.1%

 FDITM Market Cap                                         C$mm               $92.0
 Add: Total Debt                                          C$mm               $24.7
 Less: Cash                                               C$mm             ($20.9)                            66.8mm Basic          50.6%
 Less: ITM Securities                                     C$mm              ($7.3)         9.2%(3)          Shares Outstanding

 Enterprise Value                                         C$mm               $88.6

                                        Dilutive Securities
 Type                                  Amount (mm)          Weighted Average Strike              20.3%(2)

 Options                                           4.3                     C$0.33
 Warrants                                          13.0                    C$1.50     Management     Other      Acquisitions   RTO + SAFE   CPC

                                              51% insider ownership with long-dated lock-ups in place
(1)Based on 10-day VWAP as of June 8, 2021
(2)6.0M (44.1%) of shares are subject to lock-up
(3)Shares are subject to lock-up

                                                                                                                                                  6
Management
    Mitch Barnard: Chief Executive Officer (CEO)
    Growth focused with vast experience leading financing and M&A
    transactions.

    Ryan Mason: Chief Financial Officer (CFO)
    Balanced experience in financial analysis and control as a public
    accountant and CFA.

    Steve Fader: Chief Execution Officer (CXO)
    Expert in consolidation business strategies and integrations.

    Thomas Walker: Chief Growth Officer (CGO)
    Breadth of experience in synergy driven M&A of manufacturing
    assets.

    Chuck Zadlo: Chief Operations Officer (COO)
    Seasoned executive in beverage manufacturing across alcohol
    and non-alcohol segments.

                                                                        7
Board of Directors
Jeffrey Mason: Independent, Chairman of the Board
25+ years in public company governance and management.
Sean Clark: Independent
Numerous start-up to public company exits.
Joe Bubel: Independent
Top tier financial analyst and M&A deal maker.
Paul Mann: Independent
25+ years public company financial experience.
Matt Dwyer: Independent
Second largest shareholder and real estate expert.
Stephen Fader: Non-Independent
Largest shareholder of Wildpack.
Mitch Barnard: Non-Independent
Management representative.
8Investment Highlights
Demand for craft canning services is exploding Demand is outpacing capacity
o The rise in popularity of canned seltzers and craft beers has led to massive growth o Consistent demand backlog allows for premium pricing and frequent price increases
o Growth is disproportionately weighted to cans creating a large, underserved middle market o Reduces risk of idle capacity upon completion of build and buy expansion
Fragmented market is primed for consolidation Relatively light CAPEX catapults growth
o Undercapitalized competitors do not benefit from a national network o Smaller equipment is cheaper and faster to get / install
o Stand alone competitors can be acquired at attractive multiples o Existing facilities can be acquired and optimized driving significant efficiencies
Market
Market leader for innovation
innovation Strong competitive advantages
oo Forefront of developing
First to develop digital
a digital ordering
ordering solutions,
solution, attracting
attracting millennial
millennial new new-age brands
age brands & creating
and creating moat
a moat o Breadth of services offered and locations is unmatched by competitors
oo Disrupting
Disruptingan
an industry
industry dominated
dominated by
by outdated
outdatedbusiness
businesspractices
practices o A national network is rewarded by marquee customers
Wildpack is positioned to dominate the middle market and emerge as the leading
consolidator in the space
9Important Milestones
Proven track record of success
Nov-21
Baltimore Filling
Sept-21 Line Upgrade
Close Acquisitions
July-21 Dec-21
4th Decorating New Customer UX
Line in Baltimore Digital Ordering
& 2nd Filling Line Oct-21 System Goes Live
May-21 in Vegas Vegas Printing
Public Listing on Operation Complete
TSXV Aug-21
March-21 1st Decorating Line
Close Go-Public in Vegas
Financing June-21
June-20
Enter into LOIs
Acquired Baltimore Cities in negotiation
for Acquisitions
and Sacramento April-21 ‣ Omaha ‣ Milwaukee
Facilities Vegas Facility Build
‣ Missoula ‣ Miami
Complete
‣ Grand Rapids ‣ Austin
‣ Twin Cities ‣ Denver
1002
Industry
Overview
& Market
Drivers
11We have contracted a lot of cans
North America is out of cans 2021 Wildpack Contracted Cans
“A nationwide shortage of cans is the Country Units Arrangement
“Californian breweries are also struggling
latest threat to craft beer. Ball Corp., the with the shortage… ”Everyone is impacted.
world’s largest manufacturer of cans… In the past three to four months, we've Sri Lanka 55M Take-or-Pay
The U.S. market alone is short 10 experienced multiple instances of delays,
billion cans.” shortages, changes in agreed-upon terms.
Washington Post, Oct-20 Europe 32M Take-or-Pay
It's a nightmare."
Newsweek, Oct-20
“Berlin Packaging, the world’s largest Pakistan 50M Take-or-Pay
hybrid packaging supplier, has been “Demand is likely to continue to outpace
forced to rethink planning strategies supply through next year or possibly Malaysia 35M Take-or-Pay
with its partners and consumers with longer.”
Gamer Packaging, Nov-20
extended supplier lead times.”
USA 28M Allocation
Fox News, Nov-20
Note: we have the ability to take up to 100% above contractual obligation
12There is a can shortage
Supply chain problems have been
unfolding throughout the pandemic, as
people radically shifted what
they bought toppling the normally
efficient order of global supply chains.
- Politico (April, 2021)
Consumer preferences
One of the biggest challenges impacting the changed, as people stayed home
U.S. alcohol [supply chain] is what’s been and did not go to bars and restaurants
coined the “CAN-DEMIC” – a - MetalMiner (April 2021)
widespread shortage of aluminum cans
- BevAlc Insights (April 2021)
13Consumer preferences have shifted towards cans
The market
The market is growing
growing
We built
We built our business
business to
to Seltzers of the Past Seltzers of the Future
dramatically and is
dramatically is under
under
capitalize
capitalize
capacity
capacity Few and Bottled Many and Canned
‣ Major shift into craft beverage consumption ‣ Flexible manufacturing lines allow us to
has increased middle market demand capture the sea of work
‣ Servicing a vast array of customers with ‣ Optimized
We builtchangeover speed and to
our business
complex needs is challenging decreased downtime maximize profitability
capitalize
‣ The middle market was out of capacity ‣ Premium pricing results in stronger margins
before this boom than our top-market competitors
‣ Alcohol in a can is driving growth ‣ One of the few providers who manufacture
canned alcohol and non-alcohol
Global Ready To Drink Market Sizing (USD) North American New Product Launch Container
100%
$63B
80%
$50B 75%
60% 67%
$38B 61%
50%
40%
$25B 38% 41%
31%
20%
$13B
$B 0%
2014 2015 2016 2017 2018 2019 2020E
2020 2021 2022 2023 2024 2025 2026 2027
Cans Other
Source: IWRS Drinks Market Analysis, November 11, 2020. Ardagh, Wall Street Research, YouGov August 2020 survey
14Cans are socially responsible
Consumers are changing… 1
Aluminum Plastic Glass
More beverages
More consumers
companies select 23% 27% 22%
select cans
cans
2% Average Recycled Consumer Recycle 47% 3% Recyclable Content
Rates
74% 26% 75%
We have more demand
2
“The rise in health concerns “Nearly 70 percent of CGS Greenhouse Gas Emissions
among the people to avoid plastic survey respondents said that 120
Kg CO2e / 1000 containers
containers as they are harmful sustainability is at least
90
and non-bio-degradable is driving “somewhat important” to them
the beverage can markets 4.9% when making a purchase and 47 60
CAGR during the forecast period percent would pay more for a
2020-2025.” - Industry Arc sustainable product.” - CGS 30
Beverage Cans Market Forecast 2019 U.S. Consumer
0
(2020-2025) Sustainability Survey
Plastic Bottle Glass Bottle Aluminum Can
1Gamer Packaging Market Report 2020; The Aluminum Can Advantage: Key Sustainability Performance Indicators 2020;
2Analysis of the Energy and Greenhouse Gas Emission Implications of Distributing and Refrigerating Beverages (2016).
15Consolidation at the top and fragmentation at the
bottom
WHY
MID-MARKET WHY THEY
REFRESCO ‣ Refresco is consolidating the high
NEEDS NEED IT
DOESN’T speed beverage manufacturers in
North America and filling the capacity
100-300 cans Lower scrap Large runs less with more A-level customers.
SPEED
per minute potential impacted
‣ Pushing B-level customers down
into lower tiers of the manufacturing
Smaller market with nobody to serve them.03
Our
Execution
Strategy
17We intend to expand our business by
executing our buy and build strategy
18Acquiring and upgrading
Post Acquisition Upgrades Increase Efficiency
Total revenues of ~US$12.3M generated in 2020 (pre and post-acquisition)
6-month period pre-acquisition revenue: US$4.1M Acquisition completed 6-month period post-acquisition revenue: US$8.2M
$2.4
US$ Millions
$2.5
in late June
$2.0 $1.8
$1.5
$1.1 $1.2
$1.0 $1.0
$1.0 $0.7 $0.8
$0.7 $0.6 $0.6
$0.4
$0.5
$0.0
Jan Feb Mar Apr May Jun Jul Aug Sep Oct Nov Dec
Equipment is Inexpensive and Quick to Install
M&As Upgrade
Typical ramp-up Efficiently
period and required capex
Filling Line Decorating Line
Equipment Type Order Lead Time Install Time Cost Equipment Type Order Lead Time Install Time Cost
Conveyance 60-days 30-days $0.30M Conveyance 60-days 30-days $0.30M
Filler and Seamer 90-days 30-days $0.30M Applicator 90-days 30-days $0.10M
Pasteurizer 90-days 30-days $0.20M Shrink Tunnel 90-days 30-days $0.05M
Packaging 90-days 30-days $0.20M Packaging 90-days 30-days $0.15M
Tenant Improvements 30-days 90-days $0.50M Tenant Improvements 30-days 90-days $0.20M
5-Months
Total $1.5M Total $0.8M
19Illustrative unit margin of facility operations
Decorating (per can) Filling (per case equivalent)(1)
Unit Price $0.28 Unit Price $3.39
Unit Cost ($0.21) Unit Cost ($2.53)
EBITDA $0.07 EBITDA $0.85
EBITDA Margin % 25.6% EBITDA Margin % 25.2%
If Wildpack can DECORATE 120mm cans in a year, it If Wildpack can FILL 4mm case equivalents in a year,
can generate ~US$8.5mm in Decorating EBITDA it can generate ~US$3.5mm in Filling EBITDA
Note: These figures do not represent forecasted financial performance, and are only illustrations of potential unit economics for operations.
(1)Case equivalent = 24 12oz cans
20Attractive acquisition opportunities in the market
Major Acquisition Arbitrage Available Consideration Breakdown
Baltimore /
Acquisition
Sacramento Public
Targets
Acquisition
10%
10%
Multiple of
NTM revenue 0.6x 0.9x 1.8x
50%
30%
Multiple of
NTM EBITDA 3.0x 6.0x 9.8x
Cash on close Shares
Debt assumption Cash earned out
21Public Comparables
Figures presented in mm of C$ Market Enterprise EV / Revenue EV / EBITDA
Company Name Cap (FDITM) Value CY 2021E CY 2022E CY 2021E CY 2022E
CCL Industries Inc. Class B $12,555 $13,959 2.5x 2.4x 11.8x 11.4x
Cascades Inc. $1,530 $3,460 0.7x 0.7x 5.5x 5.0x
Intertape Polymer Group Inc. $1,729 $2,397 1.7x 1.6x 9.8x 9.3x
Winpak Ltd. $2,657 $2,085 2.2x 2.2x 11.2x 10.2x
Waterloo Brewing Ltd. $263 $326 2.8x 2.4x 13.5x 11.0x
Good Natured Products Inc $235 $237 4.1x 2.7x nmf nmf
Big Rock Brewery Inc. $44 $52 na na na na
Average 2.3x 2.0x 10.4x 9.4x
Median 2.4x 2.3x 11.2x 10.2x
Note: As at June 21, 2021.
Source: FactSet, Public Disclosures.
22Investment Highlights
Demand for craft canning services is exploding Demand is outpacing capacity
o The rise in popularity of canned seltzers and craft beers has led to massive growth o Consistent demand backlog allows for premium pricing and frequent price increases
o Growth is disproportionately weighted to cans creating a large, underserved middle market o Reduces risk of idle capacity upon completion of build and buy expansion
Fragmented market is primed for consolidation Relatively light CAPEX catapults growth
o Undercapitalized competitors do not benefit from a national network o Smaller equipment is cheaper and faster to get / install
o Stand alone competitors can be acquired at attractive multiples o Existing facilities can be acquired and optimized driving significant efficiencies
Market
Market leader for innovation
innovation Strong competitive advantages
oo Forefront of developing
First to develop digital
a digital ordering
ordering solutions,
solution, attracting
attracting millennial
millennial new new-age brands
age brands & creating
and creating moat
a moat o Breadth of services offered and locations is unmatched by competitors
oo Disrupting
Disruptingan
an industry
industry dominated
dominated by
by outdated
outdatedbusiness
businesspractices
practices o A national network is rewarded by marquee customers
Wildpack is positioned to dominate the middle market and emerge as the leading
consolidator in the space
23You can also read