INVESTOR PRESENTATION - AWS

Page created by Ross Brewer
 
CONTINUE READING
INVESTOR PRESENTATION - AWS
INVESTOR PRESENTATION
April 2019
INVESTOR PRESENTATION - AWS
Forward-looking statements
Certain information in this presentation, including statements relating to winning shelf space, cross-selling our brands through our global distribution platform, extending our international reach, delivering on our growth plan, increasing sales and profitability in the
future, and our financial guidance for Fiscal 2019 and Fiscal 2020, constitutes forward-looking information. In some cases, but not necessarily in all cases, forward-looking information can be identified by the use of forward-looking terminology such as “plans”, “targets”,
“expects” or “does not expect”, “is expected”, “an opportunity exists”, “is positioned”, “estimates”, “intends”, “assumes”, “anticipates” or “does not anticipate” or “believes”, or variations of such words and phrases or state that certain actions, events or results “may”,
“could”, “would”, “might”, “will” or “will be taken”, “occur” or “be achieved”. In addition, any statements that refer to expectations, projections or other characterizations of future events or circumstances contain forward-looking information. Statements containing
forward-looking information are not historical facts but instead represent management’s expectations, estimates and projections regarding future events.

Forward-looking information is necessarily based on a number of opinions, assumptions and estimates that, while considered reasonable by MAV Beauty Brands as of the date of this presentation, are subject to known and unknown risks, uncertainties, assumptions and
other factors that may cause the actual results, level of activity, performance or achievements to be materially different from those expressed or implied by such forward-looking information, including but not limited to the factors described in greater detail in the “Risk
Factors” section of the Annual Information Form, which is available at www.sedar.com. These factors are not intended to represent a complete list of the factors that could affect MAV Beauty Brands; however, these factors should be considered carefully. There can be
no assurance that such estimates and assumptions will prove to be correct. The forward-looking statements contained in this presentation are made as of the date of this presentation, and MAV Beauty Brands expressly disclaims any obligation to update or alter
statements containing any forward-looking information, or the factors or assumptions underlying them, whether as a result of new information, future events or otherwise, except as required by law.

If any such risks or uncertainties materialize, or if the opinions, estimates or assumptions underlying the forward-looking information prove incorrect, actual results or future events might vary materially from those anticipated in those forward-looking information.

Although we have attempted to identify important risk factors that could cause actual results to differ materially from those contained in forward-looking information, there may be other risk factors not presently known to us or that we presently believe are not
material that could also cause actual results or future events to differ materially from those expressed in such forward-looking information. There can be no assurance that such information will prove to be accurate, as actual results and future events could differ
materially from those anticipated in such information. Accordingly, readers should not place undue reliance on forward-looking information, which speaks only as of the date made. The forward-looking information contained in this presentation represents our
expectations as of the date of this presentation (or as the date they are otherwise stated to be made), and are subject to change after such date. However, we disclaim any intention or obligation or undertaking to update or revise any forward-looking information
whether as a result of new information, future events or otherwise, except as required under applicable securities laws.

Non-IFRS Measures

This presentation makes reference to certain non-IFRS measures. These measures are not recognized measures under IFRS, do not have a standardized meaning prescribed by IFRS and are therefore unlikely to be comparable to similar measures presented by other
companies. Rather, these measures are provided as additional information to complement those IFRS measures by providing further understanding of our results of operations from management’s perspective. Accordingly, these measures should not be considered in
isolation nor as a substitute for analysis of our financial information reported under IFRS. We use non-IFRS measures including “Adjusted EBITDA”, “Adjusted Net Income” and “Adjusted Gross Profit”. These non-IFRS measures are used to provide investors with
supplemental measures of our operating performance and thus highlight trends in our core business that may not otherwise be apparent when relying solely on IFRS financial measures. We also believe that securities analysts, investors and other interested parties
frequently use non-IFRS measures in the evaluation of issuers. Our management also uses non-IFRS measures in order to facilitate operating performance comparisons from period to period, to prepare annual operating budgets and to determine components of
management compensation. Definitions and reconciliations of non-IFRS measures to the relevant reported measures can be found in the Company’s MD&A dated March 28, 2019 and in Appendix “A” to this presentation.

To assist readers in assessing year-over-year performance, we have included selected pro forma financial information in this presentation. Pro forma financial information gives effect (as if they occurred on January 1, 2017) to: (i) the acquisition of Renpure, LLC; (ii) the
entry into the Company’s new credit facility and the re-payment of the Company’s prior indebtedness; and (iii) the completion of the Company’s initial public offering and concurrent changes to the share capital.

Certain Other Matters

Unless otherwise stated herein, financial information in this presentation is presented in United States dollars.

                                                                                                                                                                                                                                                   MAV Beauty Brands                 2
INVESTOR PRESENTATION - AWS
About MAV       Growth        Financial
Beauty Brands   Strategies    Overview

01              02            03

                01           About MAV
                             Beauty Brands

                                             MAV Beauty Brands   3
INVESTOR PRESENTATION - AWS
Senior leadership

     Marc Anthony Venere            Tim Bunch               Chris Doyle
     Founder, President & CEO       Chief Revenue Officer   Chief Strategy Officer
     25+ years experience           15+ years experience    25+ years experience

              2016 Ontario Winner

              WORLD CHAMPION
           & CELEBRITYHAIRSTYLIST

                                                                                     MAV Beauty Brands   4
INVESTOR PRESENTATION - AWS
How we got here                                                                                                                   Acquired

                                                                                                                                                                           2018
                                                                                                                                                                   2017

                                                                                 Renpure is                                                                2016
                                                                                 founded by the
                                                                                 Redmond family
                                                                                                                                                                                             IPO
The original Marc
Anthony Salon opens                                      Cake Beauty is                                                       2008
in the very location                                     founded by
where his father                                         Heather Reier
practiced the craft                Marc Anthony
                                   launches nationally
                                                                                                                                             Partnered with TA
                                   across the U.S. in
                                                                                       2003                                                  Associates, highly       Substantial increase in
                                   Ulta Beauty and
                                                                                                                                             experienced growth       C-level executives and
           Marc launches           CVS                                        2002                                                           private equity firm      value-add Board members
           his first product:
                                                                                                               Marc Anthony
           “Marc Anthony
                                                                                                               products sell                                          Implemented processes to
           International”
                                                                                                               internationally,                                       support innovation, new
                                                                                                               beginning in                                           product development and
                                                 1998                                                          Europe                                                 operations

                                                                                                                                                                      Robust KPI reporting
                                                                                                                                                                      and forecasting
                            1995                                                     LATE 90’S                                                                        implemented
                                                                                     Marc begins working
                                   First SKU
                                                         National launch at          with A-list celebrities
                                   launched at
    1993                                                 Shoppers                    and appearing on
                                   Shoppers
                                                         Drug Mart                   national TV shows
                                   Drug Mart

                                                                                                                                                                          MAV Beauty Brands        5
INVESTOR PRESENTATION - AWS
3                                                                           100+
                                                                                            major retailers
                fast-growing hair and
                body care brands

     Building an iconic, multi-brand, fast-growing
     global personal care company

           $103mm 42%
           2018 pro forma revenue(1)                                                        Q4 2018 pro forma
                                                                                            revenue growth(1)

1)   Pro forma for ownership of Renpure as of January 1, 2017 and includes Cake Beauty as of January 23, 2018.
                                                                                                                 MAV Beauty Brands   6
INVESTOR PRESENTATION - AWS
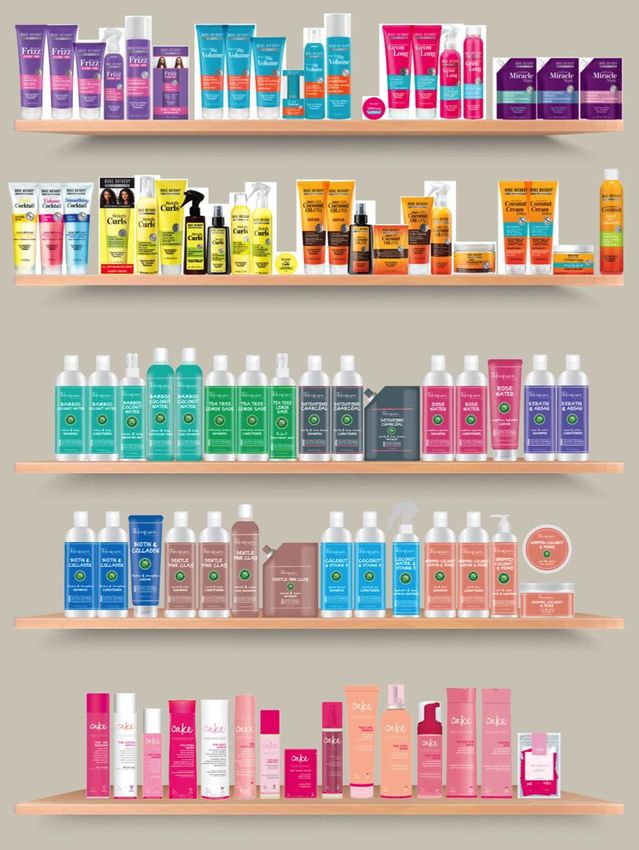
2018: a transformative year for MAV Beauty Brands
strategic priorities         2018 progress and results

Organic growth               MAV Beauty Brands: Broke into top 10 U.S. haircare companies and is the fastest growing
                             Marc Anthony: Fastest growing hair care brand in the U.S. Drug channel
                             Renpure: 20% YoY POS growth in U.S. FDM
                             Cake: Accelerated same-sku sales with new pricing strategy

Cross-selling                Cake launched in two major U.S. drug retailers and in South Africa and Mexico
                             Renpure launched in Canada’s largest drug retailer

Whitespace expansion         Expanded into 10 new international countries
                             Expanded Marc Anthony into U.S. Dollar Store and Beauty Supply

Innovation                   Marc Anthony innovation made significant impact with retailers and media
                             Introduced Renpure Plant Based Beauty collections
                             Cake innovation accelerated in Hair, Body, Skin and Cosmetics for mid-2019 and 2020

Organizational development   Filled out leadership team with VP Ops, VP Marketing, VP Data & Analytics, VP Finance, Director Finance
                             Appointed Judy Adam as new CFO and Chris Doyle as Chief Strategy Officer (April 2019)

Operations                   Initiated COGs reduction program and re-balancing of manufacturers that will result in
                             significant 2019 and 2020 gross margin improvement

                                                                                                                       MAV Beauty Brands   7
INVESTOR PRESENTATION - AWS
Pioneering the Masstige category
                                                             SALON &
                                                         SALON-DIVERTED
                                                            PRODUCTS

                                     Masstige products                    Retailers allocate
                                      provide a strong   MASSTIGE         more shelf space
                                                         PRODUCTS         to products that
                                     value proposition
                                        for consumers    $4.00 - $12.00
                                                                          generate better
                                                                          economics
“Since our beginning in 1995,
 our mission has been to deliver
 premium quality products that                            TRADITIONAL
 are accessible to and convenient                         MASS MARKET
                                                           PRODUCTS
 for consumers.”

                                                                          MAV Beauty Brands   8
INVESTOR PRESENTATION - AWS
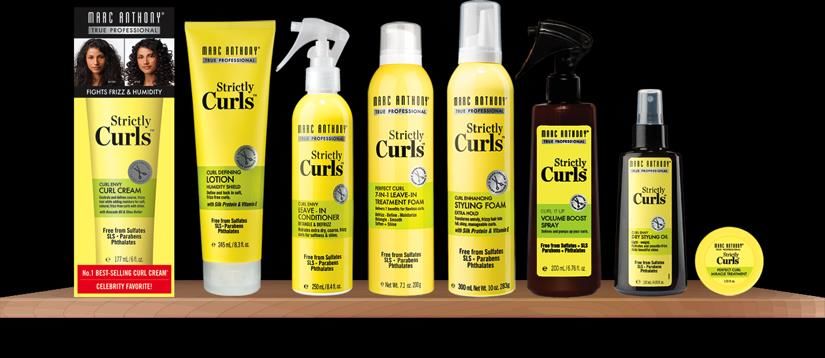
Complementary high-growth portfolio of Masstige brands

Modern, salon-inspired brand that       Plant-based, naturally-inspired products that   Lifestyle brand that provides a fun,
consumers trust to solve their unique   don’t sacrifice performance or affordability    vibrant and rich sensorial experience
hair concerns

185 SKUs across 21 collections          172 SKUs across 9 collections                   63 SKUs across 3 collections
                     Positioned to address a variety of consumers, industry trends and
                              retailer needs with limited competitive overlap
                                                                                                             MAV Beauty Brands   9
INVESTOR PRESENTATION - AWS
How we are winning shelf space

                           MAV Beauty Brands   10
We have strong and collaborative retail and distribution partners

     North American Retail Partners(1)                              Leading International Distributors
     Direct, longstanding and collaborative relationships
     with major North American retailers
                                                                    Distributors have strong relationships with major retailers in
                                                                    attractive international markets
                                                                    Add significant value by acting as local salesforce
                                                                                                                                              30+
                                                                                                                                              countries
     CHANNEL                      SELECT RETAIL PARTNERS

     DRUG

     MASS
                                  CVS, Rite-Aid, Shoppers Drug
                                  Mart, Walgreens

                                  Target, Walmart
                                                                                                                                              100+
                                                                                                                                              retailers
     FOOD                         HEB, Kroger, Loblaws

     CLUB

     SPECIALTY
                                  Costco

                                  Ulta Beauty

                                  Dollar General, Family Dollar
                                                                                                                                              60k+
     DOLLAR
                                                                                                                                              doors
     OFF PRICE                    Burlington, Ross, TJX

                                                                                                 Countries outside North America where
                                                                                                 MAV Beauty Brands currently has a presence

                                                  Highly diversified across retailers, brands and geographies
1)   North America means Canada and the United States.                                                                                        MAV Beauty Brands   11
We are in large and growing categories of a global market
 (US$ Billions)

                             MASSIVE GLOBAL MARKET                                                                 R E S I L I E N T & R E C E S S I O N - R E S I S TA N T
                                                        BODY    CARE(1)                               ◼ GLOBAL RETAIL SALES VALUE
                                                        35.4%                                         ◆ YOY RETAIL SALES GROWTH

                                                                                                                                                        CAGR:
                      BABY                                                                                                                               3.8%
                 PRODUCTS(2)
                      3.5%
                                                                                                     14.0%                                                                                      $73 $75             $80
                                                                                                                                                                                        $69 $71
                                                                                                                                                                                 $66                                $70
                                                                                             HAIR    12.0%                                                                $63
                  ORAL CARE
                       9.5%
                                                 $465B                                       CARE
                                                                                             16.2%   10.0%
                                                                                                             $45 $46
                                                                                                                     $48 $50
                                                                                                                                       $53 $54 $55
                                                                                                                                                            $58 $60
                                                                                                                                                                                                                    $60
                                                                                                                                                                                                                    $50
                                                                                                      8.0%

                                                                                                                                5.2%

                                                                                                                                                                          5.0%
                                                                                                                                       4.8%
                                                                                                                                                                                                                    $40

                                                                                                                                                                   4.5%

                                                                                                                                                                                 4.4%

                                                                                                                                                                                        4.4%
                                                                                                                                                            4.2%
                                                                                                                         3.9%
                                                                                                      6.0%

                                                                                                                  3.3%

                                                                                                                                                                                                             3.3%
                                                                                                                                                                                               2.9%
                                                                                                                                                                                                                    $30

                                                                                                                                                                                                      2.8%
                      FRAGRANCES

                                                                                                                                              2.4%

                                                                                                                                                     2.4%
                           10.6%                                                                      4.0%
                                                                                 COLOUR                                                                                                                             $20
                                                                                 COSMETICS            2.0%                                                                                                          $10
                                                 MEN'S
                                             GROOMING                            14.2%
                                                 10.7%
                                                                                                      0.0%                                                                                                          $0
                                                                                                             2003 2004 2005 2006 2007 2008 2009 2010 2011 2012 2013 2014 2015 2016 2017

                                                     Strategically positioned in highly attractive end markets
Source: Euromonitor International, Beauty and Personal Care 2018 Edition.
1)     As per Euromonitor International’s Skin Care and Bath & Shower definitions.
2)     As per Euromonitor International’s Baby and Child Specific definitions.                                                                                                                        MAV Beauty Brands   12
We are aligned with key growth trends                                                                                                                                                   Millennials spend
                                                                                                                                                                                        disproportionally high
                                                                                                                                                                                        amounts on beauty &
                                                                                                                                  Growing demand for
                                                                                                                                                                                        personal care
                                                                                                                                  natural personal care
                                                                              Increasing popularity
                                                                              of authentic,
                                                                                                                                  products
                                                                                                                                                                                        +30%
                         Strong consumer
                         demand for higher
                                                                              independently-
                                                                              founded brands                                    +10%
                                                                                                                                   4-year CAGR of the global
                                                                                                                                                                                        Anticipated increase in millennials’
                                                                                                                                                                                        share of the total U.S. retail
                                                                                                                                                                                        expenditure by 2020P(3)
                         quality products
                         that are convenient
                           SHIFTING AWAY FROM SALON PROFESSIONAL
                                                                            +22%
                                                                              3-year CAGR of independently-
                                                                                                                                   natural and organic personal
                                                                                                                                   care products market(2)

                                                                              founded brands (excluding brands
                                     MASSTIGE                                 that were acquired >3 years ago)(1)

                             TRADING UP FROM TRADITIONAL MASS

                           01                                                             02                                                         03                                                      04
1)   Includes Hask, Marc Anthony, Maui Moisture, Not Your Mother’s, OGX, Renpure and Shea Moisture; U.S. retail sales data per Nielsen downloaded May 2018 (3-year CAGR from Q1 2015 - Q1 2018).
2)   Source: Persistence Market Research – Global natural & organic personal care market, 2018 report purchased in April 2018.
3)   Source: U.S. Census Bureau and Fung Global Retail & Technology.                                                                                                                                                    MAV Beauty Brands   13
We innovate better than our competitors

Product Ideas                                                             Integrated Product Development
•   Beauty experts
                                                                          •   Management’s extensive industry experience
•   Founder-led innovation
                                                                          •   R&D team
•   Collaboration with retail partners
                                                                          •   Internal creative resources
•   Bi-annual innovation summit

                                                                          Consumer & Retailer Feedback &
Flexible Supply Chain                                   Quick & Nimble
                                                                          Validation
•   Collaborative and longstanding relationships       Innovation Cycle
                                                                          •   Collaborative and active dialogue with retail
    with diverse group of suppliers
                                                                              partners provides opportunity to react to feedback
•   Asset-light business model allows us to be more                           in midst of buying cycle
    nimble, driving industry-leading speed-to-market
                                                                          •   Products often launched at strategic retail partners
•   Efficient operations                                                      before mainstream launch

           Ability to consistently deliver fast and highly successful new product launches
                                                                                                            MAV Beauty Brands      14
Innovation in action

                    New product ideas:                                                              Retailer feedback:
               Continued product innovation                                                          Speed to market
                 S T R I C T LY C U R L S C O L L E C T I O N                                     RENPURE BODY WASH

  • Recognized significant unmet demand for products to style curly hair in   • We were asked by a U.S. retailer in July 2017 to provide a body wash
    the early 2000s                                                           • Using our in-house chemist, we developed and presented body wash
  • Launched nationally in Canada and the U.S. primarily as a styling           options to the buyer one month later, from which two formulas were
    product in 2001                                                             chosen to launch in January 2018
  • Strictly Curls has been on the shelf since 2001 and continues to grow     • Ultimately shipped four body wash SKUs in January 2018, less than six
    significantly in excess of the broader market                               months after meeting the body wash buyer
  • Continued product innovation, through new products and packaging,         • Our body wash SKUs have been extremely successful and buyer has
    has resulted in a loyal consumer following                                  expanded the line

                                                                                                                                     MAV Beauty Brands   15
We invest and activate in-store

                                       In-Store Promotions   Endcaps   Holiday Bonus Pack

   Most purchase
   decisions are
   made at shelf

 Collaborative, partnership approach
 with retailers
 Enables real-time performance and
 ROI measurement

                                                                             MAV Beauty Brands   16
We use efficient channels that build community
Marc Anthony Stylist Squad                    Public Relations                                Social Media
Elevate the connection between products,      Established relationships with key              Create content that generates
salon quality and the consumer experience     digital, print and televised media              education and entertainment

                                                                                                                                $7.3mm
                                                                                                                                earned media value(1)

Industry Events                               Consumer Engagement                             Micro-influencers
Create branded experiences that capture       Foster a dialogue with our consumers in order   We work with hundreds of high performing micro-influencers who
attention and spikes up conversation          to keep them excited about our brands           endorse our products to targeted consumer groups

1) For the year to date ended Dec 31, 2018.                                                                                               MAV Beauty Brands    17
Our model is working

               +56%
              POS growth for Marc Anthony                                                #1
              True Professional
                                                                                         Fastest-growing brand in
                                                                                         U.S. drug channel

                +20%
              POS growth for Renpure
                                                                                         (Marc Anthony True Professional)

Source: Nielsen AOD, BC SUPER CATEGORY: HAIR CARE – Total US – OND 18 (W/E 12/29/2018)                  MAV Beauty Brands   18
About MAV       Growth        Financial
Beauty Brands   Strategies    Overview

01              02            03

                02           Growth
                             Strategies

                                          MAV Beauty Brands   19
Business model provides visibility and stability

                 Retail Distribution                                           Illustrative Retail Partner Planogram

                                                                                                                                                        NEW
                                                                                                                                                    INNOVATIONS

                                                                                                                                                       BYE BYE

                                                   $
NUMBER OF                                                                                                                                               FRIZZ

STORES (DOORS)                                                                                                                        BYE BYE
                                                                                                                                       FRIZZ
                                                                                                                                                     GROW LONG

                                                                 SHELF SPACE
                     TOTAL
       x         =   POINTS OF
                     DISTRIBUTION   x   VELOCITY   =   REVENUE                                                     GROW LONG
                                                                                                                                    GROW LONG

                                                                                                                                                      COCONUT
                     (PODS)                                                                                                          COCONUT
                                                                                                                    COCONUT
FACINGS PER                                                                                        COCONUT
STORE (SKUS)
                                                                                                                                                    STRICTLY CURLS
                                                                                                                                   STRICTLY CURLS
                                                                                                                  STRICTLY CURLS
                                                                                STRICTLY CURLS   STRICTLY CURLS

                                                                                                                       TIME

                                                                                                                                      MAV Beauty Brands              20
Multiple levers for continued growth

     01                             Incremental sales of
                                    existing brands to
                                    existing partners
     U . S . T O T A L D I S T R I B U T I O N P O I N T S (1)
                                                                                                 02            CANADIAN
                                                                                                                                      Cross-selling our
                                                                                                                                      complementary
                                                                                                                                      brand portfolio
                                                                                                                                                        U.S.
                                                                                                                                                                                                03                                 Extending our reach
                                                                                                                                                                                                                                   into new international
                                                                                                                                                                                                                                   markets

                                                                                                               R E TA I L E R S                         R E TA I L E R S
                                                                                                                26 total retailers                       47 total retailers

                                                                                                                                                                        36
                                                                                                                                                                                                          30+                                Countries
                                                                                                                                                                                                                                             today

                 3,322
                                                                                                                                                                                                          39
                                                                                                                                                                                                                                            Target countries with
                 Q1 2018A AVERAGE OF
                 TOP 10 HAIR CARE BRANDS(2)                                                                                                                                                                                                 hair care sales of
                                                                                                                                 17
                                                                                                                                                                                                                                            ≥US$100+ million(3)
                                                                                                                                                          11
                                                                                                                    9
                                                           488
                                                           MAV BEAUTY BRANDS
                                                           Q1 2018A

                                                                                                                  Ability to introduce ONE new brand
                                                                                                                                                                                                          10                                 New markets
                                                                                                                                                                                                                                             in 2018

                                                                                                                  Ability to introduce TWO new brands

1)   U.S. Nielsen downloaded May 2018. Based on the Brand High Total Distribution Points (“TDP”) of the Marc Anthony and Renpure namesake brands as at March 31, 2018. TDP is an approximate measurement of the distribution of a brand (or ‘‘product aggregate’’) while
     taking into account the number of retail locations and Universal Product Codes, or UPCs, selling within that brand or aggregate; the calculation is the sum of % ACV across UPCs. The Company believes that this metric provides a relative indication of retail penetration
     factoring in both distribution breadth and distribution depth.
2)   Top 10 hair care brands include L'Oréal, Garnier, TRESemmé, Pantene, Suave, Head & Shoulders, OGX, Dove, Conair and Herbal Essences.
3)   Euromonitor International, Beauty and Personal Care 2018 Edition.                                                                                                                                                                            MAV Beauty Brands                 21
Incremental opportunities beyond current outlook

01                          Entering new or
                            adjacent high-growth
                            categories                                               02              Strategically acquiring
                                                                                                     complementary
                                                                                                     businesses                     03                  Expanding our
                                                                                                                                                        distribution to new
                                                                                                                                                        retail partners

  (US$ BILLIONS)
                                                                                                                                                                     $164
 $465                                           Global beauty &
                                                personal care market

                                                                                                                           $66              $75
                                               $44                                       $49              $50
                                                                          $16
                                                ORAL CARE             BABY PRODUCTS(1)   FRAGRANCE      MEN’S GROOMING   COLOUR COSMETICS   HAIR CARE                      BODY CARE(2)

                                 OTHER PERSONAL CARE MARKETS                                    TARGET MARKETS                                          EXISTING MARKETS

Source: Euromonitor International, Beauty and Personal Care 2018 Edition.
1)     As per Euromonitor International’s Baby and Child Specific definitions.
2)     As per Euromonitor International’s Skin Care and Bath & Shower definitions.                                                                               MAV Beauty Brands        22
Building a portfolio of iconic brands through M&A

    Acquire fast-growing
    independent brands       01   Demonstrated ability to
                                  execute and integrate

                                                             What we look for
    Entrepreneurial and
    innovation-driven culture02   Highly attractive to
                                  founders
                                                            • Entry or expansion into adjacent high
                                                              growth markets
                                                            • Financial attractiveness
                                                              (high margins, asset light)
    Unlock sales potential
                             03
                                                            • Access to new consumer end-markets
                                  Cross-sell 100+           • Demonstrated innovation capabilities
    through global
                                  retailers                 • Revenue and integration synergies
    operating platform

    Operational efficiencies
    and best practices       04   Scale and synergies
                                  in supply chain

                                                                                       MAV Beauty Brands   23
About MAV       Growth        Financial
Beauty Brands   Strategies    Overview

01              02            03

                03           Financial
                             Overview

                                          MAV Beauty Brands   24
Strong historical financial performance
(US$ Millions)

                                                   REVENUE                                                         ADJUSTED                                ADJUSTED EBITDA
                                                                                                                 GROSS PROFIT

                                                         17.5%                   $102.6                              12.9%                                       8.0%
                                                            CAGR
                                                            CAGR                                                          CAGR
                                                                                                                          CAGR                                       CAGR
                                                                                                                                                                       CAGR

                                                                                                                                         $49.5                                    $28.6
                                                                   $75.7                                                                                                  $26.3
                                                                                                                                 $41.5
                                                    $62.0                                                                                          $21.0
                                                                                                                  $34.4                                      $20.4
                                      $53.8                                                              $30.5

                                     F2015    F2016  F2017 Pro F2018 Pro                                F2015    F2016  F2017 Pro F2018 Pro        F2015    F2016  F2017 Pro F2018 Pro
                                   Combined Combined Forma (1) Forma (2)                              Combined Combined Forma (1) Forma (2)      Combined Combined Forma (1) Forma (2)

1)   Pro forma for ownership of Renpure as of January 1, 2017 and excludes Cake Beauty.
2)   Pro forma for ownership of Renpure as of January 1, 2017 and includes Cake Beauty as of January 23, 2018.                                                                            MAV Beauty Brands   25
Q4 2018 pro forma financial results
(US$ Millions)
    REVENUE                ADJUSTED                ADJUSTED                 ADJUSTED               NET INCOME
                         GROSS PROFIT               EBITDA                 NET INCOME

       +42%                       +17%
                                                                           4.7

                 29.0                    13.5      8.6
                                                                                       3.6
                           11.5                               7.4

   20.5

                                                                                                    1.5
                                                                                                               1.1

  Q4 2017     Q4 2018     Q4 2017     Q4 2018     Q4 2017     Q4 2018     Q4 2017     Q4 2018     Q4 2017    Q4 2018
 Pro Forma   Pro Forma   Pro Forma   Pro Forma   Pro Forma   Pro Forma   Pro Forma   Pro Forma    Reported   Reported

                                                                                                 MAV Beauty Brands      26
Financial outlook
(US$ Millions)

                             REVENUE                                                 ADJUSTED EBITDA                                                  Key drivers and assumptions (3)
                                                                                                                                                  •    Strategically positioned in fast growing segments that will
                                                                                                                                                       continue to outperform the broader market
                                                                                                                         52.5-57.5
                                                       145-160                                                                                    •    Grow market share within existing retail partners and
                                                                                                                                                       distributors by increasing Points of Distribution (SKUs x Doors)
                                                                                                                 34-37
                                                                                                                                                  •    Cross-selling: increase number of retail partners and
                                          115-120                                                                                                      distributors who carry more than one of our brands
                                                                                    ~29.0           28.6
                             102.6                                                                                                                •    Expand into new international markets
              95-100
                                                                                                                                                  •    Benefit from operating leverage due to past investments in
                                                                                                                                                       Selling and Administrative
                                                                                                                                                  •    Gross margin percentage to increase steadily in 2019 and 2020

               F2018        F2018      F2019              F2020                     F2018        F2018      F2019           F2020
             Guidance(1) Pro Forma(2) Guidance            Target                  Guidance(1) Pro Forma(2) Guidance         Target

1)   Pro forma for ownership of Renpure as of January 1, 2017 and excludes Cake Beauty.                             3)   See Forward-Looking Information in the Company’s MD&A dated March 28, 2019
2)   Pro forma for ownership of Renpure as of January 1, 2017 and includes Cake Beauty as of January 23, 2018.                                                                                                            27
Additional financial highlights & market facts
      Total Debt (Dec 31, 2018)                                                                         US$113.0 mm        Ticker Symbol                   MAV (TSX)
      Cash (at Dec 31, 2018)                                                                                US$5.8 mm      52-week High/Low            $14.15 / $7.81
      Net Debt (at Dec 31, 2018)                                                                         US$107.1mm        Market Cap(1)                   ~$330 mm
      Net Debt/2018PF Adjusted EBITDA(3)                                                                            3.7x

      Shares o/s (Basic)(1)                                                                                      40.8 mm   ANALYST COVERAGE

      Shares o/s (Fully Diluted)(1)(2)                                                                           41.4 mm   BMO Capital Markets

      Insider Ownership                                                                                            ~58%    Canaccord Genuity

      TA Associates                                                                                                31.2%   CIBC World Markets

                                                                                                                           Jefferies
      Marc Anthony Venere Group                                                                                    18.2%
                                                                                                                           National Bank Financial

                                                                                                                           Raymond James

                                                                                                                           RBC Capital Markets

1)   Assumes conversion of 3,178 proportionate shares to 3,178,000 common shares as of April 1, 2019.
2)   Calculated using treasury method.
3)   Pro forma for ownership of Renpure as of January 1, 2017 and includes Cake Beauty as of January 23, 2018.                                       MAV Beauty Brands   28
Investment highlights

01   Leader within large and fast-growing categories of a global market

02   Complementary high-growth portfolio of brands

03   Next generation platform drives growth

04   Innovative products that drive consumer demand and retailer traffic

05   Strong financial performance with diverse revenue streams and attractive cash flow characteristics

06   Entrepreneurial founder-led team comprised of world-class industry executives

                                                                                             MAV Beauty Brands   29
Appendix

           MAV Beauty Brands 30
Pro forma Q4 2018 Compared to Pro forma Q4 2017 and Pro forma
F2018 Compared to Pro forma F2017
    The unaudited pro forma net income and comprehensive income for Q4 2018, F2018, Q4 2017, F2017, reflect the following transactions:
    • The acquisition by the Company of 100% of the outstanding units of Renpure, LLC on March 8, 2018.
    • The refinancing of credit facilities concurrent with the closing of the IPO as described.
    • The completion of the IPO and concurrent changes to the share capital.

    The pro forma numbers presented by management give effect to the above transactions as if they have been consummated on January 1, 2017. Renpure
    Was acquired by the Company on March 8, 2018 and therefore the financial results of Renpure have been consolidated with the unaudited financial results
    Of the Company starting March 8, 2018.
                                                                      Pro forma            Pro forma           Pro forma            Pro forma
    (in thousands of US dollars) (unaudited)                           Q4 2018              Q4 2017            Fiscal 2018          Fiscal 2017
    Consolidated statements of operations and
       comprehensive income:
    Revenue                                                                   29,032               20,458              102,629               75,678
    Cost of sales                                          (3)                15,581                8,971               53,467               36,889
    Gross profit                                                              13,451               11,487               49,162               38,789

    Expenses
    Selling and administrative                           (1), (4)              7,849                3,869               26,524               17,310
    Foreign exchange loss (gain)                                                (423)                 (33)                (554)                 154
    Amortization and depreciation                          (2)                   787                  743                3,135                2,924
    Finance and other charges                              (1)                 2,474                1,606                7,946                6,459
                                                                              10,687                6,185               37,051               26,847

    (Loss) income before income taxes                                          2,764                5,302               12,111               11,942

    Income tax expense
    Deferred                                               (5)                    705               1,351                3,089                3,044
                                                                                  705               1,351                3,089                3,044
    Net income and comprehensive income for the
    period                                                                     2,059                3,951                9,022                8,898
    EBITDA                                                                     5,235                7,567               21,782               20,948
    Adjusted EBITDA                                                            7,365                8,578               28,622               26,312
    Adjusted Net Income                                                        3,646                4,703               14,119               12,894

                                                                                                                                                              MAV Beauty Brands   31
Pro forma Q4 2018 Compared to Pro forma Q4 2017 and Pro forma
F2018 Compared to Pro forma F2017

                                                     Pro forma        Pro forma        Pro forma         Pro forma
    (in thousands of US dollars) (unaudited)          Q4 2018          Q4 2017         Fiscal 2018       Fiscal 2017
    Net income and comprehensive income
       for the period                                        2,059            3,951             9,022             8,898
       Income tax expense                                      705            1,351             3,089             3,044
       Interest                                              1,684            1,522             6,536             6,082
       Amortization and deprecation                            787              743             3,135             2,924
    EBITDA                                                   5,235            7,567            21,782            20,948
       Transaction-related costs               (1)             758              424             1,868               740
       Non-recurring charges                   (2)             875              373             2,805             1,547
       Purchase accounting adjustments         (3)               -                -                55             2,672
       Share-based compensation                (4)           1,099               93             2,284               303
       Foreign exchange (gain) loss                           (602)             121              (172)              102
    Adjusted EBITDA                                          7,365            8,578            28,622            26,312

                                                     Pro forma        Pro forma        Pro forma         Pro forma
    (in thousands of US dollars) (unaudited)          Q4 2018          Q4 2017         Fiscal 2018       Fiscal 2017
    Net income and comprehensive income
       for the period                                        2,059            3,951             9,022             8,898
       Transaction-related costs                               758              424             1,868               740
       Non-recurring charges                                   875              373             2,805             1,547
       Purchase accounting adjustments                           -                -                55             2,672
       Share-based compensation                              1,099               93             2,284               303
       Foreign exchange (gain) loss                           (602)             121              (172)              102
       Tax impact of the above
          adjustments                                         (543)            (259)           (1,743)           (1,368)
    Adjusted Net Income                                      3,646            4,703            14,119            12,894

                                                                                                                           MAV Beauty Brands   32
Pro forma Q4 2018 Compared to Pro forma Q4 2017 and Pro forma
F2018 Compared to Pro forma F2017

 1.   Concurrent with the closing of the IPO, the Company entered into a new $107,500 term loan credit facility and a $20,000 revolving credit facility available. This refinancing
      resulted in the Company's cost of borrowing reducing to an effective interest rate of approximately 5.15%. The refinancing resulted in a reduction of interest expense of $nil
      and $742 for pro forma Q4 2018 and Q4 2017 respectively, after considering commitment fees on the unused revolving credit facility and the amortization of the financing costs
      on the refinanced debt. An additional $nil for pro forma Q4 2018 and $30 for pro forma Q4 2017 has been adjusted for related to transaction costs which are non-recurring in
      nature and would not reflect the expenses of the combined entity on an ongoing basis.

 2.   Adjusted for incremental amortization of $170 for proforma Q4 2017 as a result of the fair value adjustment to customer lists in connection with IFRS 3 accounting.

 3.   In conjunction with the acquisition of Cake Beauty Inc. January 23, 2018 and Renpure, LLC on March 8, 2018, the fair value adjustment of inventory as part of the initial
      purchase price allocation was amortized.

 4.   Adjusted for related party commissions of $1,285 and related party salaries and benefits of $29 in Q4 2017 as a result of these expenses being non-recurring in nature and
      would not reflect expenses of the combined entity on an ongoing basis.

 5.   Income tax have been reflected at 25.5% of the net adjustments.me tax have been reflected at 25.5% of the net adjustments.

                                                                                                                                                                MAV Beauty Brands      33
Q4 2018 Compared to Q4 2017 and F2018 Compared to F2017

                                                Reported       Reported          Reported        Reported
   (in thousands of US dollars) (unaudited)     Q4 2018         Q4 2017         Fiscal 2018     Fiscal 2017
   Consolidated statements of operations and
      comprehensive (loss) income:
   Revenue                                           29,032          12,164           94,039          42,368
   Cost of sales                                     15,581           4,759           51,222          16,933
   Gross profit                                      13,451           7,405           42,817          25,435

   Expenses
   Selling and administrative                         7,849           2,405           26,701          10,878
   Foreign exchange loss (gain)                        (423)            (57)            (570)             67
   Amortization and depreciation                        787             573            3,007           2,238
   Finance and other charges                          2,474           2,348           25,889           9,347
                                                     10,687           5,269           55,027          22,530

   (Loss) income before income taxes                  2,764           2,136          (12,210)          2,905

   Income (recovery) tax expense
   Deferred                                           1,655               655         (1,808)            889
                                                      1,655               655         (1,808)            889
   Net (loss) income and comprehensive (loss)
   income for the period                              1,109           1,481          (10,402)          2,016
   EBITDA                                             5,235           4,973            8,227          14,114
   Adjusted EBITDA                                    7,365           5,773           26,200          16,047
   Adjusted Net Income                                2,696           2,036            2,989           3,357

                                                                                                               MAV Beauty Brands   34
Q4 2018 Compared to Q4 2017 and F2018 Compared to F2017

                                                    Reported        Reported        Reported          Reported
   (in thousands of US dollars) (unaudited)          Q4 2018         Q4 2017       Fiscal 2018       Fiscal 2017
   Net (loss) income and
      comprehensive (loss) income
      for the period                                       1,109           1,481          (10,402)            2,016
      Income (recovery) tax expense                        1,655             655           (1,808)              889
      Interest                                             1,684           2,264           17,430             8,971
      Amortization and deprecation                           787             573            3,007             2,238
   EBITDA                                                  5,235           4,973            8,227            14,114
      Transaction-related costs               (1)            758             424           10,723               740
      Non-recurring charges                   (2)            875             185            2,427               874
      Purchase accounting adjustments         (3)              -               -            2,727                 -
      Share-based compensation                (4)          1,099              93            2,284               303
      Foreign exchange (gain) loss                          (602)             98             (188)               16
   Adjusted EBITDA                                         7,365           5,773           26,200            16,047

   (in thousands of US dollars) (unaudited)         Q4 2018         Q4 2017        Fiscal 2018       Fiscal 2017
   Net (loss) income and
      comprehensive (loss) income
      for the period                                      1,109           1,481          (10,402)            2,016
      Transaction-related costs               (1)           758             424           10,723               740
      Non-recurring charges                   (2)           875             185            2,427               874
      Purchase accounting adjustments         (3)             -               -            2,727                 -
      Share-based compensation                (4)         1,099              93            2,284               303
      Foreign exchange (gain) loss                         (602)             98             (188)               16
      Tax impact of the above
         adjustments                                       (543)           (245)          (4,582)             (592)
   Adjusted Net Income                                    2,696           2,036            2,989             3,357

                                                                                                                      MAV Beauty Brands   35
Q4 2018 Compared to Q4 2017 and F2018 Compared to F2017

1.   In July 10, 2018 we successfully completed the IPO and our Shares are listed on the Toronto Stock Exchange under the stock symbol "MAV". Comprised of $738 for Q4 2018
     related to the fair value remeasurement of the deferred consideration and $20 for costs associated with the 2018 Acquisitions that have been accounted for as finance and other
     charges. Fiscal 2018, $8,424 of transaction-related costs of the Company have been incurred in connection with the IPO and 2018 Acquisitions, which have been accounted for as
     finance and other charges and $2,299 of transaction-related costs of the Company incurred in connection with the IPO and the 2018 Acquisitions, which have been accounted for
     as selling and administrative expenses.
2.   Comprised of $875 for Q4 2018 and $2,112 for Fiscal 2018 of non-recurring costs representing predominantly expenses incurred in respect of the following matters: (i) recruiting
     costs incurred as part of the Company's efforts to put in place additional senior management, (ii) consulting fees in respect of finance support and operations relating to
     transaction-related matters, (iii) severance costs incurred in respect of certain employees and payments related to the termination of certain consulting contracts on acquisition,
     (iv) salary and wages related to staff integration to operate one salon, and (v) non-recurring private company board expenses, which have been accounted for as selling and
     administrative expenses. Fiscal 2018, $315 of non-recurring costs have been incurred by the Company in cost of sales, of which $112 relates to the salon stylist integration and
     $203 relates to inventory expenses incurred in connection with the integration of the 2018 Acquisitions.
3.   In conjunction with the 2018 Acquisitions, the fair value adjustment of inventory as part of the initial purchase price allocation was expensed to cost of sales as the inventories
     were sold.
4.   Represents recognition of share-based payments, which have been accounted for as selling and administrative expenses.

                                                                                                                                                                MAV Beauty Brands          36
You can also read