COMMUNITY NEEDS ASSESSMENT - Spokane County 2019-2021
←
→
Page content transcription
If your browser does not render page correctly, please read the page content below
COMMUNITY NEEDS
  ASSESSMENT
 Spokane County 2019-2021

                            Last Edited 12/2018
EXECUTIVE SUMMARY
In 2019, Spokane Neighborhood Action Partners (SNAP) continues to address the needs
of those experiencing poverty in Spokane County, Washington (WA), as SNAP has done
for 53 years. SNAP serves primarily the geographic area of Spokane County and the
Cities within it, covering 1764 square miles. Additionally, some SNAP programs cover
multiple counties. However, for this Community Needs Assessment Spokane County,
which is most broadly served by SNAP, is the area evaluated.
Spokane County Demographics
Total Population 499,800 individuals
Largest Age Group 18-64 (61.6%)
Gender 50.35% Female, 49.65% Male
Largest Race Population 89.7% Caucasian
Median Household Income $53,809
Median Home Value $247,500
Fair Market Rent $867
Sources: OFM1, SRHD2
This Community Needs Assessment aids SNAP in developing a Strategic Plan to guide its
service delivery strategies, prioritize the resources it allocates to address the deep rooted
causes of poverty, and to communicate regarding issues of poverty with its partners and
other key stakeholders for the next three years.
The aim of this Community Needs Assessment is to evaluate current need in SNAP’s
service area from a broad perspective of views towards determining the greatest needs
or “key findings.” SNAP’s Community Needs Assessment Survey results were used to
determine the findings of this assessment. Once determined the underlying causes
were explored through research, and they were categorized as family, agency, or
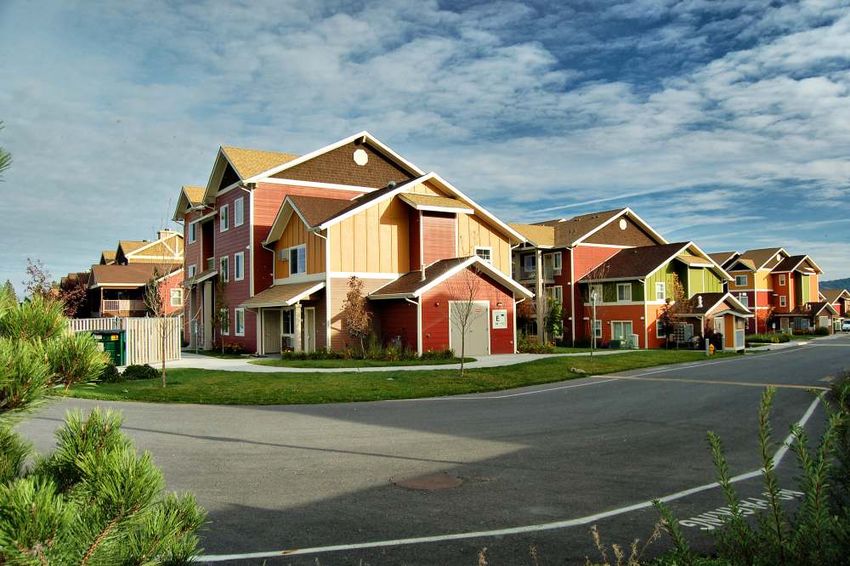
community level needs. Two key findings were determined. One key finding is the need
for safe and affordable housing, through a variety of approaches, including low barrier
housing (housing with suitability and eligibility criteria that allow households with poor
credit, negative rental history, criminal
1
background, or low income, to be qualified) in Spokane County. This is a family level
need. Factors contributing toward this need include:

   •   Growing disparity between income and housing costs,
   •   Low housing and rental stock,
   •   Lack of designated housing for low-income and high barrier households,
   •   Aging housing stock leading to homes in need of repair,
   •   Homelessness is on the rise and
   •   Programs which provide resources to make housing more affordable (Section 8
       Vouchers, affordable housing units etc.) are scarce.

Another key finding is the impact of multiple factors on a continually aging population.
This is a family level need.

Factors contributing toward this need include:

   •   Rising costs of living coupled with fixed wages/income,
   •   Healthcare,
   •   General transportation requirements and
   •   Need for "aging friendly" communities

Additional needs identified were Violence, Transportation, Financial Resiliency and Racial
Disparities.

Narrative Statistics
Spokane County had a population of 499,800 with 217,300 of the population living within
the City of Spokane, 144,788 Unincorporated and 94,890 in the City of Spokane Valley.
The population is relatively evenly distributed with the female population comprised
50.35% of the report area, while the male population represented 49.65%2. The largest
represented group is ages 18-64 at 61.6% of the population, youths 17 and under
representing 23%, and adults over the age of 65, making up 15.6% of the population. 1

89.7% of the population is estimated to be Caucasian, which marks a .2% decrease
compared to the 2010 census. Washington State was estimated to be 76.9% white.
Spokane County is not racially diverse, but some minority populations are experiencing
growth. There was growth in the Asian (2.38%), Black/African American (1.92%) and
American Indian/Native Alaskan (1.34%) population. Native Hawaiian (.36%) and those of
two or more races (3.78%) are down slightly from 2010.

All races rate of poverty are higher in Spokane County than the state or nation, with the
poverty rate sitting at 13.2%. Native Hawaiian/Pacific Islanders are the most
disproportionate at 38% in Spokane County as opposed to 16.55% for WA and 19.58% for
the nation. Next is Black/African American at 35.33% in Spokane County, contrasted
with 24.97% for WA and 27.13% for the nation. Predominately, the family type for poverty

                                             2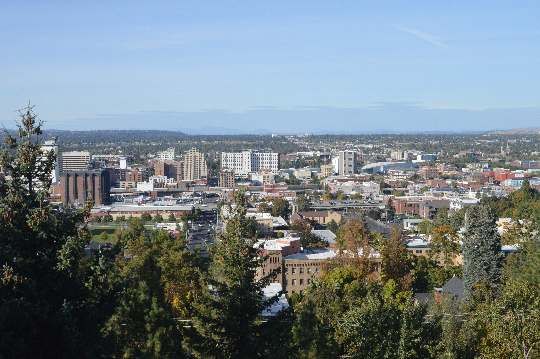
is female head of household at 54.3% in Spokane County, which is similar to state and
national data. 3

The estimated median per capita income for Spokane County is $42,028, an increase of
4.2% from last year ($54,579 WA). 17.55% or 87,6981 households received federal food
stamp program benefits. The median household income was $53,809 as opposed to
$68,550 for WA. While annual household income did increase in Spokane, when adjusted
for the Consumer Price Index, it did not keep pace with the rise in costs. Unemployment
fell from 6.5% percent in 2016 to 5.5% percent in 2017. 4

Meanwhile, the median home value has increased to $201,300, $105,100 under the state
average. Median home prices were at $247,500 as of August 2018 according to Spokane
Association of Realtors.8 Spokane County is 37.6% renter occupied and 62.4% owner occu-
pied. 42.7% of the rental population spends more than 35% of their income on rent alone.
Therefore, about 1 in 5 citizens are spending more than 35% of their income on rent.

            KEY FINDINGS
Survey respondents overwhelmingly found housing unaffordable- particularly rental
housing. Contributing to this key finding are low-vacancy rates, which are driving higher rent
prices and
allowing landlords to be more selective, often overlooking potential residents with higher
barriers. Housing assistance programs are found to be scarce relative to demand, resulting in
a growing population of Spokane County residents who are vulnerable to homelessness.

Age and accessibility issues compound the housing crisis. With rising senior populations, a
growing population who are falling below the Asset Limited, Income Constrained,
Employed thresholds at higher rates, there is a greater need to resolve high living
expenses.

Housing
Safe and affordable housing continues to be a need in Spokane County. Washington 211,
a community hotline who maintains a database of available resources, reported 65% of
calls they received for rent, mortgage assistance, and/or move-in costs were unmet.
18,807 or 23% of inquiries to SNAP in 2017 were for rental assistance, affordable housing
or homeless services while another 2% was for homeowner or homebuyer counseling.
40% of respondents, or 353 respondents, to SNAP’s 2018 Community Needs Assessment
Survey felt that rental housing was not affordable in Spokane County. This was the third
highest need identified by survey participants. The City of Spokane Consolidated Plan,
Spokane County Consolidated Plan and Community Health Advisory Board’s community

                                              3
assessments have all identified housing as top priorities. Contributing factors to this are
cost-burden, aging housing stock, low rental vacancy rates and an aging population.

Cost-burden is the most prevalent issue for renter households in Spokane County.
Working at minimum wage ($11.50) in Spokane County, a person would need 1.4 full time
jobs to afford a 2-bedroom apartment or would need to earn at least $16.67 per hour for a
monthly fair market rent of $867. The current estimated mean renter wage is $12.95.6
This cost-burden then starts to impact other expense areas such as utilities, food and
transportation, resulting in a domino effect of deficits. “The cost of basic household
expenses increased steadily in Washington to $62,472 for a family of four (two adults with
one infant and one preschooler) and $21,252 for a single adult, significantly higher than
the 2016 FPL of $24,300 for a family and $11,880 for a single adult. The cost of the family
budget increased by 28 percent from 2010 to 2016, much higher than the 9 percent
national rate of inflation during that time period.”

In Washington State, “It’s notable that in all of the 22 counties where a one-bedroom is
affordable, that minimum wage is set higher than the national minimum of $7.25. Still,
raising wages alone cannot dissolve this mismatch. The incredible shortfall in affordable
units remains the more stubborn, intractable problem.”7 According to Harvard University’s
Joint Center for Housing Studies, “Between 1990 and 2016, the number of rental units in
the U.S. priced below $800 per month (in real terms) shrank by nearly 2.5 million.
However, over the same period, the number of low-income renters paying cash rents –
those making no more than $32,000 annually in real terms, and excluding those living in
institutional quarters — grew by more than 4.5 million households, according to data and
analyses in the Joint Center’s latest State of the Nation Housing report.”14

Additionally, there are low-vacancy rates for rental housing. An average vacancy rate in
2017 for rentals was 2.9%, according to a September 2017 report by University of
Washington’s Runstad Center for Real Estate Studies. “With low vacancy rates came
higher rental rates, and the 2016 average overall rent increased by $102 per month over
the last year. This resulted in the fastest 12-month increase in average rental rates in the
past 10+years.”5 Landlords can afford to be picky in this market, often running credit
checks and overlooking those with high barriers including criminal backgrounds, poor
credit and negative rental history. SNAP’s Community Needs Assessment Survey found

                                              4
the top need of Spokane County residents was to increase their credit scores with 49% or
431 respondents, indicating that a low credit score has proven to be a barrier in some
capacity in their lives.

The County Consolidated Report concludes, “Housing is not allocated by need, unless
housing is held specifically for qualifying households (both in terms of ability to pay and
household composition), such as most subsidized housing. Instead, many lower cost units
(owned or rented) are occupied by households with higher incomes, better credit, and
fewer needs. Many of the lowest income households have barriers that limit choices, such
as poor credit histories and criminal histories.”

While rental housing remains unaffordable, access to programs which will make housing
affordable is scarce when compared to demand. Spokane Housing Authority has 74
public housing units, and 4,784 Housing Choice Vouchers currently being utilized in the
community. They also own and manage 867 affordable units. Long wait lists for
assistance for these resources indicates a high need. “As a result of the most recent open
application period, over 2,000 applicants were placed on the Housing Choice Voucher
waiting list suggesting that many County residents are still in need of housing assistance.”
8

The threat of homelessness often affects those who could not access assistance. The
City of Spokane’s Everybody Counts survey found that homelessness had increased to
14% in 2018, a 9% increase from 2017. While this percentage is much higher than in
previous years, it is important to note that they survey was distributed to a larger
geographic area and was administered digitally. That translates to 1,245 sheltered and
unsheltered individuals. Survey participants were asked what barriers homeless
individuals face and how they got to where they were. A lack of income and lack of
affordable housing were found to be the two factors which surveyors reported either
caused or are preventing them from no longer being homeless.

Compounding this is the issue of aging and inadequate housing stock. “While the primary
housing issue facing low and moderate income residents is affordability, there are other
housing problems including: lack of complete plumbing/kitchen facilities - estimated at
360 renter and 87 owner households; overcrowding estimated at 418 renter and 201
owner households; and severely overcrowding estimated at 194 renter and 23 owner
households.” 8 Additionally, the Spokane County Consolidated Plan estimates that 25% of
owner occupied housing had one selected condition which did not meet HUD Housing
Quality Standards or another local code. 44% of renter occupied housing had one
selected condition and 2% had two selected conditions. A large population of elderly
home-owners that do not have the income to support maintenance and retention of their
housing is a factor in these statistics.

                                             5
Aging Population
United Way’s ALICE (Asset Limited, Income Constrained, Employed) Report for
Washington State provides information “to enable communities to move beyond
stereotypes of “the poor” and an outdated Federal Poverty Level (FPL), and instead use
unbiased data to inform programmatic and policy solutions for ALICE and communities,
now and for the future.” From the ALICE Report, “Of Washington’s 2,767,682 households,
11 percent lived in poverty in 2016 and another 28 percent were ALICE. Combined, 39
percent (1,068,246 households) had income below the ALICE Threshold, an increase of 22
percent since 2010.”

The increase in the number of ALICE households in Washington is driven by older
households. The number of senior households (65 years and older) increased
dramatically from 514,402 in 2010 to 656,014 in 2016, a 28% increase. Yet the number of
senior households with income below the ALICE Threshold grew at an even faster rate of
44%, so that by 2016, 42% of senior households had income below the ALICE Threshold.
The largest increases were among households 65 years and older, with White senior
households below the ALICE Threshold increasing by 40%, Hispanic senior households by
93%, Asian senior households by 50%, and Black senior households by 28%.

Nationally, nearly 20% of the population will be 65 and older by 2030. This population is
expected to nearly double between 2012 and 2050 while the 85 and older group will
triple in population at that time. Comparatively, “in Spokane County 21% of the population
will be 65 or older by 2030. At the same time that care needs of an aging population
increase, Office of Financial Management projects that the share of working age
individuals will decline relative to the population dependent upon them.” 8

Aging and Long Term Care of Eastern Washington (ALTCEW) is the designated Area
Agency on Aging covering five counties including Spokane, Ferry, Pend Oreille, Stevens
and Whitman. ALTCEW’s Consolidated Plan identified the need to address high costs of
living, the need for “aging friendly” communities. Distinctions of these communities are
housing on one level, access to amenities, walkability (sidewalks clear of snow), as well as
safe and accessible transportation. 8 The growing trend to age in place will also impact
how health care is delivered and the need for transportation.

High costs of living, fixed wages and increasing aging populations are also affecting the
rate of homelessness among the 65 or older population. An article featured on Q13 News
in Seattle entitled, “Gray Tsunami: More seniors filling homeless shelters” sheds light on

                                             6
the uptick of seniors in homeless situations. “According to the National Alliance to End
Homelessness, in 2008 seniors made up 22 percent of the national population. In 2016,
that number jumped to 28 percent, and as the Baby Boomer population gets older, those
numbers are only expected to grow.” Sylvia Anderson, CEO of the Everett Gospel Mission
WA states “ ‘The stereotype is people that made bad choices, that they’re on drugs or
alcohol or they have significant mental health (problems), but the other story is simply
people who have outlived their money,” Anderson said of the elderly homeless
population in her shelter. Many are banking on a significant Social Security payout, but
when they get the check, it’s a reality check. On average, the women here at the shelter
get less than $750 per month. It’s even harder for people between 50 and 61. They’re too
old to get hired but too young to receive their Social Security benefit. “You work hard
your whole life, and then you retire to poverty,” said Anderson.”

                 ADDITIONAL FINDINGS
The assessment revealed that racial minorities disproportionately fell below the Federal
Poverty Line. This disparity between people of color and their Caucasian counterparts has
significant impacts in multiple areas. One area of impact is access to medical care, as
respondents cited transportation expenses as a barrier to medical treatment. Further,
residential segregation by socio-economic status contributes to physical and social
conditions that promote violence, leading to an increasing rate of child abuse, domestic
violence, depression, and other violence in Spokane County. Per the assessment, there is an
increased need for financial resiliency for the members of our community.

Racial Disparities
While age is an aspect of poverty, so is race. A disproportionate level of poverty amongst
minorities remains a prevalent issue in our community. “The percent of individuals living
at or below 100% FPL differs significantly by race and Hispanic ethnicity. A five-year
average (2012-2016) shows that 15.6% of residents in Spokane County live at or below
FPL. When race is taken into account, less than 15% of white individuals are below the
FPL, while 25% or more of Black, American Indian/Alaskan Native, Native Hawaiian/Other
Pacific Islander, other race, or multi-racial are living at or below FPL. Just over 25% of
those of Hispanic ethnicity are living in poverty.”4 Over 70% of minority individuals made
less than $50,000 per year, compared to 59% of whites. (SRHD Quality of Life Survey
2017).

                                             7
Percent of Individuals within Race and Ethnicity Categories
              Living at or Below 100% FPL, 5-Year Average - 2012-2016
              Race/Ethnicity       Spokane County Washington State
              Total all races      15.6%              12.7%
              White                14.4%              11.3%
              Black                29.6%              24.1%
              AIAN                 31.6%              26.7%
              Asian                15.9%              11.4%
              NHOPI                32.0%              18.1%
              Some other race      27.5%              23.6%
              Two or more races 25.0%                 16.5%
              Hispanic ethnicity   25.4%              22.9%
Source: SRHD Demographics and Data 2, U.S. Census Bureau, American Community Survey

AIAN – American Indian/Alaskan Native; NHOPI – Native Hawaiian/Other Pacific Islander

This gap is evident when looking at access to healthcare and overall health for minorities.
By race, Hispanics in Spokane had the highest percentage of delay in receiving medical
care in the last 12 months due to transportation2. From the ALICE Report, “A variety of
large studies have also revealed an association between low socio-economic status and
greater harm from air pollution. A comprehensive review from Harvard University
researchers revealed that Black, Asian, and Hispanic individuals, as well as Medicaid-
eligible individuals of any race/ethnicity had a higher likelihood of death from any
pollution-related cause compared to the rest of the population, with Black people almost
three times as likely to die from exposure to air pollutants than other groups (Di, Wang,
Zanobetti, & Wang, 2017).” It is predicted this gap will continue to widen “as advances in
medical care outpace the ability of many households to afford them, there will be
increasing disparities in health and longevity based on income.”9

Violence
Spokane County is experiencing increasing rates of child abuse, domestic violence, and
depression, in addition to other forms of violence. Amongst other factors, location,
income and race inequities are all evident when analyzing data on violence in Spokane
County. Spokane Regional Health Districts “Confronting Violence Report” sheds light on
this intricate symptom, “Within communities defined by geographic boundaries, poor
health outcomes tend to follow indicators of low socio-economic status such as poverty.
For instance, Spokane’s downtown Riverside and the East Central neighborhoods,
generally considered low-income neighborhoods, have the highest overall age-adjusted
mortality rates out of 40 neighborhoods in Spokane County. Concentration of low socio-
economic status in neighborhoods—i.e. residential segregation—contributes to physical

                                             8
and social conditions that promote violence. As the physical appearance of a community
deteriorates—as evidenced by graffiti, litter, poor lighting, substandard housing,
abandoned cars and property—the perceptions of violence, safety, as well as actual
crime, increase.” The report goes on to describe a “90-fold difference” when comparing
neighborhoods with the highest versus the lowest income populations. 10

“Analysis of Healthy Youth Survey data for this report provides insights into differences in
risk factors by race and ethnicity. Differences between whites and other races included:

• Blacks reported fewer opportunities for prosocial involvement and higher availability of
  drugs.
• White youth had higher availability of guns than blacks.
• Compared to whites, youth who reported being two or more races:
       o Negatively experienced more laws specific to drug use.
       o Experienced more norms favorable to drug use.
       o Had higher availability of drugs.
       o Had fewer opportunities for prosocial involvement.
• API and Hispanic youth also reported fewer opportunities for prosocial involvement
  compared to white youth.”10

Transportation
While transportation for the aging is a need, there are other facets to this issue. SNAP’s
Community Needs Assessment’s revealed residents believed car insurance, licensing and
vehicle emissions are too expensive. 42% or 369 respondents shared this need. In a
similar survey conducted by Spokane Regional Health District on Spokane County
residents, Transportation/Roads were reported to be a high need.12 As a result in both
surveys, transportation related issues were ranked as the second highest need in the
community. Perhaps this has spurred the movement of Spokane area residents to
increase bus ridership, which has grown 33% since 2005.4 Additionally 211 reported that
Transportation/Travel was the agencies third highest unmet need11. Transportation
needs are often complex and can be challenging to meet.

                                             9
Intellectual and Developmentally Disabled (I/DD) individuals also have their own
transportation hardships. Arc of Spokane reports, “State programs do not pay for non-
medical transportation costs, so people with an Intellectual and Developmental Disability
typically pay for fares out of discretionary income which can range from $63 to $200 per
month. A significant percentage of people with I/DD in Spokane are profoundly affected
by transportation costs because of financial circumstance caused by their disability which
can consume between 30 and 90% of their monthly discretionary income.”1
Financial Resiliency
With the gap widening between housing expenses and income coupled with age and
race related income disparities, the need to increase financial resiliency for the
community emerges. Budgeting when ones income does not meet expenses and you do
not have assets to fall back on, leave residents in a vulnerable state. The United Way’s
Household Survival Budget for Washington State calculates the actual costs of basic
necessities, including housing, child care, food, transportation, health care, a smartphone,
and taxes. “Despite a low rate of inflation nationwide – 9 percent from 2010 to 2016 – the
bare-minimum Household Survival Budget increased by 27 percent for a single adult and
28 percent for a family of four. Affording only a very modest living, this budget is still
significantly more than the Federal Poverty Level of $11,880 for a single adult and
$24,300 for a family.” 9
From the ALICE Report: 9
10With a budget that does not add up having assets, such as savings, to rely on is key to
resiliency. However, residents of the state struggle to acquire and build these assets.
“The 2011 Corporation for Enterprise Development survey found that 26 percent of
Washington households were “asset poor,” defined as not having enough net worth to
subsist at the poverty level for three months without income. With no savings, an
emergency can quickly spiral into a crisis with devastating consequences (CareerBuilder,
2017; McKernan, Ratcliffe, & Shanks, 2011; Corporation for Enterprise Development,
2012).”9
11About SNAP’s 2018 Community Needs Assessment Survey
SNAP’s Community Needs Assessment Survey was developed from quantitative data
from staff, past assessments from SNAP and SNAP’s partners as well as from research
topics. Through this process, we identified need domain areas to frame our questions:
• Employment
• Education
• Financial
• Housing
• Transportation
• Health
• Safety
Within each of these needs domains was a list of needs statements (~7 per category)
which participants were asked to select if the need applied to them.
The survey was conducted via paper and digitally from July 23-August 6, 2018. The
survey was dispersed digitally through SNAP’s Twitter and Facebook accounts as well as
on our website (www.snapwa.org). Paper surveys were dispersed to six SNAP office
locations as well as at the following partner locations:
• West Central Community Center
• Catholic Charities (offices and affordable housing)
• Frontier Behavioral Health
• Career Path Services
• WorkSource
• Spokane County Libraries
• Next Generation Zone
876 responses were collected. Results were analyzed and the top three needs were
identified and used as a framework for this survey. The following were the top three
needs based on majority selection:
1. Need to improve credit score (431 responses or 49%)
2. Car insurance, licensing and vehicle emissions are too expensive (369 responses or
42%)
3. Rental Housing is not affordable (353 responses or 40%)
12Works Cited
The following documents, websites, publications, and articles were used as research in
developing SNAP’s 2019 -2021 Community Needs Assessment.
1-Office of Financial Management Spokane County Databook. (2017). Retrieved from
https://www.ofm.wa.gov/sites/default/files/public/dataresearch/databook/p
df/53063.pdf
2-Spokane Regional Health District. (2017). Demographic and Social Characteristics.
Retrieved from
https://srhd.org/media/documents/DemographicsSpokaneCounty2017.pdf
3- Spokane County Statistics. (2018). American Fact Finder. Retrieved from
https://factfinder.census.gov/faces/tableservices/jsf/pages/productview.xhtml?src=C
F
4-Journal of Business. (2018). Market Fact Book. Retrieved from
https://www.spokanejournal.com/special-publications/market-fact-book/
5-NAI Black. (2017). Greater Spokane Market Book. Retrieved from
http://www.naiblack.com/Portals/123/docs/2017%20NAI%20Black%20Market%20Repo
rt.pdf
6- National Low-Income Housing Coalition. (2018).Out of Reach: Washington. Retrieved
from
https://nlihc.org/oor/washington
7- Misra, T. (June 13, 2018). Minimum Wages Can't Pay for a 2-Bedroom Apartment
Anywhere. Citylab. Retrieved from
https://www.citylab.com/equity/2018/06/what-you-have-to-earn-to-rent-a-modest-
2-bedroom-mapped/562631/
8- Spokane County. (2015) Consolidated Plan 2015-20. Retrieved from
http://www.spokanecounty.org/CommunitySVCS/HCD/content.aspx?c=2219
9-United Ways of Washington. (2018) Alice: A Study of Financial Hardship in Washington.
Retrieved from
https://www.dropbox.com/s/y6obxfg0g49p6yw/18UW_ALICE_Report_WA_Refresh_Lo
wres_9.7.18.pdf?dl=0
10- Spokane Regional Health District. (July, 2017). Confronting Violence. Retrieved from
https://srhd.org/media/documents/Confronting-Violence-Low-Res.pdf
11-211 Newsletter
https://win211.org/category/newsletters/
1312-Spokane Regional Health District. (2017). 2017-2018 Spokane Community Needs
Assessment
https://srhd.org/data-and-reports
13-Arc of Spokane. (2017). Transportation Survey
14-La Jeunesse, Elizabeth. “Our Shrinking Supply of Low-Cost Rental Units.” The State of
the Nation's Housing 2018 | Joint Center for Housing Studies of Harvard University, Joint
Center For Housing Studies Of Harvard University, 27 June 2017, Retrieved from
http://www.jchs.harvard.edu/blog/our-shrinking-supply-of-low-cost-rental-units/
14You can also read