IT's that simple. Analyst Presentation September 2021

Page created by Ken Santiago
 
CONTINUE READING
IT's that simple. Analyst Presentation September 2021
IT’s that simple.
Analyst Presentation September 2021
IT's that simple. Analyst Presentation September 2021
Gone Into Turbo Mode: Outstanding Q3 Results Re-confirm
Upward Revision of Guidance

Revenue €m                              EBITDA €m                              EPS cents                               ▪ Increase in revenue
                                                                  47.0
                                                                                                                         driven by:
340                                     48                                     200                        193
                           330.8                                                                                        ▪ Organic growth of
                                                                                                                          9.6%
320                                     41                                     155                                      ▪ First-time consolidation
             +25.2%                                +84.1%                               +704.2%                           of URANO and dna
                                                                                                                          GmbH as of 01.05.21
                                                                  EBITDA
300                                     34                        margin       110
                                                                   14.2%                                               ▪ Substantial increase in
                                                                                                                         EBITDA confirms
                                                                                                                         restructuring success in
280                                     27        25.5                          65
                                                                                                                         banking
                                                 EBITDA
           264.2                                 margin                                    24
                                                  9.7%
260                                     20                                      20
      Oct 19 - Jun 20 Oct 20 - Jun 21        Oct 19 - Jun 20 Oct 20 - Jun 21         Oct 19 - Jun 20 Oct 20 - Jun 21

IT's that simple.                                                                                                         Analyst presentation 09/21 (2) |   2
IT's that simple. Analyst Presentation September 2021
Excellent Half-Year Results Continued in Q3

▪ Development of DATAGROUP market units exceeds
  expectations
▪ Start-up of new customer systems and, in part,
  significant upselling into existing customers lead to
  strong organic growth (9.6 %)
  ▪ 17 new customers
  ▪ 40 contracts renewed
  ▪ 24 contracts expanded
▪ Guidance confirmed:
  Revenue > € 440m and EBITDA > € 61m

IT's that simple.                                         Analyst presentation 09/21 (2) |   3
IT's that simple. Analyst Presentation September 2021
Selected Profit and Loss Statement Figures Q1-Q3 20/21

 Figures in € k                                           Q1-Q3 19/20   Q1-Q3 20/21   Change
 Revenue                                                    264,243       330,825      25.2%     ▪ Significant improvement of
 Other own work capitalized                                  724           1,303       80.0%       profit margins
 Changes in capitalized contract costs                       5,437        -1,048      -119.3%    ▪ Q1-Q3 19/20 were
 Total revenues                                             270,404       331,080      22.4%       adversely affected by
    Material expenses / Expenses for purchased services     89,556        116,673      30.3%       delayed start-ups and risk
 Gross profit                                               180,848       214,407      18.6%       provisioning, which had a
    Personnel expenses                                      139,531       154,322      10.6%       one-time impact on the
 EBITDA                                                     25,522        46,983       84.1%       reference value
    EBITDA margin (in %)                                      9.7          14.2        46.4%
 EBIT                                                        3,641        21,662      494.9%
    EBIT margin (in %)                                        1.4           6.5       364.3%
    Financial result                                        -1,940        -1,509       -22.2%    To this end, provisions had been set up on June
                                                                                                 30, 2020 in the total amount of € 12.0m which
 EBT                                                         1,701        20,153      1,084.8%   were offset by other operating income due to a
                                                                                                 negative difference from the purchase price
 Net income                                                  1,989        16,088      708.8%     allocation (badwill) of some € 10m from the
 EPS (in €)                                                                                      acquisition of Portavis. Further, operating losses
                                                             0.24          1.93       704.2%
                                                                                                 of some € 12m were handled.

IT's that simple.                                                                                     Analyst presentation 09/21 (2) |            4
IT's that simple. Analyst Presentation September 2021
Selected Balance Sheet Ratios Q1-Q3 20/21

 Figures in € k                                                    30.06.20                 30.06.21       Change
 Goodwill                                                           64,027                  108,586        69.6%    ▪ Equity ratio improved
 Non-current liabilities                                           194,267                  215,936        11.2%      despite increase in balance
      thereof liabilities to banks                                  77,948                   78,009         0.1%      sheet total through URANO
      thereof leasing liabilities                                   42,241                   40,022        -5.3%      and dna acquisitions
      thereof pension provisions                                    68,472                   68,892         0.6%    ▪ Significant increase in
 Current liabilities                                               121,513                  130,284         7.2%      equity ratio
      thereof liabilities to banks                                  12,535                    4,853        -61.3%
      thereof leasing liabilities                                   14,021                   17,337        23.7%
 Cash and cash equivalents                                          66,096                   49,970        -24.4%
 Trade receivables                                                  42,658                   50,937        19.4%
 Trade payables                                                     17,882                   15,776        -11.8%
                                                                                                                    URANO Informationssysteme GmbH and dna
 Total net debt                                                     61,771                   86,884        40.7%    Gesellschaft für IT Services GmbH have been
                                                                                                                    included in the consolidated financial statements
 Equity ratio1) (in %)                                                18.3                    19.8          8.2%    for the first time as per 1.5.21. The purchase
                                                                                                                    price allocations drawn up for this purpose have
 Return on equity2) (in %)                                            3.7                     28.3         669.6%
                                                                                                                    not been conclusively processed and reviewed
 Balance sheet total                                                                        431,769        11.8%    yet. The acquired assets and liabilities were
                                                                   386,078
                                                                                                                    subject to a preliminary assessment.
1) Modified equity ratio incl. equity-like intruments   2) Return on equity = net income /average equity

IT's that simple.                                                                                                        Analyst presentation 09/21 (2) |           5
IT's that simple. Analyst Presentation September 2021
Cash Flow Q1-Q3 20/21

 Figures in k€                          Q1-Q3 19/20      Q1-Q3 20/21     Change     Erläuterungen
 Cash flow from operating activities   13,619,038.75    40,720,131.87    199.0%    ▪ Substantially improved cash
                                                                                     flow due to strongly improved
                                                                                     net income
                                                                                   ▪ Improved working capital
                                                                                     management frees up cash

 Cash flow from investing activities   20,852,464.89    -39,365,771.33   -288.8%   ▪ Capex were reduced to € 5.6m
                                                                                     after € 14.9m in the prior-year
                                                                                     period
                                                                                   ▪ € 35m cash outflow for
                                                                                     acquisitions

 Cash flow from financing activities   -15,744,580.98   -15,292,619.24    -2.9%    ▪ Tranche of promissory note of
                                                                                     € 12m paid

 Change in cash and cash equivalents   18,726,922.66    -13,938,258.70   -25.6%

IT's that simple.                                                                     Analyst presentation 09/21 (2) |   6
IT's that simple. Analyst Presentation September 2021
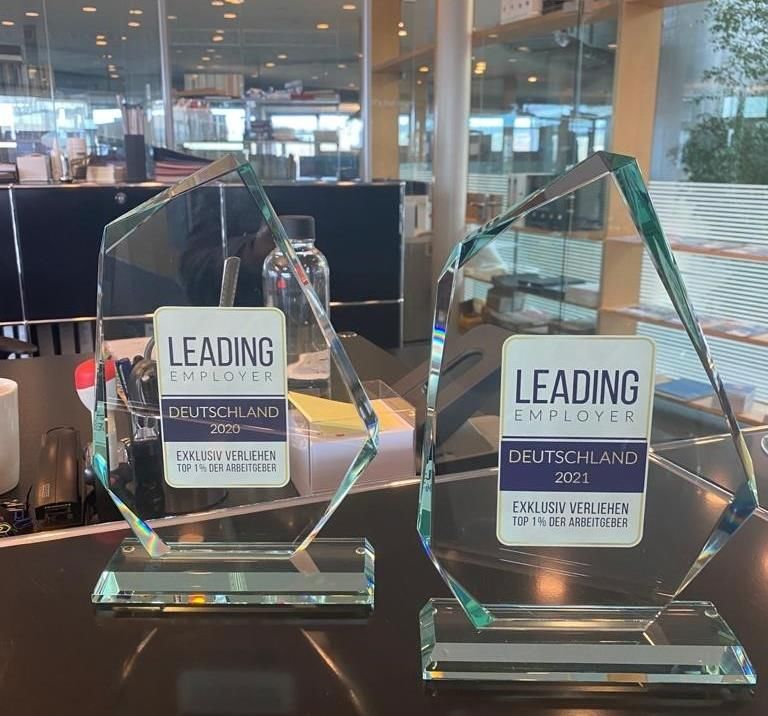
Digitalisation on the Rise: Good Order Intake With AI as well as
Automation and Mobilisation of Business Processes

                                                                                                         Additional contracts for the
                                                                                                         development of innovative
                                                                                                         AI-based services, e.g.
                                                                                                         ▪ Recogniton of bills for
                                                                                                           bonus programs with
                                                                                                           smartphone app
                                                                                                         ▪ Recognition of handwritten
                                                                                                           text on forms
                                                                                                         ▪ Recognition of custom
                                                                                                           documents for the
                                                                                                           automation of Brexit
Contract prolongation (Telco)   New order intake (Retail)            New order intake (Bank)               procedures
Robotic Process Automation      Mobile App for Contactless Cashier   Development of Software Robot for
Platform                                                             Backoffice Processes
ca. 2.0m €                      ca. 1.2m €                           ca. 0.6m €

IT's that simple.                                                                                           Analyst presentation 09/21 (2) |   7
IT's that simple. Analyst Presentation September 2021
Digitalisation on the Rise: Sparda Bank Counts on Almato as
Partner

„The cooperation with the team has been outstanding. Our high expectations on the solutions and the
targets related have been fully met.“
Michael Lichtner, Head of production, Sparda Bank Baden-Württemberg

Realization and support for property   Development of service app for       Automation of backoffice processes      Development and support of
portal with innovative AI services     banking customers with integration   based on the DATAGROUP Robots-          customer self service centers for
based on AWS public cloud              of innovative fintech services       as-a-Service-Platform (private cloud)   mortgages

IT's that simple.                                                                                                      Analyst presentation 09/21 (2) |   8
IT's that simple. Analyst Presentation September 2021
IT just works.
Optimally Positioned to Meet Market Requirements
IT's that simple. Analyst Presentation September 2021
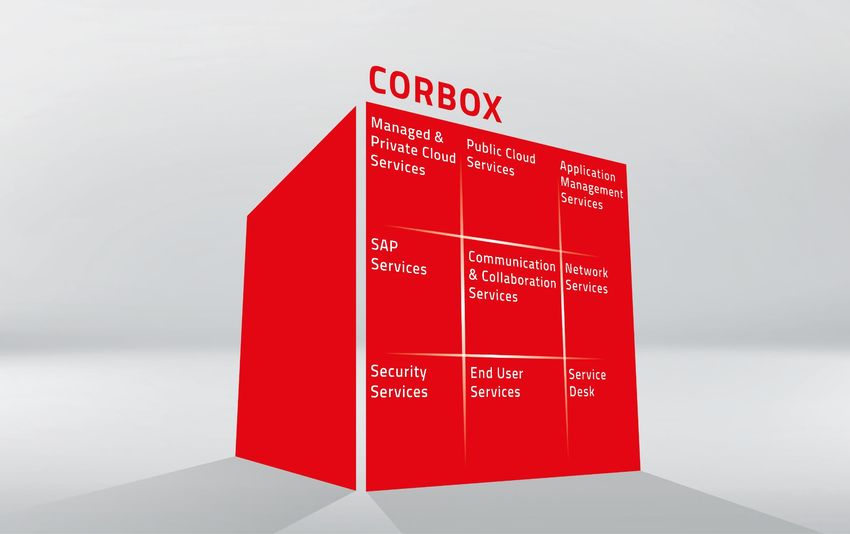
Leading IT-Service Provider in Germany (Source Lünendonk)

▪ Full service offering for IT and cloud services
▪ For companies with 100 – 5.000m € annual
  revenue as well as institutions
▪ Around 3,500 employees exclusively in Germany
▪ Close to our customers across Germany
▪ Competent contact at eye level
▪ Innovative Service-as-a-Product approach with
  CORBOX service suite

IT's that simple.                                           Analyst presentation 09/21 (2) | 10
Strong Growth in Recurring Revenues
With High Margin Services Accelerates in 20/21

Revenues 10/11 – 20/21(e) in €m                                                                                      82% gross margin 19/20
                                                                                            > 440                    through recurring revenue
450

400                                                                                 358.2

350                                                                         306.8

300                                                                 272.1

                                                            223.1                                    Recurring
250                                                                                  232             revenue
                                                    174.9                   188
200                         156.9           157.6
                                    152.4                            165
                    146.2
150    108.6                 37
                                                            125                                                      ■ Recurring Cloud Services
                                                     76
                                                                                                                     ■ Recurring Non-Cloud Sevices
                     32              42      57
100                                                                          25      33
         24                                                          34
                                                                                                                     ■ One time services
                     56      63      57                      32              28                      Non-recurring
                                             45      39                              40
         34                                                          23                              revenue
 50       9          15      16                              24
                                                     21
         42          43      41
                                     15
                                     38
                                             19
                                             37      39      42      50      66      53                              ■ Trade + Others
  0
        10/11       11/12   12/13   13/14   14/15   15/16   16/17   17/18   18/19   19/20 20/21(e)                   Fiscal Year 01.10 – 30.09.

IT's that simple.                                                                                                        Analyst presentation 09/21 (2) |   11
Development of EBITDA

EBITDA 10/11 – 20/21(e) in €m                                          EBITDA margin 10/11 – 19/20 in %

                                                                                              > 61
     CAGR 10/11 – 20/21(e): > 26.1%                                                 15.0%              16%
                                                                            15.3%
60                                                                                  53.81
                                                                             46.9                      14%
                                                            12.1%   12.6%
                                                    10.9%                           11.6               12%
45
                                                                             7.1
                                            9.7%                    34.5
                                                                                                       10%

                                                             27.0    0.8
                             6.9%   6.8%                                                               8%
30                  6.5%
       5.5%
                                                    19.1     4.4                                       6%
                                            15.3
15                   9.5
                            10.8    10.3
                                                     3.1                                               4%    ■ One-off effects out of
        6
                                                                                                                 acquisitions
                                                                                                       2%
                                                                                                             ■ EBITDA margin
 0                                                                                                     0%    1
      10/11         11/12   12/13   13/14   14/15   15/16   16/17   17/18   18/19   19/20   20/21(e)          Before risk provisions
                                                                                                             Fiscal Year 01.10 – 30.09

IT's that simple.                                                                                                Analyst presentation 09/21 (2) | 12
Development of EBIT

EBIT 10/11 – 20/21(e) €m                                                     EBIT Margin 10/11 – 19/20 in %     DATAGROUP realized
                                                                                                                extraordinary purchase
                                                                                                                price bargains over the
45                                                           8.3%                                          9%
     CAGR 10/11 – 20/21(e): 22.5 %                                                                              past five years
                                                                     7.5%       7.7%                       8%
                                                     7.2%
                                                                                                           7%
                                             6.1%                                                29.02
                                                                                       5.91
30                                                                                                         6%
                                                                                23.7
                                                                                        21.01              5%
                                                                      20.4      0.6
         3.4%                                                18.6     0.8                                  4%
                             2.8%
                                    3.2%
                                                              3.7
                                                                                                                ■ One-off effects out of
15                  2.6%                             12.7                                                  3%       acquisitions
                                              9.6                                       11.6
                                                      3                                                    2%   ■ EBIT margin
        3.7          3.8     4.3    4,84.8                                                                      1 Before
                                                                                                           1%            risk provisions
                                                                                                                2Consensus Bloomberg
 0                                                                                                         0%
       10/11        11/12   12/13   13/14    14/15   15/16   16/17   17/18     18/19    19/20   20/21(e)          as of 31.08.21
                                                                                                                Fiscal Year 01.10 – 30.09.

IT's that simple.                                                                                                   Analyst presentation 09/21 (2) | 13
EBIT Target

                    ▪ Medium-term EBIT target: 9%
                    ▪ Measures to achieve the objective
                     ▪ Reduction of capex and depreciation (AfA)
                     ▪ Absolute and relative reduction in rental expenses
                       and depreciation (AfA) due to significant reduction
                       in office space as a result of the Covid pandemic.
                     ▪ Profitabilisation of currently underperforming
                       subsidiaries DG FIS and DG Ulm
                     ▪ Focus on asset-light companies in the future

IT's that simple.                                   Analyst presentation 09/21 (2) | 14
Growth Strategy
DATAGROUP Grows Stronger Than the Market

                                                                                       ▪ Bitkom expects market
                                                                                         growth of 4.0%
    28% Telco Services                                  41                               compared to 2020 and
                                                                     23% IT Services     thus significant recovery
                              49
                                                                                         after Corona-related
                                                                                         decline
                                   ITC Market Germany                                  ▪ Average sales growth of
                                      € 178.2bn p.a.                                     14.2% since 10/11 at
                          7                                                              DATAGROUP
                                                             33
           4% Telco
                              12
         Infrastructure
                                    9                                19% IT Hardware
 6% Telco End Devices                      28

                                                                                       in € bn
                    5% Consumer Electronics                  15% Software              Source: Bitkom, July 2021

IT's that simple.                                                                          Analyst presentation 09/21 (2) | 15
Our Full Service Offer for Companies as USP

                                              ▪ “Service-as-a-Product”
                                                replaces “time-and-
                                                material”
                                              ▪ Modular offering for
                                                care-free IT
                                              ▪ Economies of scale
                                                through industrial
                                                production
                                              ▪ ISO 20000 certified
                                                (TÜV Süd)

IT's that simple.                                Analyst presentation 09/21 (2) | 16
1. On the Basis of Standardization
Factory Manufacturing of IT Operations

                                         ▪ Provision according to
                                           industrial standards on
                                           the basis of defined
                                           roles, processes and
                                           procedures
                                         ▪ Standardization as a
                                           basis for automation and
                                           efficiency gains
                                         ▪ DATAGROUP as cloud
                                           enabler

IT's that simple.                           Analyst presentation 09/21 (2) | 17
2. On the Basis of Data Centers in Germany in Colocation

                               Advantages of colocation strategy:
                               ▪ Maximum security
                               ▪ Perfect connectivity to public cloud
                               ▪ Geo redundancy
                               ▪ Less capex
                               ▪ Highest flexibility and scalability
                               ▪ Highest level of standardization
                                ▪ ISO 20000
                                ▪ ISO 27001

IT's that simple.                                                       Analyst presentation 09/21 (2) | 18
3. On the Basis of DATAGROUP Production Model
                                                              Virtually centralized
                                                              supply units

                                       Market units           ▪ Efficiency gains / cost
                                                                control
                                       Customers
                                                              ▪ Automation
                                       Central supply units

                                       New locations
                                                              ▪ Public cloud integration
                                                              ▪ Scalability / capacity for
                                                                growth
                                                              Local presence ensures
                                                              ▪ Eye height
                                                              ▪ Proximity
                                                              ▪ On-site services
                                                              ▪ Sales success

IT's that simple.                                                Analyst presentation 09/21 (2) | 19
CORBOX Guarantees Recurring Revenues

Sample Customer                                           Contract phase 2                        ▪ Recurring revenues with
Revenue in € m
                                                                                                    CORBOX are extended
                                                                                                    by additional services
1,5                  Contract phase 1
                                                                                                    over time
                                                                                                  ▪ Average contract
                                                                                                    duration ca. 4.5 years
 1

                                                                                                  ■   Projects
0,5
      Transition
                                                                                                  ■   Increased delivery level
                                                                                                      of services
                                                                                                  ■   CORBOX upselling

 0
                                                                                                  ■   CORBOX basic contract
        year 0      year 1     year 2   year 3   year 4    year 5      year 6   year 7   year 8       (fix volume)

IT's that simple.                                                                                     Analyst presentation 09/21 (2) | 20
Strong Order Intake with CORBOX

Engineering                         Automotive                   Financial service provider   Research
End User Services                   Managed Cloud, AMS, SAP      Full Outsourcing             AMS, SAP
3 (+1+1) years, ca. € 6.0m / year   5 years, ca. € 8.5m / year   2 years, € 1.5m / year       2 years, ca. € 1.9m / year

                                                                                              and many more…

                                                                                               ▪ No cluster risk
                                                                                               ▪ No sector risk
Public hand                         Building industry            Exhibition company
Public Cloud, End User Services     Full Outsourcing             Full Outsourcing              ▪ Hardly any economic risk
4 years, ca. € 0.6m / year          5 years, ca. € 0.6m / year   6 years, ca. € 3.5m / year

IT's that simple.                                                                                Analyst presentation 09/21 (2) | 21
DATAGROUP Again Top 3 in Customer Satisfaction

                          NTT Data      84%
                                                                                      ▪ Among 850 evaluated
                                TCS     84%
                      DATAGROUP         82%                                             IT out- and cloudsourcing
                             Deloitte   82%                                             contracts
                         Capgemini      77%
                               Wipro    76%                                           ▪ 21 evaluated IT service
                             Bechtle    75%
                          Accenture     74%
                                                                                        providers
                             Infosys    74%
                                Atos    73%                                           ▪ Top 3 with top ranks in:
                                HCL     73%
                                PwC     72%                                             ▪ Cloud capability (rank 1)
                     Computacenter      72%
                      Ernst & Young     71%                                             ▪ Innovation (rank 1)
                                 CGI    69%
                         T-Systems      69%                                         ▪ Business understanding
                                 IBM    68%
                                                                Average in customer
                                                                                      (rank 2)
                          Cognizant     67%
                                                                satisfaction = 72 %
                        Sopra Steria    65%                                           ▪ Best in customer loyalty
                              Fujitsu   58%
                    DXC Technology      57%
                                                                                      Source: IT Outsourcing Study Germany 2020
                                    40% 45% 50% 55% 60% 65% 70% 75% 80% 85%           by Whitelane Research and Navisco AG

IT's that simple.                                                                         Analyst presentation 09/21 (2) | 22
Brand eins and Statista Rank DATAGROUP
Among the Best IT Service Providers in 2021

IT Security                                                         ■■■■
Cloud Services                                                      ■■■□
Training                                                            ■■■■
Network & Storage                                                   ■■■□
Software Implementation & Maintenance                               ■■■□
Communication and Collaboration                                     ■■■□
Managed Services & Outsourcing                                      ■■■■
Hardware Implementation & Maintenance                               ■■■■
IT Consulting                                                       ■■■■
Total                                                               ■■■■

■ More than 5,500 experts and customers rank 230 companies in 10 criteria

IT's that simple.                                                           Analyst presentation 09/21 (2) | 23
Collecting Top Marks as Employer

                                   ▪ “Top Employer Diversity”
                                     Stern in cooperation with Statista, 05/2021
                                   ▪ “Germany’s best employers 2021”
                                     Stern in cooperation with Statista, 01/2021
                                   ▪ “Best employer 2020“
                                     Focus Business in cooperation with kununu, 02/2020
                                   ▪ “Leading Employer Germany 2020“
                                     Die Zeit, 01/2020
                                   ▪ “Germanys most innovative work places“
                                     Hamburgisches Weltwirtschaftsinstitut, 01/2020
                                   ▪ “Most attractive IT service provider 2020“
                                     FAZ Institute, 01/2020
                                   ▪ “Germany‘s best employers“
                                     Die Welt, 08/2019
IT's that simple.                                                  Analyst presentation 09/21 (2) | 24
Dual Growth Strategy

Anorganic vs. Organic Growth – Ambition
                                                                  ▪ Growth through new customer acquisition
225
                                                                   ▪ Market potential: around 5,000 potential CORBOX
                                                                     customers in the segment of 100 – 5,000m € revenue
  1/3
                                                                     p.a. in Germany

175
                                                                  ▪ Growth from upselling existing customers
                                                                   ▪ Ca. 10m € increase p.a.
                                                           2/3

125
                                                                  ▪ Growth from M&A activities
                                                                   ▪ 2-3 new acquisitions per year on average
■ Anorganic growth
■ Organic growth from upselling existing customers
75
■ Organic
     14/15 growth through
              15/16       new customer
                       16/17   17/18     acquisition
                                         18/19    19/20   20/21

IT's that simple.                                                                                Analyst presentation 09/21 (2) | 25
Scenarios incl. Acquisitions and Upselling
Growth Always in Line With Projections

Revenues €m                                                                     Ambition by 22/23:
500                                                                             ▪ > 15% EBITDA
                                                                                ▪ > 9% EBIT
400
                                                                                by 25/26:
                                                                                ▪ € 750m revenue
300

200
                                                                                ■ min. CORBOX revenues
                                                                                ■ max. CORBOX revenues
100
                                                                                ■ realized revenues
                                                                                ■ other revenues except CORBOX
  0
          13/14      14/15   15/16   16/17   17/18   18/19   19/20   20/21(e)   Fiscal Year 01.10 – 30.09.

IT´s that
IT's  that simple.
           simple.                                                                  Analyst presentation 09/21 (2) | 26
M&A-History

Messerknecht                 Arxes                        Consinto                      ikb Data                     Portavis
(120 employees), Oct. 2006   (380 employees), Apr. 2010   (350 employees), Feb. 2012    (72 employees), Aug. 2017    (200 employees), Mar. 2020

Hamann und Feil              Ptecs                        Excelsis                      ALMATO                       Cloudeteer
(20 employees), Oct. 2007    (50 employees), Oct. 2010    (50 employees), Oct. 2014     (40 employees), Jan. 2018    (29 employees), June 2020

EGT IS und ICP               BGS                          Vega                          UBL
(40 employees), Jan. 2007    (120 employees), Jan. 2011   (120 employees), Aug. 2015    (70 employees), Apr. 2019

Corporate Express            DATAGROUP IT Solutions       HP Enterprise
(20 employees), Nov. 2007    (20 employees), Sept. 2011   (306 employees), Sept. 2016

Best Computer Support        DATAGROUP Consulting                                                                    dna GmbH
(30 employees), Jan. 2008    (10 employees), Sept. 2011                                                              (104 employees), Apr. 2021

Hanseatische Datentechnik    PC-Feuerwehr                                               IT-Informatik                URANO Informationssysteme
(150 employees), Jan. 2008   (10 employees), Jan. 2012                                  (300 employees), Aug. 2019   (300 employees), May 2021

bte bürotechnik eggert                                    HanseCom                      Mercoline
(10 employees), July 2008                                 (70 employees), May 2017      (60 employees), Aug. 2019

IT's that simple.                                                                                                    Analyst presentation 09/21 (2) | 27
Realized Purchase Price Multiples

Company                   Price of       Multiples at date     Company                           Price of              Multiples at date
(Years of acquisition:   acquisition      of acquisition       (Years of acquisition:           acquisition             of acquisition
2006 – 2021)                (net)                              2006 – 2021)                        (net)
                            In k€      EBITDA          EBIT                                         In k€           EBITDA           EBIT
Company 1                  1,460        1.8             2.1    Company 15                          19,649             4.1             4.9
Company 2                   869         2.9             3.0    Company 16                           5,758             4.6             5.4
Company 3                   280         1.4             1.9    Company 17                          -6,147
Company 4                   282         3.5             4.7    Company 18                            -54              -0.1            -0.1
Company 5                    0          2.0             2.0    Company 19                           9,906             2.2             5.5
Company 6                   289         1.5             1.5    Company 20                           6,829             6.6             7.3
Company 7                  13,199       4.7             4.9    Company 21                          16,617             5.0             6.3
Company 8                    0          3.0             3.0    Company 22                           1,575             3.8             5.2
Company 9                   477         2.7             2.4    Company 23                           1,500             3.0             6.0
Company 10                  436         1.2             2.0    Company 24                          -19,049
Company 11                 1,031        1.1             1.1    Company 25                           7,950             4.5             4.5
Company 12                 5,710        8.3             8.4    Company 26                          50,800             6.1             6.2
Company 13                  898         5.2             5.5    Multiples average                                      3.4             4.1
Company 14                  247
                                                              Prices are rising; Maximum paid until now: 8.4 times EBIT
                                                              Further acquisitions in pipeline
IT's that simple.                                                                                             Analyst presentation 09/21 (2) | 28
Our Recent Aquisitions:
1. URANO Informationssysteme GmbH

                    ▪ Participation agreement to acquire 70% of the shares in URANO
                      Informationssysteme GmbH and a purchase option for the remaining 30% of the
                      shares after two years.
                    ▪ URANO provides IT services with around 300 employees and is active both in the
                      private sector and for the public sector.
                    ▪ The company looks back on 30 years of experience in the field of IT services and
                      has been a reliable partner for the public sector in Hesse and Rhineland-Palatinate
                      for many years.
                    ▪ The takeover creates a classic win-win situation:
                     ▪ Through CORBOX, URANO expands its portfolio to include, among others, SAP
                       and security services.
                     ▪ DATAGROUP strengthens its presence in Hesse and Rhineland-Palatinate and
                       adds interesting solutions to its portfolio, e.g. in the school sector.

IT's that simple.                                                               Analyst presentation 09/21 (2) | 29
Our Recent Aquisitions:
2. dna GmbH

                    ▪ Acquisition of 100% of the shares in dna Gesellschaft für IT Services mbH which is
                      based in Hamburg, Berlin, Hannover, and Oldenburg.
                    ▪ dna is specialized in service provision for IT infrastructures and IT applications,
                      particularly for banks and financial service providers.
                    ▪ Beyond providing IT administration services, dna also offers industry-specific
                      professional assistance, consultation on integration processes, implementation of
                      new systems and support in software development processes.
                    ▪ In combination with DATAGROUP Financial IT Services and Portavis there is
                      significant synergy potential in the provision of services for our customers from the
                      banking and financial services sector.
                    ▪ dna currently has 104 employees and generates revenues in the high single-digit
                      million € ranges in the current fiscal year.

IT's that simple.                                                                  Analyst presentation 09/21 (2) | 30
IT’s worth it.
Share Information

                    Anhang
DATAGROUP Share vs. Indices and Peer Group

                                                                                                                    Ratings
In %                                                                                                                Berenberg
                                                                                       € 78.50 (Status: 27.08.21)   77.00€, Buy
6,500                                                                                                               Stifel Europe
         ■   DATAGROUP share
                                                                                                                    86.00€, Buy
6,000
         ■   All for One
5,500
         ■   Cancom
                                                                                                                    M.M. Warburg Research
                                                                                                                    86.00€, Buy
5,000
         ■   Bechtle *
4,500
         ■   TecDAX                                                                                                 Baader Helvea
                                                                                                                    53.00€, Sell
4,000
         ■   DAX
3,500                                                                                                               Quirin Private Bank
3,000                                                                                                               88.50€, Buy
2,500                                                                                                               Hauck & Aufhäuser
2,000                                                                                                               88.00€, Buy
1,500                                                                                                               Landesbank Baden-Württemberg
1,000                                                                                                               Hold
 500                                                                                                                Edison
    0                                                                                                               Qualitative analysis
      2009     2010 2011           2012 2013       2014   2015   2016   2017   2018   2019     2020      2021
      * Share split in the ratio 1:3 as of 16.08.2021
IT's that simple.                                                                                                      Analyst presentation 09/21 (2) | 32
Consensus Estimate of Our Analysts

 Figures in €m                                    20/21   21/22   22/23
 Revenues                                         446.3   486.8   516.2
   Change in comparison to previous year (in %)   24.6     9.1     6.0
 EBITDA                                           63.2    72.0    79.1
   EBITDA margin (in %)                           14.2    14.8    15.3
 EBIT                                             29.0    36.3    42.9
    EBIT margin (in %)                             6.5     7.5     8.3
 Earnings after taxes (EAT)                       18.7    23.2    27.2
    EAT margin (%)                                 4.2     4.8     5.3

                                                                          Source: Bloomberg as of 31.08.21

IT's that simple.                                                             Analyst presentation 09/21 (2) | 33
Our Commitment to the Environment, Social Affairs and
Corporate Governance

                                     ▪ Publication of an ESG report for the first time
                                     ▪ We give insight into our leitmotifs and principles of
                                       sustainable business management, our activities for
                                       the protection of the environment and selected social
                                       projects that support our employees

                                      „As a company, we see ourselves as part of society. We
                                                are responsible for our employees, customers,
                                       investors and fellow human beings. We want to live up
                                           to this responsibility, both internally and externally."

                                                                       Max H.-H. Schaber, CEO

IT's that simple.                                                       Analyst presentation 09/21 (2) | 34
Management Share Purchases Underline Share Price Potential

                    Date       Notifiable person   Function            Type of         Amount in €                Pcs.
                                                                       transaction

                    28.01.20   Andreas Baresel     Board Member        Buy                   45,360                700

                    12.03.20   Hubert Deutsch      Supervisory Board   Buy                    4,255                100

                    23.03.20   Max Schaber         CEO                 Buy                 399,230              10,000

                    14.10.20   Max Schaber         CEO                 Buy                 234,999               5,000

                    17.10.20   Andreas Baresel     Board Member        Buy                   17,500                400

                    18.10.20   Andreas Baresel     Board Member        Buy                   70,300              1,600

                    18.11.20   Dirk Peters         Board Member        Sell               9,046,452            196,662

                    18.11.20   Max Schaber         CEO                 Buy                9,046,452            196,662

                    20.11.20   Dirk Peters         Board Member        Sell                368,000               8,000

                    20.11.20   Andreas Baresel     Board Member        Buy                 368,000               8,000

IT's that simple.                                                                    Analyst presentation 09/21 (2) | 35
Shareholder Structure and Stock
                                                                               Key Investment Data
              4.1
                                                                               ▪ Total number of shares: 8,349,000
                                                                               ▪ Capital stock:             8,349,000.00 €

225                               53.9                                         Trade Data:
42
                                             ■ HHS Beteiligungsges. mbH        ▪ Stock market segment: Open Market under inclusion in the segment Scale of
                                               (Max H.-H. Schaber)                                     the Frankfurt Stock Exchange

                                             ■ Executives / Advisory Board /   ▪ Stock market abbr.:
                                                                               ▪ WKN:
                                                                                                            D6H
                                                                                                            A0JC8S
                                               Management
175                                                                            ▪ ISIN:                      DE000A0JC8S7
                                             ■ Free float                      ▪ Stock market locations: Frankfurt, XETRA, Stuttgart, Munich,
                                                                                                         Düsseldorf, Berlin-Bremen
 Investor                                                       Percent %      ▪ Designated Sponsor:        Hauck & Aufhäuser Privatbankiers AG, HSBC
 Universal Investment                                             1.54                                      Trinkaus & Burkhardt AG
 TaaleriTehtaan Rahas                                             0.96
125
 Metzler Global Funds                                             0.68
                                                                               IPO
                                                                               ▪ Initial public offering:   14. September 2006
 Allianz SE                                                       0.60
                                                                               ▪ Issue price:               3.20 €
 Deutsche Bank AG                                                 0.59
 Union Investment                                                 0.59         Share
 KBC Group NV                                                     0.51         ▪ Share value:               78.50 € (27.08.21)
 75
 Societe14/15
         de Gestion
                 15/16    16/17      17/18      18/19   19/20     0.48
                                                                   20/21       ▪ Market Cap:                655.4m € (27.08.21)
* Hauck & Aufhäuser - Report, August 2021
IT's that simple.                                                                                                                 Analyst presentation 09/21 (2) | 36
Upcoming Events

                    ▪ 06.-07.09.21   Equity Forum German Fall Conference 2021
                    ▪ 20.-22.09.21   Berenberg German Corporate Conference
                    ▪ 12.-13.10.21   CF&B Paris Conference
                    ▪ 22.-24.11.21   Deutsches Eigenkapitalforum, Frankfurt
                    ▪ 23.11.21       Publication of the preliminary figures for the fiscal year 20/21
                    ▪ 06.-09.12.21   Berenberg European Conference

IT's that simple.                                                                      Analyst presentation 09/21 (2) | 37
Contact Information

                      Claudia Erning
                      Investor Relations

                      T +49 7127 970 015
                      M +49 160 968 98171
                      Claudia.Erning@datagroup.de

                      DATAGROUP SE
                      Wilhelm-Schickard-Straße 7
                      72124 Pliezhausen
                      datagroup.de

                                                    Analyst presentation 09/21 (2) | 38
IT’s that promising.
Appendixes
Management Board

                    Max H.-H. Schaber                                             Andreas Baresel
                    Chief Executive Officer, responsible for Finance, Human       Board Member, responsible for Supply Units & Production
                    Resources and Company Strategy
                                                                                  Member of the Management Board (CPO) of DATAGROUP
                    Since Feb. 16, 2006 Mr. Schaber has been a member and         SE since October 2018. He is responsible for the Production
                    Chairman of the Executive Board (CEO) of DATAGROUP            department. In this role, he oversees the cross-divisional
                    SE and is responsible for the departments Finance, Legal      management and coordination of the individual service
                    Affairs, Human Resources and Company Development.             factories within the group.
                    In 1983 he founded DATAPEC, Company for Data                  Following his studies in business administration, Andreas
                    Processing, which later became DATAGROUP GmbH. Max            Baresel worked in several management positions with a focus
                    H. H. Schaber studied mechanical engineering at the           on business and portfolio development in IT consulting and
                    University of Stuttgart as well as at the Universities of     managed IT services.
                    Applied Sciences in Augsburg and Reutlingen. In 1981 he
                                                                                  Andreas Baresel joined the company in 2006 in connection
                    completed his studies as graduate engineer (FH) in
                                                                                  with the acquisition of DATAGROUP Business Solutions
                    Mechanical Engineering and after that he was employed
                                                                                  GmbH (previously Consinto GmbH) and has been Managing
                    initially as system engineer, and later as assistant to the
                                                                                  Director of DATAGROUP Business Solutions GmbH since
                    Executive Board of the firm Friedrich und Co. Company for
                                                                                  2016.
                    Software and System Development.
                    Dirk Peters                                                   Peter Schneck
                    Board Member, responsible for Sales                           Board Member, responsible for Investor Relations,
                                                                                  Mergers & Acquisitions and Legal
                    Since the integration of the company HDT in DATAGROUP
                    in the year 2008, Dirk Peters is Managing Director of         Peter Schneck joined the Executive Board of DATAGROUP on
                    DATAGROUP Hamburg GmbH (formerly HDT) and active in           01.10.2019. His responsibilities include Investor Relations,
                    the management of DATAGROUP SE as COO.                        Legal and Mergers & Acquisitions.
                    Upon completion of his studies of computer science (FH),      After studying law with a focus on International Business Law
                    he took over managerial positions at Ashton-Tate and at       and an MBA, Peter Schneck worked as Managing Director at
                    ALSO ABC, until he went into business for himself in the      Scheidt & Bachmann, a leading global provider of IT solutions
                    year 1992 with his firm HDT Hanseatic Data Systems            for car park management. Subsequently, he was managing
                    Technology. Out of a classical system house he then deve-     director of the parking garage operator APCOA.
                    loped a high-performance group of companies in the field of
                                                                                  Prior to joining DATAGROUP, Peter Schneck was CEO of the
                    IT service management. Following his training as an infor-
                                                                                  Trapeze Group, a transportation company owned by the
                    mation electronics engineer at Lufthansa, Dirk Peters began
                                                                                  Canadian company Constellation. In addition to the
                    his career in 1981 as system technician at one of the first
                                                                                  operational management of Trapeze, Peter Schneck has
                    authorized IBM contractual partners, the firm Computer-
                                                                                  managed an international portfolio of companies and was
                    partner in Hamburg. In 1983 he changed over to the sales
                                                                                  responsible for the mergers & acquisitions activities.
                    department and learned the trade at HOSS.

IT's that simple.                                                                       Analyst presentation 09/21 (2) | 40
Supervisory Board

                    Heinz Hilgert                                                           Dr. Carola Wittig
                    Chairman of the Supervisory Board                                       Member of the Supervisory Board
                    CEO and founder of TransVise GmbH, Senior Management                    Presiding Judge at the District Court in Stuttgart.
                    Consulting in the financial services industry.
                                                                                            Alongside her activities at the District Court in Stuttgart, Dr.
                    Before that Mr. Hilgert was CEO of the WestLB in Düssel-                Wittig works as a lecturer at various research institutes for
                    dorf und Deputy CEO of the DZ Bank in Frankfurt. His areas              specialist lawyers, engineers and appraisers. Prior to joining
                    of responsibility included investment banking, private                  civil service, Dr. Wittig worked as a lawyer at Arthur
                    banking and asset management. He held corporate man-                    Andersen Wirtschaftsprüfer Steuerberater GmbH in
                    dates as chairman of the supervisory board of Union Asset               Stuttgart and Dresden. She was responsible for company
                    Management Holding AG, Frankfurt; DZ Privatbank                         law and tax matters in the context of restructurings,
                    Switzerland AG, Zurich; DZ Bank International S.A, Luxem-               acquisitions and MBOs. During her legal activity, Dr. Wittig
                    burg; and Teambank AG, Nuremberg. Before his positions                  also gained experience in IT contract law.
                    at the DZ Bank, Mr. Hilgert held executive positions at Sal.
                                                                                            Dr. Carola Wittig studied law at the Eberhard Karls
                    Oppenheim KGaA, Cologne and Frankfurt as well as at the
                                                                                            Universität in Tübingen.
                    Chase Manhattan Bank N.A., London und Frankfurt. Mr.
                    Hilgert studied business administration at the University of
                    Duisburg.

                    Hubert Deutsch
                    Deputy Chairman of the Supervisory Board
                    CEO of BLANK Holding GmbH, an international industrial com-
                    pany specialized in investment casting.
                    He previously worked as CFO for various companies of the
                    Liebherr Group, amongst others as managing director of the
                    construction machinery division and most recently in the
                    household appliance industry. Hubert Deutsch graduated in
                    business administration (Diplom-Betriebswirt) with a focus on
                    bank and financial management. Following graduation, he also
                    worked as a lecturer at the SRH Mobile University in Riedlingen
                    and the Baden-Württemberg Cooperative State University.
                    Additionally, he holds advisory positions at various start-ups and is
                    Chairman of the University Council of the SRH Mobile University
                    in Riedlingen. He is involved in voluntary work as initiator and
                    Chairman of the Foundation Board of the ProKeeper Akademie
                    and is a member of the Supervisory Board of the Ravensburg
                    football club.

IT's that simple.                                                                                 Analyst presentation 09/21 (2) | 41
Disclaimer

This presentation has been produced by DATAGROUP SE with the sole purpose of providing decision support for the recipient.
This presentation is no prospectus and in no way is intended to be an offer or solicitation to purchase or subscribe to corporate shares or other securities.
This presentation has been produced to the best of our knowledge. However, DATAGROUP assumes no responsibility for the correctness and completion of the
statements explicitly or implicitly made in this presentation. This also applies to any other written or oral statement, which was made to the interested recipient or her/his
consultants. Any liability is expressly excluded.
This presentation contains statements, estimates and projections related to the expected future development. They are based on different assumptions made by the
management of DATAGROUP SE in relation to the expected results and may prove to be true or false depending on the actual development. We assume no liability for the
correctness of these statements. The statements made in this presentation represent only a selection and are therefore not exhaustive. Extensions, modifications or
adjustments are explicitly subject to change. DATAGROUP SE assumes no liability for the correctness of figures and estimates taken from publicly accessible sources that
have been explicitly marked.
This presentation is confidential and may not be redistributed in whole or in part to third parties.
Under no circumstances should employees, representatives, agents, consultants, customers or suppliers of DATAGROUP SE be contacted without prior agreement.

IT's that simple.                                                                                                                          Analyst presentation 09/21 (2) | 42
You can also read