PT Sri Rejeki Isman Tbk - Company Presentation October 2019 - Sritex
←
→
Page content transcription
If your browser does not render page correctly, please read the page content below

Strictly Private and Confidential

PT Sri Rejeki Isman Tbk
Company Presentation
October 2019
Disclaimer
    By attending the meeting where this presentation is made, or by reading the presentation materials, you agree to be bound by the following limitations:

    THIS PRESENTATION IS BEING PRESENTED TO YOU SOLELY FOR YOUR INFORMATION AND MAY NOT BE REPRODUCED, REDISTRIBUTED OR PASSED ON, DIRECTLY OR
    INDIRECTLY, TO ANY OTHER PERSON OR PUBLISHED, IN WHOLE OR IN PART, FOR ANY PURPOSE.

    This presentation has been prepared by PT Sri Rejeki Isman Tbk (the “Company”) solely for use in presentations by the Company at investor update meetings. This presentation may
    contain forward looking statements that involve risk and uncertainties. Actual future actions may differ materially from those expressed in forward looking statements as a result of a number
    of risks, uncertainties and assumptions. You are cautioned not to place undue reliance on these forward-looking statements, which are based on the current views of management on
    future events.

    The information contained in this presentation (the “Information”) has been provided by the Company based on its data or, with respect to market data, industry data and other industry
    statistics, derived from public or third-party sources and has not been independently verified. No representation or warranty express or implied is made as to, and no reliance should be
    placed on, the fairness, accuracy, completeness or correctness of the Information or opinions contained herein. It is not the intention to provide, and you may not rely on this presentation
    as providing, a complete or comprehensive analysis of the Company’s financial or trading position or prospects. The Information and opinions in these materials are provided as at the date
    of this presentation and are subject to change without notice. None of the Company nor any of its respective affiliates, advisers or representatives shall have any liability whatsoever (in
    negligence or otherwise) for any loss howsoever arising from any use of this Information or otherwise arising in connection with the presentation.

    This presentation contains financial information regarding the businesses and assets of the Company and its consolidated subsidiaries. Such financial information may not have been
    audited, reviewed or verified by any independent accounting firm. The inclusion of such financial information in this document or any related presentation should not be regarded as a
    representation or warranty by the Company, any of its affiliates, advisers or representatives or any other person as to the accuracy or completeness of such information’s portrayal of the
    financial condition or results of operations of the Company and should not be relied upon when making an investment decision.

    This presentation does not constitute an offer or invitation to subscribe for or purchase any securities, in any jurisdiction, and nothing contained herein shall form the basis of any contract or
    commitment whatsoever. No money, securities or other consideration is being solicited, and if sent in response to this presentation or the Information contained herein, will not be accepted.
    The information in this presentation is an overview and does not contain all information necessary to an investment decision. It does not take into account the investment objectives,
    financial situation or particular needs of any particular investor. Any decision to purchase securities in the context of a proposed offering, if any, should be made on the basis of information
    contained in the offering memorandum published in relation to such an offering. The Company makes no recommendation to investors regarding the suitability of an investment in its
    securities, and the recipient of this presentation must make its own assessment and/or seek independent advice on financial, tax, legal and other matters, including the merits and risks
    involved in making an investment in a proposed offering, if any.

    This presentation will not be distributed or passed on in Indonesia or to Indonesian citizens, nationals, corporations or residents, in a manner which constitutes a "public offering" of
    securities under Indonesian Law No. 8 of 1995 on Capital Markets and its implementing regulations.

    The distribution of this document in other jurisdictions may be restricted by law and persons into whose possession this presentation comes should inform themselves about, and observe,
    any such restriction. Any failure to comply with these restrictions may constitute a violation of the laws of any such other jurisdiction.

    The information contained herein is preliminary, limited in nature and subject to completion and amendment. All opinions and estimates included in this presentation speak as of the date of
    this presentation (or earlier, if so indicated in this presentation) and are subject to change without notice. Neither the Company nor any of its affiliates, advisers or representatives make any
    undertaking to update any such information subsequent to the date hereof.

    This document contains certain “forward-looking statements.” These statements can be recognized by the use of words such as “expects”, “plan”, “will”, “estimates”, “projects”, “intends” or
    words of similar meaning. All such forward-looking statements are subject to certain risks and uncertainties that could cause actual results to differ materially from those contemplated by
    the relevant forward-looking statement. Such forward-looking statements are made based on management’s current expectations or beliefs as well as assumptions made by, and
    information currently available to, management. Caution should be taken with respect to such statements and you should not place undue reliance on any such forward-looking statements.

    This Information is strictly confidential and must not be copied, reproduced or distributed (in whole or in part) to any other person at any time without the prior written consent of the
    Company. Any failure to comply with this restriction may constitute a violation of U.S. or other national securities laws.

1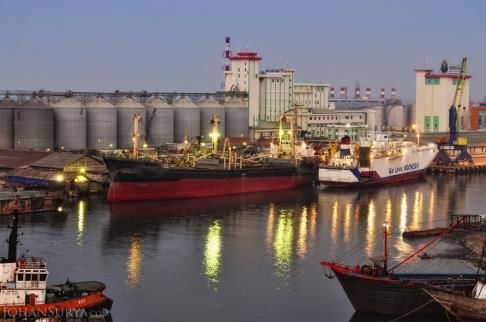
Table of Contents

    1. Company Overview

    2. Key Company Highlights

    3. Key Financial Highlights

    4. Indonesia Textile Industry

    5. Appendix

       A. Company Strategy

2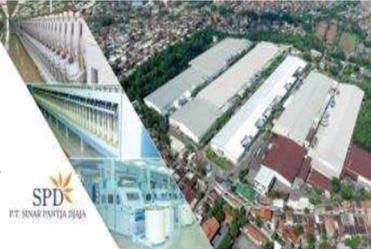
1. Company Overview

3
Sritex — A Leader in Southeast Asia’s Textile Industry
Sritex is one of the largest vertically integrated textile companies in Southeast Asia, with operations
across Spinning, Weaving, Finishing and Garment manufacturing, located in Central Java, Indonesia.
Company Overview Business Segments (1H 2019)
One of the largest vertically-integrated textile garment companies in Spinning
Southeast Asia Capacity: 1,100,000 bales per year
Product portfolio comprises yarn, greige, fabric, military and Sales: US$254m
corporate uniforms and fashion clothing Gross Profit Margin: 11.5%
Strong and diversified customer base with presence in over 50
countries
Established by the Lukminto family with history dating back to 1966; Weaving
headquartered in Sukoharjo, Central Java, Indonesia and listed on Capacity: 170 - 200 million meters1 per year
the Indonesia Stock Exchange since June 2013 Sales: US$41m
Strong reputation with numerous awards and accreditations: Gross Profit Margin: 16.0%
ISO 9001:2008 & ISO 14001:2015 Certified Company
1H2019 Sales Breakdown Finishing
By Segments By Geography2 Capacity: 240 million yards per year
Sales: US$169m
USA &
Garment
Europe
South Gross Profit Margin: 25.4%
9.1%
26.7% Spinning America
40.2% 8.1%
Asia
36.1% UAE &
Africa Garment
6.2%
Capacity: 30 million pieces per year
Australia Sales: US$169m
0.2%
Gross Profit Margin: 29.3%
Finishing Weaving Domestic
26.7% 6.4% 40.3%
Note:
1. Varies depending on the thickness of the greige product.
2. Based on Interim Financial Statements.
4 Company Overview
Key milestones – A Long History of Growth and
      Successes
    1966                                              2014                              2016                               2018
    Founded by H.M. Lukminto                          Issued                            Issued US$350m                     Acquired BIS and                 Sales by segment and total EBITDA1
    as a traditional trading                          US$270m 9.00%                     8.25% Senior                       PMJ for US$85m                   (US$m)
    company in Pasar Klewer,                          Senior Notes                      Notes due 2021
    the textile center market in                      due 2019                          and tender offer
    Solo, Central Java                                                                  for all of US$270m                                                                             1,034
                                                                                        9.00% Senior
                                                                                        Notes due 2019                                                                    759
                                                                                                                                                               680                                            632
                                                                                                                                                                                                   539
       1992                                  2006
       Achieved vertical                     Iwan S. Lukminto                                                                                                  135        163          189
                                                                                                                                                                                                   99         128
       integration with                      appointed as
       production capacity in                President Director
       4 business segments                                                                                                                                    2016       2017          2018      1H2018    1H2019
       (Spinning, Weaving,
       Finishing, Garment)                                                                                                                                           Yarn                          Greige
                                                                                                                                                                     Finished Fabric               Garments
                                                                                                                                                                     EBITDA

                                                                                                                                                            Sales by geographic area

                                                                                                                                                            (US$m)

                                                                                                                 2017                                                                  1,034
                                                                            2013                                 Issued US$150m
                                                                                                                                                                          759
                                                                                                                 6.875% Senior Notes                           680                                            632
                                                                            Listing on the                       due 2024                                                                          539
                                                                            Indonesia Stock
                                                                            Exchange

                                                                                                                 2019                                         2016       2017          2018      1H2018    1H2019
    1968                            1982                            1993                                         Entered into a US$350m syndicated
                                                                                                                 loan facility to partially refinance          Domestic                        Asia
    First finishing                 First weaving                   Won first military uniform
    plant established               factory (1,000                  contracts (supplier to                       US$175m of Senior Notes due in                Europe                          USA & South America
    in Solo                         machines)                       NATO, German army)                           2021 and refinance bilateral cash             UAE & Africa                    Australia
                                                                                                                 facilities

      Note:
      1. EBITDA defined as profit for the period, before finance charges, finance income, income tax expense, depreciation expense and negative goodwill.

5      Company Overview
Shareholding Structure

    Sritex Shareholding Structure1

                          Founder Shares2                                               PT Huddleston Indonesia2                            Public

                                       1.08%                                                        59.03%                                      39.89%

                                                                                      PT Sri Rejeki Isman Tbk
                                                                                                                          Indonesia Singapore

                               99.90%                                              99.99%                            99.99%                           100.0%

             PT Sinar Pantja Djaja                                      PT Bitratex Industries          PT Primayudha Mandirijaya       Golden Legacy Pte. Ltd.3

                                                                                                                                                      100.0%

                                                                                                                                             Golden Mountain
                                                                                                                                       Textile and Trading Pte. Ltd.

    Note:
    1. As of 30 June 2019.
    2. Beneficially owned by Lukminto family.
    3. Issuer of 8.25% Senior Notes due 2021 and 6.875% Senior Notes due 2024.

6   Company Overview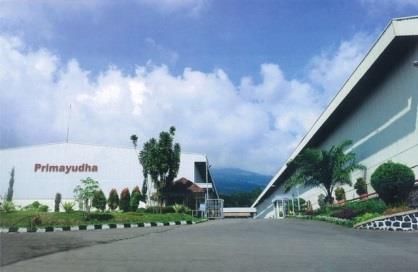
2. Key Company Highlights

7
Key Company Highlights

                     1       One of the largest vertically integrated textile manufacturers in Southeast Asia

                               2     Strategically located production facilities

                                     3     Superior product quality and broad product portfolio

                                     4     Large and diversified customer base with high customer loyalty

                                      Strong financial profile with proven track record of consistent and
                                5     profitable growth

                     6       Experienced management team with proven track record

8   Key Company Highlights
1 One of the Largest Vertically Integrated Textile
Manufacturers in Southeast Asia
Sritex’s vertically integrated business model allows it to offer full solutions to clients supported by
economies of scale, consistent high quality, shorter leadUp-stream
times, enhanced operational
Mid-stream
and cost efficiency.
Down-stream
Up-stream Mid-stream
Up-stream Down-stream
Mid-stream Down-stream
Up-stream Mid-stream Down-stream
Textile Value Chain
Cotton, Cotton, Cotton,
Cotton,
Rayon, Spinning
Rayon, Weaving Rayon,Finishing
Spinning WeavingSpinning
Rayon,
Garment
FinishingWeaving Spinning
Garment Finishing WeavingGarment Finishing Garment
Polyester Polyester Polyester Retail Retail Retail Retail
Upstream Polyester Midstream Downstream
Fiber Yarn Fiber Greige Yarn FiberFabricGreige YarnGarment FiberGreige Garment
Fabric Yarn Fabric Greige
Garment Fabric Garment
Fibre
Spinning Weaving Finishing
(Cotton, Rayon, Garment Retail
(Yarn) (Greige) (Fabric)
Polyester)
Contracts with
RUM1 will
potentially allow
Sritex to reduce
its reliance on
imports
170m – 200m meters3 /
Capacity2 1,100,000 bales / year 240m yards / year 30m pieces / year
year
Key Advantages of Integrated Business Model
Allows Sritex to
Achieves Competitive
Allows Price Volatility to be Monitor Each Step of
Pricing by Spreading
Passed through to Production Process,
Profits and Costs Across
Customers Ensuring Consistency of
Value Chain
Product Quality
Note:
1. Refers to PT Rayon Utama Makmur.
2. Refers to capacity as of December 2018 and 30 June 2019.
3. Varies depending on the thickness of the greige product.
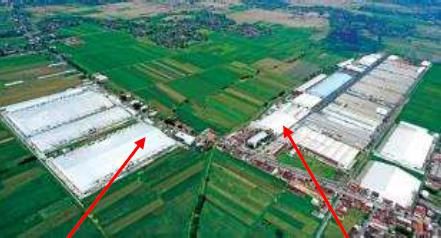
9 Key Company Highlights2 Strategically Located Production Facilities
Close proximity and excellent infrastructure connectivity between Sritex’s production facilities and the port which
supports supply chain efficiencies, while availability of a large pool of low cost and skilled labour allows Sritex to
maintain its cost competiveness
SPD Facilities Area: ~18ha
Tanjung Emas
International Port, Pati
Jepara
Semarang
Brebes Rembang
Pekalongan Kendal Semarang Kudus
Slawi Kajen Blora
Ungaran Purwodadi
West Java
Purbalingga Wonosobo Central Java
Purwokerto Boyolali
East Java
Banyumas
Sukoharjo
Kebumen
DI Yogyakarta Sritex Facilities Area: ~61ha
Proximity to Tanjung Emas: ~124 km
Regional Minimum Wage Comparisons
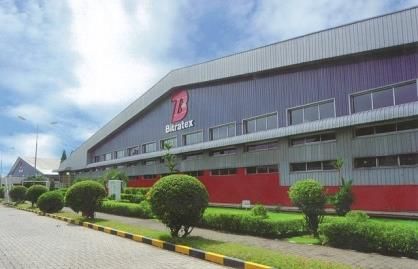
BIS Facilities Area: ~24ha (US$ per month)
1
Sukoharjo (Central Java) 123
Indonesia 110 277
Vietnam 160 181
China 197 308
Cambodia 170
Malaysia 261
PMJ Facilities Area: ~22ha Thailand 302 324
50 100 150 200 250 300 350
Note: Source: Philippines Department of Labor and Employment as of August 30, 2019.
1. According to a decision letter of the Governor of Central Java, the monthly minimum wage in Sukoharjo, Central Java was Rp.1,783,500 effective January 1, 2019.
10 Key Company Highlights3 Superior Product Quality and Broad Product Portfolio
Sritex offers a broad product portfolio and is able to cater to customers’ individual design interests
and preferences.
Comprehensive Product Portfolio Operating Performance
Spinning Weaving Finishing Apparel < 1% of sales subject to claims of defects
or returned1
< 1% goods were delivered late1
0 unplanned production stoppage
Major supplier of Greige renowned for High-quality fabric Leading partner in
high quality yarn for its excellent standard with reputable brand supplying military and
major textile and high quality within a competitive corporate uniform Production runs 24/7, 365 days2
customers globally fashion industry as well as leading
international
ISO 9001:2015 for quality management
fashion players
Specialized and Tailored R&D Design Process ISO 14001:2015 for environmental control
Design and R&D Team
Pattern/Material
Print Process Planning
Selection/Creation
Work out appropriate
Allows customer to
Customer dyes and printing
choose from in-house Production
Order process
design database
Test prints done to
Creates new design
ensure accuracy
for customer
Note:
1. For the period ended 30 June 2019.
2. Except during the Eid Mubarak holiday and when production facilities are under overhaul maintenance.
11 Key Company Highlights4 Large and Diversified Customer Base with High
Customer Loyalty
The company has a large and diverse customer base which minimizes reliance on any single customer
or geographic market.
Diversified Geographic Presence Diversified Product Offering
(1H2019 Sales Split) (1H2019 Sales Split)
Australia
UAE & Africa 0.2%
USA & South 6.2%
America Garment
8.1% 26.7%
Domestic
40.3% Spinning
Europe
40.2%
9.1%
Asia
Finishing Weaving
36.1%
26.7% 6.4%
Comprehensive Global Customer Network Long Track Record of Customer Relationships
Products sold domestically in Indonesia and internationally in over 50 countries Sritex has a long history with many of its key
Military uniforms sold to more than 30 countries since inception customers, including the Indonesian military
(since 1990) and Indonesian National Police
Europe (since 1990)
Obtained certification to supply military uniforms
to the armed forces of Germany and certain other
Asia Pacific NATO countries
Americas
Middle East
Africa
12 Key Company Highlights5 Strong Financial Profile with Proven Track Record of
Consistent and Profitable Growth
Sales Gross Profit and Gross Profit Margin
(US$m) (US$m)
22.6% 20.2%
1,034 21.4% 18.5%
17.8%
759 184
171
680 632 145
539 128
100
2016 2017 2018 1H2018 1H2019 2016 2017 2018 1H2018 1H2019
EBITDA and EBITDA Margin Net Profit and Net Profit Margin
(US$m) (US$m)
8.7% 9.0% 8.2% 10.3% 8.6%
19.9% 21.5% 18.3% 18.4% 20.3%
189
163
85
135 128 68
99 59 54
56
2016 2017 2018 1H2018 1H2019 2016 2017 2018 1H2018 1H2019
Note:
Margins are based on Sales. EBITDA defined as profit for the period, before finance charges, finance income, income tax expense, depreciation expense and negative goodwill.
13 Key Company Highlights5 Strong Financial Profile with Proven Track Record of
Consistent and Profitable Growth (cont’d)
Total Sales Contribution by Segment
(US$m) Gross profit margin
Sales CAGR by segment
(2016-18) (1H2019)
1,034
24% +18.6% 29.3%
759
680
26% 24% 632 +19.3% 25.4%
26% 539
27%
7%
26% 23%
+3.6% 16.0%
26%
27%
23%
10%
10% 8% 6%
45% +33.5% 11.5%
38% 39% 47% 40%
2016 2017 2018 1H2018 1H2019
Spinning Weaving Finishing Garment
14 Key Company Highlights6 Experienced Management Team with Proven
Track Record
Senior management team with an average of over 20 years of experience led by President Director, Iwan Setiawan
Board of Commissioners Board of Directors
Hj. Susyana Lukminto Iwan Setiawan Lukminto Karunakaran
President Commissioner President Director Ramamoorthy
Production Director
Megawati B. Lukminto Iwan Kurniawan Allan M. Severino
Commissioner Lukminto Finance Director
Vice President Director
Prof Ir Sudjarwadi Arief Halim Mira Christina Setiady
M.Eng, Ph.D Marketing Director General Affair and
Independent Administrative Director
Commissioner
Alpino Kianjaya Eddy Prasetyo Salim Dr M Nasir Tamara
Independent Operation Director Tamimi
Commissioner Independent Director
A Professional and Dedicated Workforce
Large base of 19,458 employees as of June 30, 2019
International team of experienced designers, sales managers and productions managers from
Indonesia, South Korea, India and Philippines
Adherence to stringent labour practices and factory condition requirements of sophisticated
international customers
Close working relationship with the workforce and investing in employees through training, a
culture of excellence and involvement in Corporate Social Responsibility (“CSR”) activities
15 Key Company Highlights3. Key Financial Highlights 16
Gross Profit (“GP”) by Segment
Gross Profit Margins (“GPM”) across the Spinning, Weaving, Finishing, and Garment businesses have
been relatively stable over the years.
Spinning GP and GPM Weaving GP and GPM Sales and GPM
(US$m) (US$m) (US$m) Decline in GPM in 2018 driven by 30.0%
higher sales contribution from
spinning division post-acquisition of
13.0% 13.4% 11.5% 18.0% BIS and PMJ in April 2018
8.1% 17.1% 22.6%
15.6% 16.0% 21.4%
20.2%
17.8% 20.0%
39 38 13
34 12 12
29
6
1,034
10.0%
2016 2017 2018 1H2019 2016 2017 2018 1H2019 245
Finishing GP and GPM Garment GP and GPM 759
0.0%
(US$m) (US$m) 680
27.4% 199 250 632
25.4% 33.4%
25.0% 24.3% 31.6%
30.1% 29.3% 174
169
61 74 -10.0%
53 74 194
66
44 43 176
55
49 169
74
69
41 -20.0%
464
261 292 254
2016 2017 2018 1H2019 2016 2017 2018 1H2019
-30.0%
2016 2017 2018 1H2019
Note:
Segment information based on Audited Annual Report and Interim Financial Statements; Margins are based on Sales.
17 Key Financial HighlightsSales and Cost Breakdown
Sales Breakdown (2017) Sales Breakdown (2018) Sales Breakdown (1H2019)
Domestic Domestic
39.7% 40.3%
Domestic
46.7%
Export
53.3% Export
Export
60.3% 59.7%
Cost Breakdown (2017) Cost Breakdown (2018) Cost Breakdown (1H2019)
Selling
Selling expenses Selling
expenses 1.7% expenses
2.0% 1.5%
G&A G&A Raw G&A
expenses Raw expenses materials expenses Raw
3.9% materials 3.6% 73.8% 3.3% materials
Direct 83.5% 75.1%
Direct
labour and Direct labour and
overheads1 labour and overheads1
10.5% overheads1 20.0%
20.9%
Note:
1. Represents other COGS (excluding raw materials used).
18 Key Financial HighlightsRobust Balance Sheet
Total Assets Cash and Cash Equivalents
(US$m) (US$m)
1,435
1,364 137
127 128
1,193
947
$61
2016 2017 2018 1H2019 2016 2017 2018 1H2019
Total Equity Total Interest Bearing Debt1
(US$m) (US$m)
773
565 721
516 654
442 568
331
2016 2017 2018 1H2019 2016 2017 2018 1H2019
Note:
1. Total Interest Bearing Debt refers to Short-term bank loans, Current maturities of long-term debts, Long-term bank loans, Medium-term notes and Notes payable–net.
19 Key Financial HighlightsSignificant Investment Over the Years While Maintaining
a Robust Capital Structure
CAPEX Spent
(US$m)
84
4
67 37 35
25
7 37 35
13 17
2016 2017 2018 1H2019
Maintenance Expansion Payment of advances for fixed assets
Debt/EBITDA Ratios1 Interest Coverage Ratios2
4.2x
4.0x
3.8x 3.8x 3.0x
3.5x 2.9x
3.2x 3.1x
2.9x
2.7x
2.6x
2016 2017 2018 1H2019 2016 2017 2018 1H2019
Total Debt/EBITDA Net Debt/EBITDA EBITDA Interest Coverage Ratio
Note:
1. Total Debt / EBITDA = Total interest bearing debt / EBITDA.
2. EBITDA Interest Coverage Ratio = EBITDA / Interest expense.
EBITDA defined as profit for the period, before finance charges, finance income, income tax expense, depreciation expense and negative goodwill.
20 Key Financial Highlights4. Indonesia Textile Industry 21
Indonesia’s Textile Industry – Key Updates
Industry Outlook Update Indonesia Textile Exports (July 2018 – July 2019)
Indonesia’s textile industry remains in a healthy condition, with (US$m)
exports value targeted to grow to up to US$14.6bn by end of 2019 1,263 1,243
1,199 1,229 1,233
1,104 1,124
1,073 1,056 1,050 1,068
The industry’s prospects remain strong, with the IA-CEPA1 and EU- 1,014
CEPA2 bilateral trade agreements currently in their respective 829
finalization phases
As part of his recent “Vision for Indonesia” speech in July 2019,
Indonesia’s President Joko Widodo specifically highlighted the
country’s manufacturing and labor-intensive industries as an area of
focus, and laid out plans to develop the nation’s human resources to
support sustainable growth
Jul-18 Sep-18 Nov-18 Jan-19 Mar-19 May-19 Jul-19
Industry Regulations Update Indonesia Textile Imports (July 2018 – July 2019)
On August 6, 2019, Indonesia’s Minister of Finance Sri Mulyani (US$m)
Indrawati imposed anti-dumping duty on the import of spin drawn
yarn (SDY) from China
The amount of anti-dumping import duty varies from 5.4% to 15%, 803 817
758
813 806
766
depending on the company that exports its products to Indonesia 713 680 699
641 641
567 567
The imposition of this import duty was partly fueled by the results of
an investigation by the Indonesian Anti-Dumping Committee which
concluded that dumping was carried out by producers and / or
exporters of producers originating from China
Jul-18 Sep-18 Nov-18 Jan-19 Mar-19 May-19 Jul-19
Source: Bank Indonesia, API Outlook 2019, CNN.
Note:
1. Refers to the Indonesia-Australia Comprehensive Economic Partnership Agreement.
2. Refers to the Indonesia-European Union Comprehensive Economic Partnership Agreement.
22 Indonesia Textile Industry5. Appendix 23
A. Company Strategy

24
Strategy Overview

                              1   Improve Production Efficiency and Reduce Costs

                                        Expand Product Offering to Focus on Higher Value
                                  2     Added Products

                              3   Expand Customer Base Network

25   Supporting Information
1 Improve Production Efficiency and Reduce Costs
Supported by modern production facilities and an integrated quality control system, Sritex has maintained the
quality of its production to the point where claims or sales returns amount to less than 1% of total sales.
Modern and Superior Production Equipment Integrated Quality Control Process
Quality control begins from the receipt of raw materials
Production machines used are machines made by leading
global manufacturers in Europe and Japan Each production process has the system of quality control to reduce the risk
of production errors
Production Planning and Inventory Control ("PPIC") performs a check on
Sritex will continue to invest in production machines in order to quality control process
keep itself current with latest technology
Comprehensive Quality Control at Every Stage of Production
Step 1: Yarn
Blowing, carding, drawing, roving, ring spinning, autowinding and inspection
Maintenance of Machines
Step 2: Greige
Machines maintained regularly on a daily, weekly, or monthly Warping, sizing, leaching, looming and inspecting
schedule as advised by the manufacturer
Step 3: Treated Greige
Singeing, de-sizing, slow-motion, scouring, mercerizing, setting and inspecting
Maintenance based on condition, and repaired if damaged
Step 4: Dye Fabric
Overhaul maintenance of entire production facilities performed Dyeing, fixing, steaming, washing, finishing and inspecting
annually on all facilities during Eid Mubarak holiday
Step 5: Print/Dye Fabric
Coating, printing, steaming, washing, finishing and inspecting
Step 6: Garment
Cutting, sewing, ironing and inspecting
Note:
1. As of June 30, 2019.
26 Supporting InformationExpand Product Offering to Focus on Higher Value
2
Added Products
The Company will increase its focus and production in higher value added products to generate
higher margins.
1H2019 Segment Gross Profit Margins1
29.3%
25.4%
16.0%
11.5%
Spinning Weaving Finishing Garment
Increasing focus on higher-value products
1H 2019 Gross 29.1 6.5 42.9 49.4
profit (US$m)
2018 Gross
37.6 11.6 60.9 73.7
profit (US$m)
2016 Gross
profit (US$m)2
33.9 12.5 43.9 55.1
Note:
1. Gross profit margins are based on Sales.
2. Based on Audited Annual Report.
27 Supporting Information3 Expand Customer Base Network
The Company will continue expanding its customer networks through the implementation of its
marketing strategies.
Marketing Strategy Geographical Mix1
1H2019 Sales
Participate in events and exhibitions relating to the textile
1 and clothing industry
Europe
Advertise in media publications and on Internet sites 9.1%
2 relating to the textile industry
USA & South
America
Asia 8.1%
Separate central marketing offices based on different
3 product groups
36.1%
UAE & Africa
6.2%
Use unique marketing strategies such as multi-products,
4 multi-customers and multi-countries
Australia
0.2%
Domestic
40.3%
Note:
1. Based on Interim Financial Statements.
28 Supporting InformationThank You
CLOTHING THE WORLD
Integrated Vertical Textiles – Garments Plant
an ISO 9001 & ISO 14001 Certified Company
JL. KH. Samanhudi 88 Jetis, Sukoharjo 57511, Solo, Central Java, Indonesia
(62-271) 593 188 | (62-271) 593 488 (Fax)
The Energy Building 20th Floor SCBD Lot. 11A
Jl. Jendral Sudirman Kav. 52-53, South Jakarta, Indonesia
(62-21) 2995 1619/1650 | (62-21) 2995 1621 (Fax)
29You can also read