FULL YEAR RESULTS PRESENTATION 2019 - Investor Relations

Page created by Ramon Joseph
 
CONTINUE READING
FULL YEAR RESULTS PRESENTATION 2019 - Investor Relations
2019
FULL YEAR
RESULTS
PRESENTATION
FULL YEAR RESULTS PRESENTATION 2019 - Investor Relations
MEDICLINIC INTERNATIONAL
DISCLAIMER

  This presentation contains certain forward-looking statements relating to the business of the Company and its subsidiaries,
  including with respect to the progress, timing and completion of the Group’s development; the Group’s ability to treat, attract and
  retain patients and clients; its ability to engage consultants and general practitioners and to operate its business and increase
  referrals; the integration of prior acquisitions; the Group’s estimates for future performance and its estimates regarding
  anticipated operating results; future revenue; capital requirements; shareholder structure; and financing. In addition, even if the
  Group’s actual results or development are consistent with the forward-looking statements contained in this presentation, those
  results or developments may not be indicative of the Group’s results or developments in the future. In some cases, forward-
  looking statements can be identified by words such as “could”, “should”, “may”, “expects”, “aims”, “targets”, “anticipates”,
  “believes”, “intends”, “estimates”, or similar. These forward-looking statements are based largely on the Group’s current
  expectations as of the date of this presentation and are subject to a number of known and unknown risks and uncertainties and
  other factors that may cause actual results, performance or achievements to be materially different from any future results,
  performance or achievement expressed or implied by these forward-looking statements. In particular, the Group’s expectations
  could be affected by, among other things, uncertainties involved in the integration of acquisitions or new developments; changes
  in legislation or the regulatory regime governing healthcare in Switzerland, South Africa, Namibia and the United Arab Emirates;
  poor performance by healthcare practitioners who practise at its facilities; unexpected regulatory actions or suspensions;
  competition in general; the impact of global economic changes; and the Group’s ability to obtain or maintain accreditation or
  approval for its facilities or service lines. In light of these risks and uncertainties, there can be no assurance that the forward-
  looking statements made in this presentation will in fact be realised and no representation or warranty is given as to the
  completeness or accuracy of the forward-looking statements contained in this presentation.

  The Group is providing the information in this presentation as of this date, and disclaims any intention to, and make no
  undertaking to, publicly update or revise any forward-looking statements, whether as a result of new information, future events or
  otherwise.

2019 FULL YEAR RESULTS PRESENTATION                                                                                                      2
FULL YEAR RESULTS PRESENTATION 2019 - Investor Relations
MEDICLINIC RESULTS
AGENDA

 INTRODUCTION                         Page 4

 OPERATIONAL REVIEW                   Page 7

 FINANCIAL REVIEW                     Page 16

 GROUP SUMMARY                        Page 26

 QUESTIONS AND ANSWERS                Page 32

 APPENDIX                             Page 33

2019 FULL YEAR RESULTS PRESENTATION
FULL YEAR RESULTS PRESENTATION 2019 - Investor Relations
INTRODUCTION

DR RONNIE VAN DER MERWE
CEO MEDICLINIC INTERNATIONAL
FULL YEAR RESULTS PRESENTATION 2019 - Investor Relations
MEDICLINIC FULL YEAR RESULTS
FINANCIAL SUMMARY
         2019 FULL YEAR RESULTS*

      Revenue                          EBITDA                    Operating profit                 Cash conversion

                                      4%         2% in CC                    11%               91% of adjusted EBITDA
        2%
     underlying
                                 EBITDA margin                            EPS                       Final dividend

                                      16.8%
                                                                                              4.70p per share maintained
                                                                             10%
            4% in CC                                                                              (total dividend 7.90p)

* Adjusted measures presented

Switzerland:               Significant tariff reductions and less favourable insurance mix; margin in line with guidance at 16.0%

Southern Africa:           Excellent operational performance; macro environment impacting volumes; stable margin at 21.2%

Middle East:               Increase in revenue and EBITDA; stable 13.0% margin including Parkview Hospital ramp-up loss

Spire (UK):                Performance impacted by weaker than expected patient volumes and investments in quality initiative

                Current trading in line with expectations; guidance remains unchanged

2019 FULL YEAR RESULTS PRESENTATION                                                                                                 5
FULL YEAR RESULTS PRESENTATION 2019 - Investor Relations
MEDICLINIC FULL YEAR RESULTS
OPERATIONAL SUMMARY

           Adapting Hirslanden to Swiss healthcare requirements
                  - All Swiss hospital operators affected by tariff reductions and outmigration
                  - Benefiting from actions taken to improve performance:
                          - Accelerated cost savings, driving efficiencies and revenue opportunities
                  - Advancing the day case delivery model in a cost-efficient manner
                  - Hirslanden 2020 benefits will support medium-term operating performance

           Continued delivery of operational excellence
                  - Macro environment impacting patient volumes
                  - Continued focus on efficiencies and investments to improve clinical quality
                  - Expanding across the continuum of care:
                       - Investments in Intercare and Welkom Medical Centre
                          - Opened Mediclinic Newcastle day case clinic - six more planned in FY20 and FY21

           Strategy yielding a period of sustained growth
                  - Leveraging strong brand and delivering internationally recognised clinical care
                  - Supported by successful investments and strategic expansion:
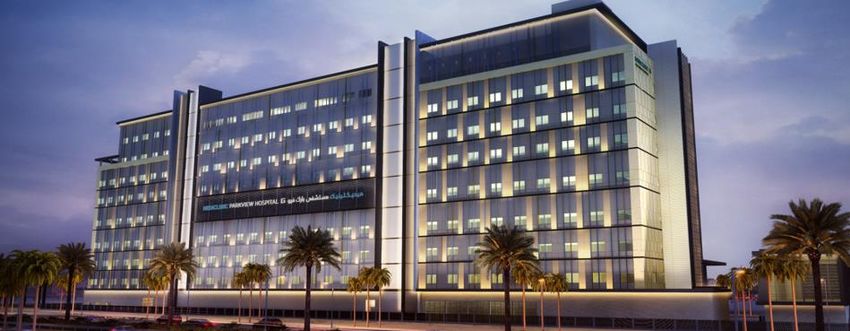
                          - Mediclinic Parkview Hospital opened in September; performing well
                          - Continued business and operational improvements in Abu Dhabi
2019 FULL YEAR RESULTS PRESENTATION                                                                           6
FULL YEAR RESULTS PRESENTATION 2019 - Investor Relations
OPERATIONAL
REVIEW

DR RONNIE VAN DER MERWE
CEO MEDICLINIC INTERNATIONAL
FULL YEAR RESULTS PRESENTATION 2019 - Investor Relations
OPERATIONS
                 HIRSLANDEN
OPERATIONS                                               OPERATIONAL OVERVIEW
                                                                                                           DAY CASE CLINICS
                                                                          HOSPITALS
       Largest Swiss private healthcare provider;                                                          2
       competitive mature market; comprehensive                           18                               OUTPATIENT CLINICS

       range of inpatient and outpatient services                                                          3
       delivered to an ageing population
                                                                          BEDS                             EMPLOYEES

       All Swiss hospitals operators affected by                          1 916                            10 442
       rapidly implemented regulatory change:
         - Outpatient tariff reductions (TARMED)
         - Outmigration of care - insurance mix change   INPATIENT INSURANCE MIX*

       Adapting to changes; benefiting from cost-        50%
                                                                  42.7%
       savings and efficiency initiatives                                        43.5%
                                                                                                             47.9%          48.7%
                                                                                               44.8%
                                                         40%
       New management team
                                                                 32.3%           31.9%        31.2%
       Hirslanden 2020 strategic programme:                                                                  29.7%          29.5%
                                                         30%
                                                                  25.0%                       24.0%
         - Standardise, centralise and simplify                                  24.6%
                                                                                                            22.4%           21.8%
         - Develop outpatient delivery models
                                                         20%
                                                                   FY15          FY16          FY17             FY18         FY19
       Combined La Colline with Les Grangettes in
                                                                                 General         Semi Private          Private
       Geneva; strengthens leading market position
                                                           * Includes Klinik Linde and Clinique des Grangettes
2019 FULL YEAR RESULTS PRESENTATION                                                                                                 8
FULL YEAR RESULTS PRESENTATION 2019 - Investor Relations
SWISS REGULATORY ENVIRONMENT
SIGNIFICANT TARIFF REDUCTIONS

                    TARMED                   OUTMIGRATION

  1      National day case and          1   Six clinical procedures specified
         outpatient tariff framework        by Federal Government

  2      Consists of around 4,000       2
                                            Transferred from inpatient to
         clinical treatment codes           outpatient tariff on 1 Jan 2019

  3      Hirslanden day case and        3   Early adoption in certain cantons
         outpatient revenue c.20% of        since 1 Jul 2017 with more
         divisional revenue                 extensive lists of 16 procedures

  4      Annualised c.CHF25m EBITDA     4   Attracting additional patients;
         impact in-line with guidance       impacting the insurance mix

                    IN THE BASE SINCE           FURTHER 9 MONTHS
                        1 JAN 2019           COMPARATIVE IMPACT IN FY20

2019 FULL YEAR RESULTS PRESENTATION                                           9
FULL YEAR RESULTS PRESENTATION 2019 - Investor Relations
HIRSLANDEN
BENEFITED FROM ACTIONS TAKEN

          ATTRACTING                  ✓ Maintained inpatient activity levels despite outmigration (ex. acquisitions)
           PATIENTS                   ✓ Continue to attract new doctors – net increase of 250 in FY19
        MAINTAINING                   ✓ IQM data benchmark exceeded by all Hirslanden hospitals
      CLINICAL QUALITY                ✓ Improved patient experience index
          IMPROVING
                                      ✓ Improved Gallup employee engagement score
          EMPLOYEE
         ENGAGEMENT                   ✓ Maintained training spend
         FOCUSING ON                  ✓ Focused on supply costs, employee efficiencies and general admin costs
            COSTS                     ✓ Delivered CHF21m savings compared to budget
                                      ✓ Offer care in most appropriate and efficient setting
       ADAPTING THE
      BUSINESS MODEL
                                      ✓ Opened 2nd day case clinic (St. Anna Im Bahnhof); open 2 more in FY20
                                      ✓ Implemented in-house day case optimisation plans
      REDUCING CAPEX                  ✓ FY19 Capex reduced to CHF95m

2019 FULL YEAR RESULTS PRESENTATION                                                                                    10
HIRSLANDEN
MEDIUM-TERM ACTIONS
SUPPORTING HIRSLANDEN'S OPERATING PERFORMANCE
     1       Advance the day case delivery model
                     •    Further optimise costs and processes; benefitting from experience in
                          Southern Africa and Middle East divisions
                     •    Evaluate opportunities to grow across the continuum of care
     2       Improve service differentiation across insurance categories
                     •    Continued insurance mix change partially offset by promotion of
                          supplementary insurance programmes
     3       Maintain doctor recruitment and referral initiatives
                     •    Enhance doctor network marketing programmes and GP referral networks
     4       Pro-active engagement with government and insurers

     5       Deliver Hirslanden 2020 cost savings and efficiencies
                     •    Standardised IT and back office systems – HIT2020
                     •    Corporate restructuring and efficiency improvements being delivered
                     •    Optimise length of stay in DRG environment
                     •    Project opex and capex investment costs peaking

2019 FULL YEAR RESULTS PRESENTATION                                                              11
OPERATIONS
                 SOUTHERN AFRICA
OPERATIONS                                            OPERATIONAL OVERVIEW
                                                                                 HOSPITALS
       Maintaining strong market position with an                                                                                     DAY CASE
                                                                                 52                                                   CLINICS
       excellent footprint across all provinces                                  SUB-ACUTE HOSPITALS
                                                                                                                                      8*
       Stable medical insurance membership of                                    5
       c.9m with an ageing population and                                        EMPLOYEES                                            BEDS
       increase in chronic diseases                                              15 804                                               8 517
       Patient volumes impacted by macro
       environment
                                                      BED NUMBERS AND OCCUPANCY
       Stable EBITDA margin supported by
       excellent operational performance                               9,000                                                               95%

                                                                                                                                                 BED OCCUPANCY RATE
                                                                                                                              8,517

                                                      NUMBER OF BEDS
       Investing across the continuum of care:                                              8,017        8,095      8,131
                                                                       8,000   7,885                                                       85%
         - Day case clinics and sub-acute hospitals
         - Digital platform and technology
       Continued investment in clinical services                       7,000   72.9%                                                       75%
                                                                                            71.5%        71.5%
                                                                                                                    69.7%    69.2%
       Health Market Inquiry and National Health
       Insurance review both ongoing; Mediclinic                       6,000                                                               65%
                                                                               FY15         FY16         FY17        FY18     FY19
       responses submitted
                                                                         Operational beds           Additional capacity     Bed occupancy rate

                                                               * Includes 4 Mediclinic and 4 Intercare day case clinics
2019 FULL YEAR RESULTS PRESENTATION                                                                                                               12
OPERATIONS
                 SOUTHERN AFRICA
         INVESTING ACROSS THE
           CONTINUUM OF CARE                                               Acute
                                                                   STRATEGIC RESPONSE #2
                                                                           Hospital

         Continue to see general
   1     trend of outmigration

         Investing across the continuum of
   2     care to capture patient growth
         outside of acute hospitals –            Patient
         Intercare group and Welkom                                                            Day Case
                                                 Facing                                         Clinics
                                               Technology:
         Co-location strategy to build day     AI Supported Care
   3     case clinics at key hospitals which     Tele Medicine
         aligns with requirements of             Mobile Health
         patients, doctors and insurers              Web

         Enhancing the efficiency of day
   4     case activities within hospitals                                  Related
                                                                          Business:
                                                                        Emergency Services
         6 more day case clinics opening in                                Primary Care
   5     FY20 and FY21                                                  Sub-Acute Hospitals
                                                                            Home care
                                                                        Specialist Hospitals
         Strategy supported by digital                                   Employer Clinics
   6                                                                      Mental Health
         platform and use of technology

2019 FULL YEAR RESULTS PRESENTATION                                                                       13
OPERATIONS
                 MIDDLE EAST
OPERATIONS                                                    OPERATIONAL OVERVIEW
                                                                                                         DAY CASE CLINICS
                                                                             HOSPITALS
       Well positioned to benefit from long-term                                                         2
       growth opportunities in the UAE; building on                          7                           OUTPATIENT CLINICS
       our leading market position in Dubai                                                              18
       Continuing to make steady progress;                                   BEDS                        EMPLOYEES
       embarking on period of sustained growth in                            926                         6 152
       revenue and EBITDA margin expansion
       Successfully opened Parkview Hospital in       57%     ABU DHABI INSURANCE MIX
       Dubai and integrated recent outpatient
       investments; reached peak capex phase          47%
                                                            43%                                                                       41%
                                                            41%                                                                       41%
       Actions taken in Abu Dhabi have set the                                                                                        40%
                                                      37% 38%                                                                         38%
       foundations for future growth; insurance mix         38%

       change enhancing the quality of revenue;
                                                      27%
       divested non-core assets                             21%
                                                                                                                                      21%

       Supporting new doctors to ramp up activity     17%
                                                            20%                                                                       19%

       in Abu Dhabi following recent investments in
       facilities, technology and rebranding          7%
                                                             1Q17 2Q17 3Q17 4Q17 1Q18 2Q18 3Q18 4Q18 1Q19 2Q19 3Q19 4Q19
                                                                  OP Thiqa               OP Basic Plan         OP Enhanced and Other
       Abu Dhabi hospital projects remain on track                IP Thiqa               IP Basic Plan         IP Enhance and Other

2019 FULL YEAR RESULTS PRESENTATION                                                                                                   14
OPERATIONS
                 MIDDLE EAST
        GROWTH DRIVERS

   1     Supporting doctors
         to ramp up activity          30% investment -
                                       Bourn Hall IVF
                                                                                                Mediclinic Airport Road
   2     Improving quality of          Acquisition of 2
         revenue through                MAF Clinics
         insurance mix change
                                          Mediclinic Al Noor Hospital
         Selective investments        renovation of ground and mezzanine –
   3
         and expansion across           completion by end December 2019
         the continuum of care
                                         182-beds             Mediclinic Airport Road                Mediclinic Al Noor
   4     Increasing acuity              Mediclinic         Hospital 100-bed expansion and
                                         Parkview          Comprehensive Cancer Centre –
                                      Hospital opened       completion during first half of
                                      September 2018             2020 calendar year
   5     Increasing occupancy

                                       Electronic Health Record rolled out by end of 2020
   6     Increased inpatient to                          calendar year                            Mediclinic Parkview
         outpatient activity ratio
                                             FY19              FY20             FY21
                                      FY18          FY19        FY20           FY21           FY22              FY23

2019 FULL YEAR RESULTS PRESENTATION                                                                                       15
FINANCIAL
REVIEW

JURGENS MYBURGH
CFO MEDICLINIC INTERNATIONAL
ADJUSTED GROUP
INCOME STATEMENT

£’m                                                                            FY19                 FY18         % CHANGE
Revenue1                                                                      2,932                 2,875                2%    • Revenue up 4% in constant
EBITDA                                                                           493                   515              (4%)     currency

             EBITDA margin                                                   16.8%                 17.9%                       • Switzerland performance
                                                                                                                                 impacted by changing regulatory
Depreciation and amortisation                                                  (163)                (145)               12%      environment and significant tariff
Operating profit                                                                 330                   370             (11%)     reductions

Net finance costs                                                                (57)                  (70)            (19%)   • Stable margins in Southern Africa
                                                                                                                                 and the Middle East
Taxation                                                                         (57)                  (64)            (11%)
                                                                                                                               • Continued focus on cost
Income from associates                                                                3                    3               -     management across all divisions
Non controlling interests                                                        (21)                  (18)             17%    • Depreciation increased due to
Earnings                                                                         198                   221             (10%)     continued investment
                                                                                                                               • Net finance costs benefited from
Earnings per share (pence)                                                      26.9                  30.0             (10%)     refinancing in all divisions

Dividend per share (pence)                                                      7.90                  7.90                 -   • Normalised effective tax rate of
                                                                                                                                 20.4% (FY18: 20.8%)
Weighted avg number of shares (m)                                             737.1                 737.1
                                                                                                                               • Proposed final dividend
                                                                                                                                 maintained at 4.70p
1 An   income statement reclassification increased Mediclinic Southern Africa FY18 revenue and cost of sales by £6m.

2019 FULL YEAR RESULTS PRESENTATION                                                                                                                                   17
GROUP REVENUE
ANALYSIS
                               2%                                            Hirslanden (47% of Group)
           2,875                          2,932
                                                                         • Inpatient volumes stable excl. Linde and Les
               1                            1
                                                                           Grangettes
            1,349                         1,368                          • Average revenue per admission down 2.2%
                                                                         • Up 2% in constant currency incl. acquisitions
                                                                    1%
                                                                             Southern Africa (30% of Group)
£’m

                                                                         • Patient volumes up 0.6% incl. Intercare
             882                           886                           • Revenue per bed day sold up 4.3%
                                                                         • Up 5% in constant currency
                                                                    1%
                                                                             Middle East (23% of Group)
                                                                    5%
             643                           677
                                                                         • Gradual improvement despite lack of tariff
                                                                           increases
            FY18                          FY19                           • Seasonally strong second half
                                                                         • Parkview ramp-up
        Switzerland     Southern Africa   Middle East   Corporate        • Up 4% in constant currency
                                                                         • Up 7% adjusting for IFRS 15

                                      FY19 revenue up 4% in constant currency

2019 FULL YEAR RESULTS PRESENTATION                                                                                     18
ADJUSTED EBITDA
 ANALYSIS
                                      4%                                        Hirslanden (44% of Group)
                515                                                        • Direct impact of reduction in average revenue
                                                 493
                                                                             per admission
                247                                                        • Partially mitigated by management actions
                                                 219                       • Down 10% in constant currency
                                                                     11%
                                                                                Southern Africa (38% of Group)
£’m

                                                                           • Good operational performance
                189                              187                       • Stable EBITDA margin due to disciplined cost
                                                                             management
                                                                     1%    • Up 4% in constant currency

                                                                                Middle East (18% of Group)
                                                                     7%
                    82                            88

                 -3                              -1                        • Abu Dhabi insurance mix benefits materialising
                FY18                            FY19                       • Includes start up losses associated with
                                                                             Parkview Hospital
      Switzerland        Southern Africa   Middle East   Corporate
                                                                           • Up 7% in constant currency

                                FY19 adjusted EBITDA decreased 2% in constant currency

 2019 FULL YEAR RESULTS PRESENTATION                                                                                         19
GROUP
BALANCE SHEET SUMMARY

£’m                                              31 Mar 19   31 Mar 18
Assets                                               6,428       6,343   • Currency largely increased
Non-current assets:                                                        reported numbers

       Property, equipment and vehicles              3,524       3,590   • Fixed assets increase
       Intangible assets                             1,587       1,406
                                                                               - Capital projects - £232m
                                                                               - Acquisitions - £152m
       Other non-current assets                       226         386
                                                                         • Hirslanden impairment
Current assets                                       1,091        961          - Property - £186m
                                                                               - Intangibles - £55m
Equity and liabilities                               6,428       6,343
                                                                         • Spire impairment - £164m
Shareholders’ funds                                  3,151       3,286
                                                                         • Successfully completed
Non-controlling interests                             115          87
                                                                           refinancing in MCSA and MCME
Interest-bearing debt                                1,982       1,937
                                                                         • Recalibrated Swiss debt
Other long-term liabilities                           681         579      covenants
Current liabilities                                   499         454
                                                                         • Net debt to EBITDA ratio 3.5x
Net debt                                           (1,717)     (1,676)

                                 Maintaining a responsible approach to leverage
2019 FULL YEAR RESULTS PRESENTATION                                                                         20
GROUP
CASH FLOW SUMMARY

£’m                                                  FY19    FY18
Net cash flow from operating activities               344     345    • Strong cash flow generation
Cash flow from investment activities                 (298)   (319)   • Cash conversion at 91% of
        Investment to maintain operations             (86)   (112)     adjusted EBITDA (FY18: 90%)

        Investment to expand operations              (154)   (142)   • Focus on improving debtor days
                                                                       in the Middle East
        Business combinations                         (63)    (83)
                                                                     • Maintenance capex to revenue
Other                                                   5      18      at 2.9%
Cash flow from financing activities                   (34)   (108)   • Free cash flow invested to
                                                                       support current expansion
        Distributions to non-controlling interests    (59)    (58)
                                                                     • Les Grangettes acquisition and
        Distributions to shareholders                  (8)    (10)
                                                                       investments in Intercare and
        Borrowings and other                           33     (40)     Welkom
Net increase/(decrease) in cash and cash
                                                       12     (82)
equivalents
Closing balance of cash and cash equivalents          265     261

2019 FULL YEAR RESULTS PRESENTATION                                                                     21
GROUP
CAPITAL EXPENDITURE

             TOTAL CAPITAL                              BUDGETED CAPITAL             • In constant currency, FY20 capex
             EXPENDITURE                                  EXPENDITURE                  budget down 11% from FY19:
              FY19 (£’m)                                  FY20 (£’m)*                         - MCME capex down 30%
                                                                                              following completion of
£94m                                      £66m                                                Parkview
41%                                       32%
                                                                           £70m      • FY20 budget includes:
                                      £72m                                  34%
                                       31%                                                    - MCME Airport Road and Al
                                                                                              Noor Hospitals and EHR project
                 £232m                                      £207m                             - MCSA upgrade cycle to
                                                                                              maintain and improve facilities
                                                                                              - Investment across the Group to
                                                                                              adapt to changing healthcare
                                                                                              environment including outpatient
   £1m                                                                                        facilities and digital technology
                                      Hirslanden
                  £65m                Southern Africa         £71m                                        *Constant currency basis:
                   28%                                         34%                                        GBP/CHF: 1.30
                                      Middle East
                                                                                                          GBP/ZAR: 18.01
                                      Corporate                                                           GBP/AED: 4.82

          Focus on capital discipline and returns-orientated investment across the Group
                                                                           Note: Capital expenditure excludes acquisitions
2019 FULL YEAR RESULTS PRESENTATION                                                                                                   22
HIRSLANDEN
FINANCIAL OVERVIEW

CHF’m                                                               FY19             FY18         % CHANGE
Revenue*                                                           1,778             1,735              2%    • Hirslanden performance impacted
EBITDA*                                                               285               318           (10%)     by changing regulatory environment
          EBITDA* margin                                           16.0%             18.3%
                                                                                                                and significant tariff reductions

Depreciation and amortisation                                       (124)             (110)            13%    • EBITDA impacted by reduction in
                                                                                                                average revenue per admission
Operating profit*                                                     161               208           (22%)
                                                                                                              • Depreciation increased due to
Net finance costs*         Δ
                                                                      (51)              (62)          (18%)     HIT2020, trade name amortisation
                                                                                                                and acquisitions
Income tax expense*                                                   (21)              (29)          (27%)
                                                                                                              • Finance costs benefited from
          Effective tax rate*                                      19.0%             19.7%                      refinance
Non-controlling interests                                              (4)                   -        100%    • Minority interest in Les Grangettes
Earnings*Δ                                                              85              117           (27%)   • Cash conversion at 97%
                                                                                                                (FY18: 81%)
Movement in inpatient admissions                                    3.8%            (2.6%)
                                                                                                              • Capex totalled CHF95m
Movement in revenue per admission                                 (2.2%)            (2.5%)                      (FY18: CHF129m)
Inpatient movement excluding Linde
                                                                (-0.1)%
and Les Grangettes
* Adjusted measures presented
Δ Includes inter-company loan interest which is eliminated in the Group earnings reconciliation

2019 FULL YEAR RESULTS PRESENTATION                                                                                                                   23
MEDICLINIC SOUTHERN AFRICA
FINANCIAL OVERVIEW

ZAR’m                                                          FY19             FY18        % CHANGE
RevenueΔ                                                     15,960           15,204             5%        • Patient volumes flat excluding
                                                                                                             Intercare
EBITDA*                                                       3,385             3,245            4%
                                                                                                           • Revenue per bed day up in line
         EBITDA* margin                                       21.2%             21.3%
                                                                                                             with inflation
Other gains and losses                                               7                 -        100%
                                                                                                           • Strong operational performance
Depreciation and amortisation                                  (556)            (496)            12%         and cost management delivered
                                                                                                             stable EBITDA margin
Operating profit*                                             2,836             2,749            3%
                                                                                                           • Depreciation increased due to
Net finance costs                                              (513)            (526)           (2%)         ongoing investment
Income tax expense                                             (710)            (684)            4%        • Cash conversion 96%
                                                              30.5%
                                                                                                             (FY18: 103%)
         Effective tax rate                                                     30.7%

Non-controlling interests                                      (316)            (303)            4%
                                                                                                           • Capex totalled ZAR1,178m (FY18:
                                                                                                             ZAR1,057m)
Earnings*                                                     1,301             1,237            5%

Movement in bed days sold                                      0.6%           (1.5%)

Movement in revenue per bed day                                4.3%              6.7%

Admissions (000’s)                                               565                566                -
Δ
 An income statement reclassification increased FY18 revenue and cost of sales by ZAR98m.
* Adjusted measures presented                                                                                                                  24
2019 FULL YEAR RESULTS PRESENTATION
MEDICLINIC MIDDLE EAST
FINANCIAL OVERVIEW

AED’m                                                         FY19        FY18     % CHANGE

Revenue                                                       3,262      3,050**         7%    • Gradual improvement in
EBITDA*                                                           425       397          7%      performance
         EBITDA* margin                                      13.0%       13.0%**               • Quality of revenue improving in line
                                                                                                 with strategy
Other gains and losses                                               -         -           -
                                                                                               • Lack of tariff increase impacting
Depreciation and amortisation*                                (171)        (149)        15%      growth
Operating profit*                                                 254       248          3%    • EBITDA includes Parkview start up
                                                                                                 losses; underlying margin of 14.1%
Net finance costs                                                 (31)      (34)        (9%)
                                                                                               • Depreciation increased due to
Non-controlling interest                                             -       (4)      (100%)     ongoing investment

Earnings*                                                         223       210          6%    • Cash conversion at 70% (FY18:
                                                                                                 74%)
Movement in inpatient admissions                              5.2%         3.2%
                                                                                               • Capex totalled AED452m driven by
Outpatient cases (‘000s)                                      2,923       2,866        2.0%      Parkview (FY18: AED389m)

* Adjusted measures presented
** IFRS 15 adjusted revenue and EBITDA margin figures presented

2019 FULL YEAR RESULTS PRESENTATION                                                                                                     25
GROUP
SUMMARY

DR RONNIE VAN DER MERWE
CEO MEDICLINIC INTERNATIONAL

2019 FULL YEAR RESULTS PRESENTATION
STRONG GEOGRAPHIC FOOTPRINT
 AND DIVERSIFIED SERVICE OFFERING

                                              SOUTHERN             MIDDLE
                       SWITZERLAND                                                      SPIRE        FY19 GROUP REVENUE CONTRIBUTION
                                               AFRICA               EAST

      BEDS                   1 916               8 517                926               2 000                      Day case Care

                                                                                                     Out-patient        8%
   HOSPITALS                  18                   52                  7                  39
                                                                                                     Care

   SUB-ACUTE                                                                                                 23%
                               –                    5                  –                   –
   HOSPITALS

    DAY CASE
                               2                    8                  2                   –
     CLINICS
                                                                                                                                   69%
  OUTPATIENT
                               3                   21*                 18                  8
    CLINICS

     MARKET
                              #1                   #3                  #1                 #2                            Acute in-patient Care
    POSITION

* Minority investment in Intercare’s 21 multi-disciplinary primary care medical and dental centres

 2019 FULL YEAR RESULTS PRESENTATION                                                                                                            27
UNIQUELY POSITIONED TO
LEVERAGE SCALE AND UNLOCK VALUE
                                                      FINANCIAL BENEFITS

                                           • Revenue diversification
                                           • Cost reduction
                                           • Shared resources
                                           • Procurement synergies
                                           • ICT licensing arrangements
                                           • Group financing

                                                    OPERATIONAL BENEFITS

                                           • Performance and standards improvement
                                           • Transfer of competencies
                                           • Collaborate to address global trends across the
                                             continuum of care
                                           • Optimise costs and processes to adapt to the
                                             outmigration of care

             SHARED SKILLS, RESOURCES, INFRASTRUCTURE AND EXPERIENCE

2019 FULL YEAR RESULTS PRESENTATION                                                            28
GLOBAL MEGATRENDS
INFLUENCING HEALTHCARE DELIVERY

              Demographics                        Medical Technology                      Digital Health     Consumerism

Growth          Ageing         Disease      Precision     Artificial    Personalisation       Social       Wearables Big data &
                              prevalence    Medicine    Intelligence                          media                  analytics

  2015            2030          2050

Number 60+      Number 60+    Number 60+
  901m            1,402m        2,092m
  12.3%           16.5%         21.5%
  of total        of total      of total
 worldwide       worldwide     worldwide
 population      population    population

                                             - Prevention
- Growing demand                             - Real-time information and intervention                                  Client
                        Access                                                                             Empowered
- Healthcare reforms                         - Democratising data                                                      Centric
                                                                                                            Consumer
- Efficiency                                 - Blurred lines consumerism
- Transparency                               - New revenue streams
- New payment models Quality Cost            - Steering of / owning clients
- New delivery models

                POSITIONING MEDICLINIC TO TAKE ADVANTAGE OF OPPORTUNITIES

2019 FULL YEAR RESULTS PRESENTATION                                                                                          29
STRATEGIC GOALS
SUPPORTING LONG-TERM SUCCESS

                   TO ENHANCE THE QUALITY OF LIFE

           1                          2             3                 4                   5

    To improve                 To become an    To transform       To grow in          To achieve
     our client                  integrated   our healthcare        existing           superior
       value                    healthcare     services and      markets and          long-term
    proposition                   provider         client       to expand into         financial
    significantly               across the     engagement        new markets            returns
                               continuum of      through
                                    care       digitalisation

                                              BY BEING:

                      analytics                  the employer                    client centred in
                       driven                      of choice                     everything we do

2019 FULL YEAR RESULTS PRESENTATION                                                                  30
GROUP SUMMARY
FY20 PRIORITIES

         CONTINUED FOCUS ON OPERATIONAL DELIVERY ACROSS ALL DIVISIONS

            GROUP WIDE                         DRIVE                         GROWTH
             INITIATIVES                    EFFICIENCIES                  OPPORTUNITIES
                                                                     • Evaluate opportunities to
  • Enhance patient                   • Adapt the business to
                                                                       invest across the continuum
    engagement through                  changing global healthcare
                                                                       of care
    technology and EHR rollout          environment
                                                                     • Continue to ramp-up
  • Focused engagement with           • Optimise the delivery of
                                                                       Mediclinic Parkview
    government and regulators           services and care we
                                                                       Hospital in Dubai
                                        provide
  • Deliver outstanding patient                                      • Deliver Mediclinic Al Noor
    experience                        • Build on business and
                                                                       and Airport Road projects
                                        operational improvements
  • Continue to improve clinical        in Abu Dhabi
                                                                       on time in Abu Dhabi
    outcomes                                                         • Open 2 more day case
                                      • Deliver on the HIT2020
  • Leverage procurement                strategic project in
                                                                       clinics in Switzerland
    benefits                            Switzerland                  • Open Mediclinic
  • Maintain leading market           • Successfully integrate new
                                                                       Stellenbosch Hospital and 2
    positions                                                          more day case clinics in
                                        investments
                                                                       Southern Africa

2019 FULL YEAR RESULTS PRESENTATION                                                                  31
QUESTIONS
AND ANSWERS

James Arnold
Head of Investor Relations
MEDICLINIC INTERNATIONAL PLC

14 Curzon Street
London
W1J 5HN
United Kingdom
Tel: +44 (0) 20 3786 8181
James.Arnold@Mediclinic.com
www.mediclinic.com
APPENDIX
OUR VISION, PURPOSE
AND VALUES

                                                                     VALUES

                                                                          Client orientation

                                                                          Patient safety

                                                                          Mutual trust &
                                                                          respect

                                                                          Teamwork
       VISION                                PURPOSE
                                                                          Performance
                                                                          driven
   To be preferred                     Enhance the quality of life
     locally and                      of our patients by providing
      respected                          comprehensive, high-
   internationally                    quality healthcare services

2019 FULL YEAR RESULTS PRESENTATION                                                        34
MEDICLINIC INTERNATIONAL
DIVERSIFIED GLOBAL FOOTPRINT
As at 31 March 2019

  DISTRIBUTION OF THE GROUP’S                         DISTRIBUTION OF THE GROUP’S                       DISTRIBUTION OF THE GROUP’S
  HOSPITALS                                           BEDS                                              EMPLOYEES
                                                                                                                                                       UNITED KINGDOM
                7                                                       926
                                                                                          1 916                                                   (SPIRE HEALTHCARE GROUP)
                9%                                                       8%                                6 152                  10 442
                                       18                                                 17%
                                                                                                            19%                       32%
                                       23%
                                                                                                                                                         SWITZERLAND
                                                                                                                                                         (HIRSLANDEN)
                  77                                                      11 359                                       32 398
               HOSPITALS                                                  BEDS                                       EMPLOYEES

       68%                                                   75%                                               49%

        52                                                  8 517                                          15 804
                                                                                                                                                                    MEDICLINIC
                                                                                                                                                                    MIDDLE EAST
For the 12 months to 31 March 2019

  CONTRIBUTION TO GROUP                               CONTRIBUTION TO GROUP                             CONTRIBITION TO GROUP
  REVENUE (£’M)                                       ADJUSTED EBITDA (£’M)                             ADJUSTED EARNINGS (£’M)
                                                                              -1                                      3     -3
                                                                   88
                                                                              0%                                      1%    -1%
     677                              1 368                        18%                            219     46
     23%                              47%                                                         44%     23%
                                                                                                                                            80
                                                                                                                                            41%

                 TOTAL                                                    TOTAL                                           TOTAL
                £2 932m                                                   £493m                                           £198m

      30%                                                   38%                                            36%

      886                                                   187                                            72

                                                                                                                                                    MEDICLINIC
 Switzerland        Southern Africa           Middle East         UK          Corporate                                                           SOUTHERN AFRICA
2019 FULL YEAR RESULTS PRESENTATION                                                                                                                                               35
MEDICLINIC INTERNATIONAL
FY20 GUIDANCE (pre IFRS 16)

                        •   Expects modest revenue growth from an increase in average bed capacity for the year,
                            reflecting the continued integration of Clinique des Grangettes
                        •   Impacted by a further nine months’ comparative effect in FY20 from the national outmigration
                            care programme that was implemented from 1 January 2019
 HIRSLANDEN             •   Cost management and efficiency savings likely to be more than offset by reductions in tariffs and
                            operational effects of outmigration; FY20 EBITDA margin around 15%
                        •   Over the medium-term, and assuming no further regulatory changes are implemented, the
                            operating performance is expected to be supported by benefits from the Hirslanden 2020
                            strategic project and structural efficiencies being implemented in the division

                        •   Expects volume growth of around 1% reflecting the additional capacity from the Intercare day
                            case clinics that were consolidated from December 2018
  MEDICLINIC            •   In line with the Group's strategic objectives and a continued focus on improving clinical quality
  SOUTHERN                  and patient experience, further investment will be made in employees and information
   AFRICA                   communication technology during FY20. This, together with the expected lower margin
                            contribution from Intercare and the ramp-up of the new Mediclinic Stellenbosch facility, is
                            anticipated to result in an EBITDA margin of around 20%

                        •   Expects revenue growth of around 10% supported by continued ramp-up of the Parkview
  MEDICLINIC            •   A gradual improvement in EBITDA margin to around 14% in FY20 incorporating the ramp-up of
   MIDDLE                   Parkview and investment in the hospital expansion and new comprehensive cancer centre at
    EAST                    Airport Road, which is scheduled to open in the first half of calendar year 2020
                        •   Continues to target an EBITDA margin of around 20%

2019 FULL YEAR RESULTS PRESENTATION                                                                                             36
MEDICLINIC INTERNATIONAL
FY20 GUIDANCE (IFRS 16)
 The Group will adopt the new IFRS 16 accounting standard (addressing the definition of a lease, recognition and
 measurement of leases and establishes principles for reporting useful information to users of financial statements about
 the leasing activities of both lessees and lessors) from 1 April 2019 and comparators will not be restated.

 The EBITDA margin guidance and expected increase to depreciation and finance costs under IFRS 16 for FY20 are set
 out below, together with the indicative corresponding EBITDA margin for FY19:

                        • EBITDA margin c.17% (FY19: 18.1%)
  HIRSLANDEN            • D&A: CHF35m
                        • Finance cost: CHF7m

   MEDICLINIC           • EBITDA margin c.21% (FY19: 21.7%)
   SOUTHERN             • D&A: ZAR89m
    AFRICA
                        • Finance cost: ZAR83m

   MEDICLINIC           • EBITDA margin c.16.5% (FY19: 16.1%)
    MIDDLE              • D&A: AED63m
     EAST
                        • Finance cost: AED49m
FY20: Indicatively, at a Group level, profit before tax would be lower by c.GBP4m, excluding the Group’s equity accounted
share of the impact at Spire. EBITDA would be higher by c.GBP61m due to the fact that the operating lease expense
recognised under IAS 17 is replaced with interest and depreciation under IFRS 16 (which is excluded from EBITDA).

The Group expects to recognise right-of-use assets of c.GBP610m and lease liabilities of c.GBP662m.

2019 FULL YEAR RESULTS PRESENTATION                                                                                         37
FOREIGN EXCHANGE RATES

Average rates                         FY19    FY18    % CHANGE

GBP/CHF                                1.30    1.29      (1.0%)

GBP/ZAR                               18.01   17.22      (4.6%)

GBP/AED                                4.82    4.87       1.1%

Closing rates                         FY19    FY18    % CHANGE

GBP/CHF                                1.30    1.34       2.9%

GBP/ZAR                               18.90   16.57     (14.1%)

GBP/AED                                4.79    5.15       6.9%

2019 FULL YEAR RESULTS PRESENTATION                               38
GROUP DEBT STRUCTURE
31 MARCH 2019
                               Carrying value   Carrying value
MEDICLINIC SOUTHERN AFRICA             ZARm                £'m                                                           Terms         Date repayable
Senior terms                           6,194              327          3M Jibar +1.49% (ZAR2,594m) and +1.59% (ZAR3,600m)         Sep 2022 and 2023
Preference shares                      1,810               96                                         3M Jibar x 72% +1.65%                 Sep 2022
Subsidiaries                             130                7                               Rates linked to prime interest rate         1 to 12 years

Total debt                             8,134              430

Interest expense                         653               36
                               Carrying value   Carrying value
HIRSLANDEN                             CHFm                £'m                                                           Terms         Date repayable

Secured long-term bank loans           1,483            1,143                                          Swiss 3M Libor +1.25%              Sep 2024
Other secured bank loans                  46               35    CHF16m Swiss 3M Libor +1.4%, CHF10m 0.9%, CHF20m 1.12%           May and Dec 2023
Swiss bonds                              235              181                          CHF145m at 1.625%, CHF90m at 2.0%           Feb 2021 & 2025
Secured long-term finance                  2                2                                 Interest ranging between 1-12%            1 to 7 years

Total debt                             1,766            1,361

Interest expense                          30               23
                               Carrying value   Carrying value
MEDICLINIC MIDDLE EAST                 AEDm                £'m                                                           Terms         Date repayable

Bank loans                               913              191                                                 3M Libor +1.85%              Aug 2023
Total debt                               913              191

Interest expense                          33                7

Total Group interest expense                               66

TOTAL GROUP DEBT (£'m)                                  1,982
CASH AND CASH EQUIVALENTS (£’m)                         (265)
GROUP NET DEBT (£’m)                                    1,717

2019 FULL YEAR RESULTS PRESENTATION                                                                                                               39
GROUP
CAPITAL EXPENDITURE
   FY19 Actual capex (£’m)              Hirslanden Southern Africa         Middle East           Corporate                    Total
   To maintain operations                       30               37                    16                    -                   83
   To expand operations                         42               28                    78                    1                  149
   Total capital expenditure                    72               65                    94                    1                  232

   FY20 Forecast capex (£’m)*           Hirslanden Southern Africa         Middle East           Corporate                    Total
   To maintain operations                       42               40                    14                    -                   96
   To expand operations                         28               31                    52                    -                  111
   Total capital expenditure                    70               71                    66                    -                  207

          • Reduced Hirslanden FY19 actual capex by 28% from original guidance of CHF132m
                  • Expect to maintain stable spend in FY20
          • MCSA investment to maintain and improve facilities and expansion of day case clinics
          • MCME FY19 expansion capex relates largely to Mediclinic Parkview Hospital and EHR project
                  • FY20 includes ongoing EHR investment and projects at the Airport Road and Al Noor Hospitals

                                                               * Constant currency basis: GBP/CHF: 1.30, GBP/ZAR: 18.01, GBP/AED: 4.82

2019 FULL YEAR RESULTS PRESENTATION                                                                                                40
FIVE YEAR
OPERATIONAL SUMMARY

                                       OPERATIONAL PERFORMANCE                                                                          BED NUMBERS AND OCCUPANCY
                                 10%
                                         7.8%
                                                                                                                           2,000                                              1,916     100%
  HIRSLANDEN

                                                                                                                                                                   1,805

                                                                                                                                                                                               BED OCCUPANCY RATE
                                                                                                         NUMBER OF BEDS
                                                         5.3%                                                                                              1,677
                                                                                                                           1,800                1,677
                                                                                                                                     1,655
                     Movements

                                 5%                                               2.6%       3.8%
                                                                                                                           1,600
                                                                         1.7%                                                       76.2%       76.3%     76.2%                         80%
                                                        0.5%      0.6%                                                                                             73.3%
                                        1.7%                                                                               1,400                                             70.4%
                                 0%
                                        FY15            FY16        FY17          FY18           FY19                      1,200

                                                                                 -2.5%           -2.2%                     1,000                                                        60%
                                 -5%                                                                                                 FY15       FY16       FY17    FY18       FY19
                                               Admissions           Revenue per inpatient
                                                                                                                                    Operational beds               Bed occupancy rate

                                       OPERATIONAL PERFORMANCE
   SOUTHERN AFRICA

                                 10%

                                                                                6.3%                                                                    6.7%
                                                                                                         5.8%
                                                 5.8%
                     Movements

                                                                                                                                                                                4.3%
                                 5%

                                                 4.4%
                                                                                2.9%                                         0.8%                                              0.6%
                                 0%
                                                 FY15                            FY16                                     FY17                          FY18                    FY19
                                                                                                                                                           -1.5%
                                                  Bed Days Sold            Revenue Per Bed Day

                                 -5%

2019 FULL YEAR RESULTS PRESENTATION                                                                                                                                                                                 41
OPERATIONS
                      HIRSLANDEN 2020

                                                             HIRSLANDEN 2020

                    HIT2020                                                                                     WE2020
                                                                        GROW2020
            Focus on patient care by                                                             Patients experience uniform culture of
                                                               Easy access to integrated care
            decreasing the burden of                                                             medical excellence and high quality of
                                                                    regions for patients.
           administration for hospitals.                                                          service in all Hirslanden hospitals.

          Improve productivity through                     Generate sustainable growth through Strengthening of group identity through
               higher efficiency                            business areas from adjacent fields   selective leadership development
                                                                                                           («from I to We»).

                                                                                     New
           Cost savings                       Material
                                                                   Acquisitions    fields of
           programme                        productivity
                                                                                   business
ONGOING

                                                                                                                        Leadership
                                                                                                         Value
                                                                                                                       Development
                                                                                                      communication
                           Infrastructure                                                                              Programme+
                            productivity

                                               Group
               Staff                                                 Doctor
                                            purchasing                            Cooperation
            productivity                                           recruitment
                                            organization

2019 FULL YEAR RESULTS PRESENTATION                                                                                                       42
CAPITAL PROJECTS
                      HIRSLANDEN
CAPITAL PROJECTS DURING FY19
Hospital                              Project                                                        Completion
Klinik Hirslanden                     HKL 2 Biplane                                                    1H19
Klinik Birshof                        Medical centre and intermediate care facility                    1H19
Klinik Hirslanden                     Emergency practice with 8 additional beds                        2H19
                                                         rd
Klinik Im Park                        Renovation of 3 floor/HKL 1 Biplane                              2H19
Clinique La Colline                   Sport medicine centre                                            2H19
Klinik Stephanshorn (Schuppis)        Doctor’s offices                                                 2H19
Klinik Hirslanden (Seefeldstrasse)    Doctor’s offices                                                 2H19
St. Anna Im Bahnhof (Lucerne)         Day case clinic                                                  2H19

FUTURE PROJECTS                                                                                       Expected
Hospital                              Project                                                        Completion
Clinique Bois-Cerf                    Day case clinic                                                   1H20
Klinik Hirslanden                     Upgraded nuclear diagnostics facility                             1H20
                                      Enlargement of the cardiology center and relocation of the
Clinique Cecil                                                                                          1H20
                                      gastroentérology center
Klinik St Gallen                      Day case clinic                                                  2H20
Klinik Hirslanden                     Check up re-located to medical centre; Cyber Knife installed     2H20
Klinik Im Park                        Medical Centre Seestrasse 247                                    2H20
Salemspital                           PETCT and Avenir 2.0                                           2H20/FY21
AndreasKlinik (Cham Lorze)            Doctor’s offices                                                 2H20
Klinik St. Anna                       Ward C5 upgrade with 6-12 additional beds                        2H20
Klinik Linde                          Extension of emergency unit and radiology                        2H20
Biel                                  Day case clinic                                                  1H21
Clinique des Grangettes               Emergency station, Cath lab and Nuclear medicine                 1H21

2019 FULL YEAR RESULTS PRESENTATION                                                                               43
CAPITAL PROJECTS
                   SOUTHERN AFRICA
CAPITAL PROJECTS DURING FY19
Hospital                                                                    Completion       Licenced Beds
Growth of existing hospitals
 Mediclinic Potchefstroom (70 operational beds)                                   2H19           55
 Mediclinic Medforum (24 operational beds)                                        2H19            2
 Mediclinic Legae (23 operational beds)                                           2H19            -
 Mediclinic Klein Karoo (8 operational beds)                                      2H19            -
Developing new day case clinics
 Mediclinic Newcastle                                                             2H19           30 (3 theatres)
Acquisitions
 Majority investment in the Welkom Medical Centre                                 1H19            60 (2 theatres)
 (20-bed sub-acute, 20-bed day case clinic and 20-bed psychiatric unit)
 Majority investment in the Intercare Hospital Group                              2H19           273 (13 theatres)
 (4 sub-acute: 160 beds, 4 day case clinics: 92 beds, 21-bed Medfem specialist facility)
Sale of existing hospital
 Mediclinic Barberton                                                             1H19           (34)
Total licenced beds                                                            As at FY19       8,517
FUTURE PROJECTS
Hospital                                                               Expected Completion      Beds
Existing hospitals
 Mediclinic Stellenbosch                                                        1H20               32
 Mediclinic Vergelegen                                                          2H20                8
 Mediclinic Cape Gate                                                           1H21               13
Day case clinics
 Mediclinic Nelspruit                                                           2H20               16   (3 theatres)
 Mediclinic Stellenbosch                                                        2H20               20   (2 theatres)
 Mediclinic Pietermaritzburg                                                    1H21               21   (3 theatres)
 Mediclinic Cape Gate                                                           1H21               20   (2 theatres)
 Mediclinic Winelands                                                           1H21               10   (1 theatre)
 Mediclinic Bloemfontein                                                        2H21               22   (2 theatres)

2019 FULL YEAR RESULTS PRESENTATION                                                                                    44
CAPITAL PROJECTS
                 DUBAI
MEDICLINIC PARKVIEW HOSPITAL

TOTAL               HOSPITAL OPENED   TOTAL   ICU    CONSULTATION   ER     NEONATAL   CATH   OPERATING
BUDGET                                BEDS    BEDS   ROOMS          BEDS   ICU BEDS   LAB    THEATRES

AED680m 22 SEP 2018 182                       15     100            19     22         1      5

2019 FULL YEAR RESULTS PRESENTATION                                                                  45
SPIRE HEALTHCARE GROUP PLC
UNITED KINGDOM

 •    Mediclinic’s 29.9% investment in Spire gives the Group exposure to UK private healthcare market
 •    Spire is ideally positioned to be a leading player in the independent hospital sector given its scale,
      reach and quality of care
 •    Underlying performance in 2018 down on previous year reflecting significantly declining NHS
      admissions, lower than anticipated growth in Private admissions and planned investment in Clinical
      quality and Consumer engagement:
        •    Underlying revenue down 1% and underlying EBITDA down 23%
        •    Strong cash flow performance with EBITDA conversion to cash flow of 105%
        •    Underlying Group admissions fell 4.6% as a result of growth in self pay (+1.5%) more than offset by
             declines in PMI (-2.2%) and NHS (-9.9%) volumes

 •    Appointed new CFO and COO, both effective from October 2018
 •    FY19 outlook: expect a return to modest revenue growth, offset by mix and the full year effect of
      investments in quality. This outlook reflects a measured approach whilst the NHS remains an
      uncertain market. Revenue components include:
                - Self-Pay: positive momentum in admissions and revenue
                - PMI: Moderate revenue increase
                - NHS: Tariff improvement from April 2019, but future volumes remain unclear
                - Mix: continued shift to oncology and day case

 •    May 2019 AGM Trading Update: on track to meet market expectations for the full year

2019 FULL YEAR RESULTS PRESENTATION                                                                                46
You can also read