2016 RESULTS 21 February 2017 - Anglo American

Page created by James Miranda
 
CONTINUE READING
2016 RESULTS 21 February 2017 - Anglo American
2016 RESULTS
21 February 2017
2016 RESULTS 21 February 2017 - Anglo American
CAUTIONARY STATEMENT
Disclaimer: This presentation has been prepared by Anglo American plc (“Anglo American”) and comprises the written materials/slides for a presentation concerning Anglo American. By attending
this presentation and/or reviewing the slides you agree to be bound by the following conditions.
This presentation is for information purposes only and does not constitute an offer to sell or the solicitation of an offer to buy shares in Anglo American. Further, it does not constitute a
recommendation by Anglo American or any other party to sell or buy shares in Anglo American or any other securities. All written or oral forward-looking statements attributable to Anglo American or
persons acting on their behalf are qualified in their entirety by these cautionary statements.
Forward-Looking Statements
This presentation includes forward-looking statements. All statements other than statements of historical facts included in this presentation, including, without limitation, those regarding Anglo
American’s financial position, business, acquisition and divestment strategy, plans and objectives of management for future operations (including development plans and objectives relating to Anglo
American’s products, production forecasts and reserve and resource positions), are forward-looking statements. By their nature, such forward-looking statements involve known and unknown risks,
uncertainties and other factors which may cause the actual results, performance or achievements of Anglo American, or industry results, to be materially different from any future results, performance
or achievements expressed or implied by such forward-looking statements.
Such forward-looking statements are based on numerous assumptions regarding Anglo American’s present and future business strategies and the environment in which
Anglo American will operate in the future. Important factors that could cause Anglo American’s actual results, performance or achievements to differ materially from those in the forward-looking
statements include, among others, levels of actual production during any period, levels of global demand and commodity market prices, mineral resource exploration and development capabilities,
recovery rates and other operational capabilities, the availability of mining and processing equipment, the ability to produce and transport products profitably, the impact of foreign currency exchange
rates on market prices and operating costs, the availability of sufficient credit, the effects of inflation, political uncertainty and economic conditions in relevant areas of the world, the actions of
competitors, activities by governmental authorities such as changes in taxation or safety, health, environmental or other types of regulation in the countries where Anglo American operates, conflicts
over land and resource ownership rights and such other risk factors identified in Anglo American’s most recent Annual Report. Forward-looking statements should, therefore, be construed in light of
such risk factors and undue reliance should not be placed on forward-looking statements. These forward-looking statements speak only as of the date of this presentation. Anglo American expressly
disclaims any obligation or undertaking (except as required by applicable law, the City Code on Takeovers and Mergers (the “Takeover Code”), the UK Listing Rules, the Disclosure and Transparency
Rules of the Financial Conduct Authority, the Listings Requirements of the securities exchange of the JSE Limited in South Africa, the SWX Swiss Exchange, the Botswana Stock Exchange and the
Namibian Stock Exchange and any other applicable regulations) to release publicly any updates or revisions to any forward-looking statement contained herein to reflect any change in Anglo
American’s expectations with regard thereto or any change in events, conditions or circumstances on which any such statement is based.
Nothing in this presentation should be interpreted to mean that future earnings per share of Anglo American will necessarily match or exceed its historical published earnings per share.
Certain statistical and other information about Anglo American included in this presentation is sourced from publicly available third party sources. As such it presents the views of those third parties,
but may not necessarily correspond to the views held by Anglo American.
No Investment Advice
This presentation has been prepared without reference to your particular investment objectives, financial situation, taxation position and particular needs. It is important that you view this presentation
in its entirety. If you are in any doubt in relation to these matters, you should consult your stockbroker, bank manager, solicitor, accountant, taxation adviser or other independent financial adviser
(where applicable, as authorised under the Financial Services and Markets Act 2000 in the UK, or in South Africa, under the Financial Advisory and Intermediary Services Act 37 of 2002).
Alternative performance measures
Throughout this presentation a range of financial and non-financial measures are used to assess our performance, including a number of the financial measures that are not defined under IFRS,
which are termed ‘alternative performance measures’ (APMs). Management uses these measures to monitor the Group’s financial performance alongside IFRS measures because they help illustrate
the underlying financial performance and position of the Group. These APMs should be considered in addition to, and not as a substitute for, or as superior to, measures of financial performance,
financial position or cash flows reported in accordance with IFRS. APMs are not uniformly defined by all companies, including those in the Group’s industry. Accordingly, it may not be comparable
with similarly titled measures and disclosures by other companies.

Front cover images (clockwise from top left): Copper geologist; Minas-Rio (iron ore) primary crushing; Global Sightholder Sales (diamonds), Gaborone; Los Bronces (copper),                                    2
mineral control; Iron ore stockpile at Saldanha; Forevermark bridal jewellery; pure platinum grain at the Precious Metals Refinery.
2016 RESULTS 21 February 2017 - Anglo American
DELIVERING CHANGE, BUILDING RESILIENCE
1

    Delivering on   •   Free cash flow target exceeded…$2.6bn vs $0.4bn.
    commitments     •   Net debt at $8.5bn…………..well below $10bn target.

2

     Operational    •   Operating model driving productivity improvements.
    improvement     •   EBITDA margin up 5% points…despite lower prices.

3

    Balance sheet   •   Investment grade rating……….….remains an objective.
      resilience    •   Reinstatement of dividend targeted for the end of 2017.

4

      Portfolio     •   Focus continues on high quality, long life assets…to support more consistent returns.
     upgrading      •   Moranbah/Grosvenor & Nickel retained…no further disposals planned for deleveraging.

                                                                                                            3
2016 RESULTS 21 February 2017 - Anglo American
2016 PRELIMINARY
RESULTS
BUSINESS PERFORMANCE

Mark Cutifani

                       De Beers Diamond Jewellery
2016 RESULTS 21 February 2017 - Anglo American
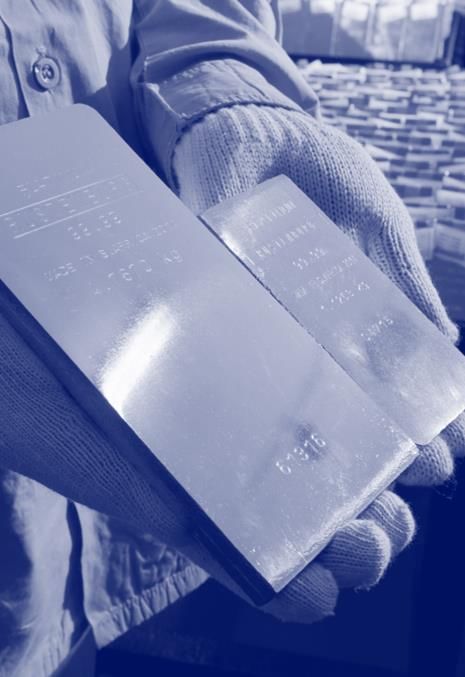
DELIVERING ON OUR COMMITMENTS

                                                                                                        Actual                                  Target

 EBITDA(1)                                                                                               $6.1bn                                $4.5bn(2)     
 Cost & volume improvements                                                                              $1.5bn                                 $1.6bn       ~
 Capital expenditure(3)                                                                                  $2.5bn
2016 RESULTS 21 February 2017 - Anglo American
SAFETY & ENVIRONMENT
  Safety: Loss of life and TRCFR(1)                                                                           Safety
         1.3                                Group TRCFR                                                       •   Fatal incidents extremely disappointing – focus on
                              1.1                                                                                 critical controls post restructuring.
                                                                        0.9
                                                   0.8
         13
                              15                                                             0.7
                                                                                                              •   24% improvement in total recordable injury rates is
                                                                                             11                   encouraging.
                                                    6                    6                                    •   Innovation programme supports ongoing broad-
                                                                                                                  based safety improvement.

        2012                 2013                2014                 2015                 2016

  Environmental incidents (levels 3 to 5)(2)                                                                  Environment
                                                                                                              •   Incident reductions reflect better planning and
                              30
                                                                                                                  associated attention to detail.
         22
                                                   15                                                         •   Water management remains a key challenge and
                                                                                                                  opportunity across most jurisdictions.
                                                                         6
                                                                                              4
                                                                                                              •   Energy, GHG and water reduction targets on track.
       2012                 2013                 2014                 2015                 2016

       Divested businesses                 De Beers            Nickel            Coal          Kumba
       Exploration                         Platinum            Copper            IOB
(1)   Total Recordable Cases Frequency Rate.
(2)   Environmental incidents are classified in terms of a 5-level severity rating. Incidents with medium, high                                                         6
      and major impacts, as defined by standard internal definitions, are reported as level 3-5 incidents.
2016 RESULTS 21 February 2017 - Anglo American
DELIVERED INCREASED PRODUCTION
  FY 2016 versus FY 2015 (% change)
                                                                                                                                                       47%

          3%                                                                                                                     8%
      increase at
                                                                                                        6%
       2015’s ore
        grades.

                                                                                 2%                                                                                            2%

                                                                                                                                        76%

                                                                                                                          (5)%
                                                                                                                        Kumba(5)      Minas-Rio
         (10)%
      Copper(1)           SA export coal         Coal Australia(2)          De Beers(3)             Platinum(4)              Iron Ore                Nickel             Group Total(6)
                           & Cerrejón
(1)   Copper normalised for Anglo American Norte disposal. Production as reported is 19% lower than prior year.
(2)   Met coal production only. Shown on a normalised basis to exclude Foxleigh. Production as reported for total Coal Australia export metallurgical production is 2% lower than prior year.
(3)   De Beers production on 100% basis with the exception of Gahcho Kué, which is on an attributable 51% basis. Normalised for Snap Lake (care and maintenance) and Kimberley (disposal).
      Production as reported 5% lower than prior year.
(4)   Platinum based on total metal in concentrate excluding POC, Twickenham, Rustenburg and Union.
(5)   Kumba includes Sishen and Kolomela only.
(6)   Copper-equivalent is normalised for divestment / closure / care and maintenance of Niobium and Phosphates, Kimberley, Snap Lake, Foxleigh, Drayton, Callide and Rustenburg. Production as   7
      reported is 4% lower than prior year. Group includes attributable share of De Beers.
2016 RESULTS 21 February 2017 - Anglo American
9% IMPROVEMENT IN UNIT COSTS(1)
      FY 2016 versus FY 2015 (% change) US$ basis

                                                          (5)%
           (6)%

                                                                                  (8)%
                                                                                                                                                                                (9)%
                                                                                                         (10)%

                                  (13)%

                                                                                             (13)%                                                      (19)%

                                                                                                           (53)%
                                                                                           Kumba(7)      Minas Rio
                                                                                                                                (24)%
        Copper(2)          SA export coal(3)       Coal Australia(4)          De Beers(5)             Platinum(6)              Iron Ore                 Nickel                Group(1)

(1)   Copper-equivalent unit cost includes only Anglo American’s proportionate share of De Beers and Platinum. Excludes equity accounted assets and those not in commercial production. Calculated
      using long-term consensus prices. Normalised for divestment / closure / care and maintenance of Niobium and Phosphates, Kimberley, Snap Lake, Foxleigh, Drayton, Callide and Rustenburg.
(2)   Copper normalised for Anglo American Norte disposal.
(3)   Coal RSA FOB/t cash cost in USD comprises RSA Trade only, excludes royalties.
(4)   Coal Australia FOB/t cash cost in USD excludes Callide, royalties and study costs. Normalised for sale of Foxleigh and the cessation of mining activities at Drayton.
(5)   De Beers unit costs are based on total production and operating costs and have been restated to exclude depreciation. Normalised for Snap Lake (C&M) and Kimberley disposal.
(6)   Platinum unit cost includes retained mines (excludes purchase of concentrate, Twickenham, Rustenburg and Union).                                                                               8
(7)   Kumba includes Sishen and Kolomela only.
2016 RESULTS 21 February 2017 - Anglo American
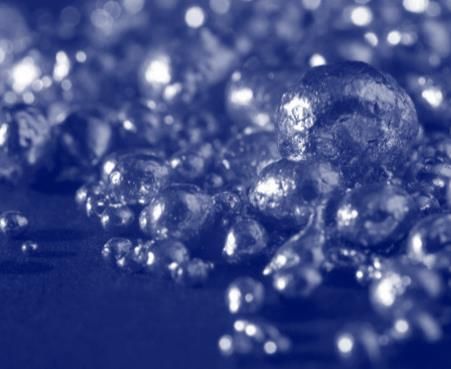
$1.5BN EBITDA COST & VOLUME IMPROVEMENT
 Incremental EBITDA improvement ($bn) - 2016

                                                                          0.4

                                                                      De Beers
                                                                                                        (0.1)            1.5

                       1.2                                                Coal

                  Operating                                            Other
                  efficiencies

                  Input costs

                                                              (0.1)
                     Labour
                                                                             (0.2)
                                                          Los Bronces      Met Coal
                  Exploration                            weather(1) and    geological
                                                         strike impact      issues

                  Overheads

                     Cost                                             Volume                      Platinum non-cash     Total
                                                                                                 inventory adjustment
(1)   Includes associated impact on production as a result of lower grade ore being processed.                                  9
2016 RESULTS 21 February 2017 - Anglo American
MARGINS IMPROVING 5% POINTS DESPITE LOWER PRICES
 Indexed prices (1 Jan 2015 = 1)(1) and EBITDA margins                                                                    Margin focus
                  EBITDA margin                      Basket price                Average annual
                                                                                                                          •     EBITDA and free cash flow
                                                                                 basket price
                                                                                                                                improved through:
Index
                                                                                    26%                                        Portfolio upgrading.
 1.1

                              21%                                                                                              Improved productivity and costs.
 1.0
                                                                                                                               Lower indirect costs.
 0.9
                                                                                                                          •     Marketing activities contributing to
 0.8
                                                                                                                                higher realised prices and margins.
                                                                                                                          •     Prices on average 3% lower in
 0.7                                                                                                                            2016 than 2015.

 0.6

 0.5
                              2015                                                  2016

Source: Thermal Coal – globalCOAL; Diamonds – De Beers Rough Price     (1)   Price line is equivalent to weighted average daily revenue for 2016 sales volumes. Basket price
Index, Platinum, Copper & Nickel – London Metal Exchange; Met Coal –         excludes Samancor, Niobium, Phosphates, Corporate and OMI.
Platts Steel markets daily; Iron Ore – Platts 62% CFR China has been
used in this instance as a generic industry benchmark.

                                                                                                                                                                               10
DE BEERS – STRONG RECOVERY
                                            Realised                                 Underlying              EBITDA                                      Sales             Average
                   Production(1)                                Unit cost(2)                                                       Capex
                                             price                                    EBITDA                 margin                                     (Cons.)           price index
2016                   27.3Mct               $187/ct               $67/ct              $1,406m                  23%                $526m              30.0Mct(3)                118

vs. 2015                  $5%                 $10%                  $19%                 #42%                  #2pp                 $25%                 #50%                  $13%

 Underlying EBITDA ($m)                                                                          2016 Performance
                                                                             1,406               • Improved trading conditions resulted in higher sales
                                                                                                   volumes, partly offset by lower realised prices.
       990                                                   597
                                                                                                 • Midstream sentiment improved and global consumer
                        (181)              809
                                                                                                   demand in line with 2015.

                                                                                                 2017 Outlook and Areas of Focus
                                                                                                 • Midstream stocks returned to more normal levels in
                                                                                                   2016, rough demand expected to normalise in 2017.
      2015           Price/FX/                           Volume,              2016               • Production guidance of 31-33 Mcts (100% basis).
                     Inflation                           costs &
                                                          other                                  • Focus on Gahcho Kué ramp-up and further unit cost
                                                                                                   reductions.

(1)   Shown on a 100% basis with the exception of Gahcho Kué, which is on an attributable 51% basis, as reported. +2% excluding Kimberley and Snap Lake vs 2015.
(2)   Total cost per carat recovered (excludes depreciation). Calculated including 19.2% of Debswana and 50% of Namdeb Holdings volumes on a reported basis. -8% excluding Kimberley and
      Snap Lake vs 2015.                                                                                                                                                                   11
(3)   Sales of 32.0Mct on a 100% basis (55% increase).
PLATINUM – PORTFOLIO UPGRADING CONTINUES
                                               Realised                   Unit            Underlying              EBITDA
                        Production(1)                                                                                                    Capex               Pt sales         Headcount
                                             Basket price(2)            cost(2)(3)         EBITDA                 margin
      2016                 2,382 koz             $1,753/oz             $1,330/oz              $532m                  12%                 $314m               2,416 koz         28,250

      vs. 2015                #2%                    $8%                  $12%                $26%                   $3pp                 $14%                  $2%             $38%

       Underlying EBITDA ($m)                                                                         2016 Performance
          718                                                                                         • Strong performance across managed mines.

                        (200)                                                                         • Rustenburg sale completed with associated
                                        518                                           532               headcount reduction.
                                                      (143)           157
                                                                                                      • Waterval smelter furnace run-out reduced 2016
                                                                                                        refined platinum production by 65koz.

                                                                                                      2017 Outlook and Areas of Focus
                                                                                                      • Production guidance of 2.35 – 2.40Moz.
         2015       Price/FX/                     Non-cash Volume,                   2016             • Continued focus on portfolio optimisation, production
                    Inflation                     inventory costs &                                     consistency and cost reductions.
                                                    adj.(4)  other

(1)   As reported, reflecting own mine production and purchases of metal in concentrate. Production excluding POC, Twickenham, Rustenburg and Union +6% vs 2015.
(2)   Metrics stated per platinum ounce.
(3)   As reported, reflecting own mine production, excluding POC and share of joint venture production. Unit costs excluding Twickenham, Rustenburg and Union -10% vs 2015.               12
(4)   Amount represents the reduction to the stock count gain in 2016 compared with 2015.
COPPER – STRONG COST REDUCTIONS
                                              Realised                C1 unit             Underlying               EBITDA                                                            Material
                    Production(1)                                                                                                         Capex                  Sales
                                               price                  cost(2)              EBITDA                  margin                                                             mined

2016                      577kt                225c/lb                137c/lb                $903m                   29%                 $563m                   578kt                 265Mt

vs. 2015                  $19%                   $1%                   $11%                    $4%                   #3pp                 $15%                   $18%

  Underlying EBITDA ($m)                                                                              2016 Performance
                                                                                                      • Production down 19%, driven by AA Norte disposal,
      942
                                                                                                        Los Bronces lower grade, weather and strike
                                     902             170           (169)             903
                     (40)                                                                               challenges. Partly offset by record concentrate
                                                                                                        production at Collahuasi.
                                                                                                      • 11% reduction in unit costs driven by cost savings.
                                                                                                      2017 Outlook and Areas of Focus
                                                                                                      • Production guidance of 570-600kt(3).
                                                                                                      • Continued optimisation of the plant at Collahuasi.
      2015      Price/FX/                          Cash          Volume            2016
                Inflation                          cost          & other                              • Los Bronces recovery and implementation of the
                                                                                                        operating model at the mine.

(1)   Includes Anglo American Norte. -10% excluding Anglo American Norte vs 2015.
(2)   Includes Anglo American Norte. -6% excluding Anglo American Norte vs 2015.
(3)   Includes ~50kt of El Soldado production. Stator motors on each of the two ball mills on Line 3 at Collahuasi (c.60% of plant throughput) expected to be replaced in 2018 and 2019.        13
      This may be brought forward for operational reasons (estimated impact of each change on attributable production of 20-25kt).
COAL AUSTRALIA – MARGIN FOCUS CONTINUES

                      Metallurgical             FOB realised                                                  Underlying                  EBITDA                 Moranbah
                                                                                 Unit cost(3)                                                         Capex
                      production(1)               price(2)                                                     EBITDA                     margin              LW cutting hours

2016                       20.9Mt                     $112/t                          $51/t                       $996m                       39%     $523m      94 hrs / wk
vs. 2015                     $2%                      #24%                            $7%                          #70%                       #14pp   $38%         #13%

 Underlying EBITDA ($m)                                                                                 2016 Performance
                                                                                                        • Unit costs lowest since 2006.

                                                                                   996                  • Grosvenor first longwall coal 7 months ahead of
                                                                                                          schedule.
                                           791                 205
                                                                                                        • Foxleigh and Callide divestments successfully
                       205
    586                                                                                                   completed.

                                                                                                        2017 Outlook and Areas of Focus
                                                                                                        • Production guidance 19Mt - 21Mt, reduction largely
                                                                                                          reflecting disposals and removal of high cost tonnes.
   2015            Price/FX/                                Volume,               2016                  • Grosvenor ramp-up to continue.
                   Inflation                                Cost &
                                                             Other

    (1) Shown on a reported basis. 0% excluding Foxleigh vs 2015.
    (2) Realised Australian metallurgical export. Includes PCI, semi soft; excludes thermal.
    (3) FOB unit costs excluding royalties, study costs and Callide. Shown on a reported basis. -5% excluding Foxleigh and Drayton vs 2015.                                      14
COAL SA AND COLOMBIA – PRODUCTIVITY IMPROVEMENTS
                                                                                        Underlying       EBITDA
                    Export prod.                FOB price(1)          Unit cost(2)                                               Run of mine per
                                                                                         EBITDA          margin       SA Capex
                      SA / Col                   SA / Col              SA / Col                                                      FTE(3)
                                                                                         SA / Col        SA / Col
2016              17.9Mt / 10.7Mt                $60/t / $56/t        $34/t / $28/t    $473m / $235m    22% / 39%      $90m           6,200
vs. 2015              #3% / $4%                   #9% / #2%           $13% / $10%       #37% / #40%    #4pp / #12pp    $13%          #13%

 Underlying EBITDA ($m)                                                               2016 Performance
                                                                                      • On-mine local currency costs in line with 2013 levels
                                                                          708           in South Africa.
                                                                 67
                                   603               38                               • Work practice improvements at SA Export mines
   513              90
                                                                                        driving higher production, improved productivity and
                                                                                        lower costs.

                                                                                      2017 Outlook and Areas of Focus
                                                                                      • Export thermal coal production guidance of 29Mt -
                                                                                        31Mt.
  2015        Price/FX/                          Volume, Cerrejon(4)      2016
              Inflation                          Cost &                               • Continued focus on productivity improvements.
                                                  Other

    (1) Realised South Africa and Colombia thermal export.
    (2) FOB unit costs excluding royalties.
    (3) SA Export mines.
    (4) Includes cost and volume movements.                                                                                                        15
KUMBA IRON ORE – BREAK-EVEN PRICE FALLS TO $29/T
                                            Realised                  Unit cost        Underlying         EBITDA                                Break-even
                    Production                                                                                         Capex     Sishen waste
                                          price (FOB)(1)              (FOB)(1)          EBITDA            margin                                   price

2016                    41.5Mt                   $64/t                       $27/t      $1,347m            48%         $160m        137Mt         $29/t
vs. 2015                  $8%                   #21%                     $13%                #33%          #13pp        $69%        $38%          $41%

 Underlying EBITDA ($m)                                                                             2016 Performance

                                                                                     1,347          • Lower-cost pit configuration implemented at Sishen.
                                     1,267
                                                      (100)              180                        • Successful completion of restructuring yielded
                     256                                                                              improved mining productivity and cash savings.
  1,011

                                                                                                    2017 Outlook and Areas of Focus

                                                                                                    • Production guidance is 40-42 Mt for 2017.

                                                                                                    • Continued focus on further cost savings with Kumba
                                                                                                      target FOB cash cost of ~$30/t.

  2015          Price/FX/                           Volume             Cash          2016
                Inflation                                              costs
                                                                      & other
                                                                                                                                                             16
  (1) Break-even price of $29/t in 2016 (2015: $49/t) (62% CFR dry basis).
IRON ORE BRAZIL (MINAS-RIO) – RAMP-UP CONTINUES
                                             Realised price                 Unit cost      Underlying      EBITDA
                      Production                                                                                          Capex(2)         Sales
                                                (FOB)(1)                    (FOB)(1)        EBITDA         margin
2016                 16.1Mt (wet)                 $54/wmt                    $28/wmt         $(6)m           nm            $109m           16.2Mt

vs. 2015                  #76%                      #32%                       $53%           nm             nm            $88%            #91%

Product - (Mt - wet)                                                                      2016 Performance
                                                                                          • Ramp-up at Minas-Rio continued following Step 2
                         +76%                                                               licences in H2 2016.
                                                                        16-18
                                         16.1                                             • Capitalised EBITDA of $269m.
                                                                                          2017 Outlook and Areas of Focus
                                                                                          • Production guidance of 16-18 million tonnes.

                                                                                          • FOB cash cost guidance of ~$27/t.
                                                                                          • Focus on operational stability and obtaining Step 3
                                                                                            licences.
           9.2

          2015                           2016                          2017F
(1) Break-even price of $44/t in 2016 (62% CFR dry basis).
                                                                                                                                                    17
(2) Stated net of capitalised operating cash inflows of $108m (2015: outflow of $338m).
NICKEL – OPERATING STABILITY, RECORD PRODUCTION
                                      Realised   C1 unit    Underlying     EBITDA                                Barro Alto
                     Production(1)                                                       Capex        Sales(1)
                                       price     cost(2)     EBITDA        margin                                 ore feed

2016                      44.5kt      431c/lb    350c/lb      $57m          13%          $62m         44.9kt      2.4Mt(3)

vs. 2015                  #47%         $13%      $19%          nm            nm         #138%         #40%         #60%

  Barro Alto C1 unit cost (USc/lb)                                  Barro Alto 2016 Performance
                                     -43%                           • Reached nameplate capacity in Q3 2016, following
            620                                                       furnace rebuilds in 2015.

                                      453
                                                      351
                                                                    2017 Outlook and Areas of Focus
                                                                    • Production guidance of ~45kt.

                                                                    • Lower expected grades in 2017 – key focus on
                                                                      further improving production stability and reducing
           2012                      2015           2016
                                                                      unit costs.

(1) Nickel BU only.
(2) Codemin and Barro Alto.
(3) Based on ore feed run rate.

                                                                                                                              18
2016 PRELIMINARY
RESULTS
FINANCIALS

René Médori

                   Mafube Colliery, Load and haul operations
RESULTS – STRONG RECOVERY & NET DEBT REDUCTION

  Key financials(1) ($bn)                                                                                                                        2016                       2015     Change

  EBITDA                                                                                                                                            6.1                        4.9     25%

  Effective tax rate (%)                                                                                                                          25%                        31%      (6pp)

  Earnings per share ($/share)                                                                                                                    1.72                       0.64     169%

  Capital expenditure(2)                                                                                                                            2.5                        4.0    (37)%

  Attributable free cash flow(3)                                                                                                                    2.6                      (1.0)      nm

  Disposal proceeds(4)                                                                                                                              1.8                        1.7      1%

  Net debt                                                                                                                                          8.5                      12.9     (34)%

  Net debt / EBITDA                                                                                                                               1.4x                        2.7x      nm

(1)   All metrics shown on an underlying basis.
(2)   Excludes capitalised profits and losses.
(3)   Attributable free cash flow is defined as net cash inflows from operating activities net of total capital expenditure, net interest paid and dividends paid to minorities.
(4)   Excludes tax paid of $0.2bn (2015: $0.0bn).                                                                                                                                             20
COST & VOLUME IMPROVEMENTS DRIVE HIGHER EARNINGS

 EBITDA variance: 2016 vs. 2015 ($bn)

                     (0.1)
      Coal Aus
                      0.2
      Iron Ore
      Coal SA
                      0.3                                                                                                                      (0.1)
                      0.1
                                                                                                                De Beers     0.5
                                                                                                                                                                (0.3)
      Platinum       (0.3)
  Diamonds                                                                                                                   (0.1)
                     (0.2)
         Other
                     (0.1)                                                                                           Total cost &
                                                                                                                     volume: $1.5bn
                                                                                                          1.2

                              Bulks              0.7               (0.6)
                                                                                                                                                                          6.1

                              Base &
                             precious
           4.9                                                                         4.9

          2015               Price(1)        Currency           Inflation(2)                             Costs             Volume(3)         Platinum         Disposals   2016
                                                                                                                                             non-cash          & other
                                                                                                                                             inventory
                                                                                                                                            adjustment

(1)    Price variance calculated as increase/(decrease) in price multiplied by current period sales volume.
(2)    Inflation variance calculated using CPI on prior period cash operating costs that have been impacted directly by inflation.
(3)    Volume variance calculated as increase/(decrease) in sales volumes multiplied by prior period EBITDA margin. Cash costs include inventory movements.                      21
$4.4BN REDUCTION IN NET DEBT
 Net debt ($bn)(1)

  Opening net debt – 1 January 2016                                            12.9                  • Cash flow from operations reflects realisation
                                                                                                       of $1.5bn in cost and volume improvements.
  Cash flow from operations                                                    (5.4)

  Working capital                                                              (0.4)                 • Cash tax paid lower principally as result of:
                                                                                                             I.      utilisation of tax losses in Australia; and
  Capital expenditure(2)                                                         2.4
                                                                                                             II.     relief arising from accelerated tax
  Cash tax paid                                                                  0.5
                                                                                                                     depreciation in Chile.
  Net interest(3)                                                                0.6
                                                                                                     • Net interest paid forecast to decrease on lower
  Dividends from associates, joint ventures and
  financial asset investments
                                                                               (0.2)                   net debt – P&L charge to increase as project
                                                                                                       delivery reduces capitalised interest.
  Bond buybacks                                                                (0.1)

  Disposals (net of tax)                                                       (1.6)

  Other                                                                        (0.1)

  Closing net debt – 31 December 2016                                           8.5

(1)   Net debt excludes the own credit risk fair value adjustment on derivatives.
(2)   Capex defined as cash expenditure on property, plant and equipment including related derivatives, net of proceeds from disposal of property, plant and equipment and direct   22
      funding for capital expenditure from non-controlling interests. Includes capitalised operating cash flows.
(3)   Net interest includes the impact of derivatives hedging net debt.
$5.3BN REDUCTION IN GROSS DEBT
Gross debt ($bn)                                            Bond maturity profile ($bn)
                                              -27%
         19.6                     19.8                                                2.5
                                                                   1.9
                                                     14.5                                              1.8

         2014                    2015                2016         2017               2018             2019

Liquidity headroom ($bn)                                    • Bond buybacks of $1.7bn; $1.83bn in debt retired.
  Cash         Undrawn committed facilities

                                                     15.8   • BNDES loan repayment of $1.7bn.
         15.1                    14.8
                                                     6.0
         6.7                      6.9                       • Conservative levels of liquidity maintained.

         8.4                                         9.7    • Expect to reduce level of liquidity over medium term.
                                  7.9

         2014                    2015                2016
                                                                                                                      23
$0.4BN WORKING CAPITAL IMPROVEMENT
Working capital movement ($bn)

                                                                     • Customer focused initiatives, including
                               0.3   De Beers                          pre-payments.

                  0.7
                                                                     • Improvement in supplier payment terms.

    3.8
                                                                     • Inventory management.
                                            0.8

                                                                     • Lower De Beers inventory of $0.3bn.

                                                          3.4        • Partially offset by the impact of an
                                                                       increase in prices late in 2016.
2016 Opening Price impact   Inventory     Working     2016 Closing
                                           capital
                                        optimisation/
                                            other

                                                                                                                 24
37% DECLINE IN CAPITAL EXPENDITURE
 Capital expenditure ($bn)(1)                                                                             Expansionary capex

                    (37)%
          4.0                                                                                             ($bn)                 2015   2016

                                                                                                          Minas-Rio              0.5    0.2

          1.9
                                                                                                          Grosvenor              0.5    0.3
                                  2.5                    ~2.5                   ~2.5

                                                         0.5                                              Gahcho Kué             0.2    0.2
                                  1.0
          0.7                                                                                             Venetia underground    0.1    0.1
                                                         0.8
                                  0.6
                                                                                                          Barro Alto             0.2      -
          1.4                                            1.2
                                  1.0                                                                     Others                 0.4    0.2

                                                                                       (2)
         2015                    2016                   2017F                  2018F                      Total                  1.9    1.0

            Expansionary Capex                Stripping & development                  SIB

(1)   Capex defined as cash expenditure on property, plant and equipment including related derivatives,
      net of proceeds from disposal of property, plant and equipment and includes direct funding for
      capital expenditure from non-controlling interests. Excludes capitalised operating cash flows.
(2)   Includes all categories of capex, but excludes unapproved expansionary projects.

                                                                                                                                              25
$1.8BN OF DISPOSAL PROCEEDS IN 2016
2016 Proceeds(1) ($bn)

                                                                         1.8
                                                                                     • Sale of Niobium Phosphates to
                                                      0.1                              China Molybdenum for $1.5bn.

                               0.2
                                                                                     • Sale of minority stake in Exxaro for $0.2bn.
       1.5

                                                                                     • Announced disposal of Union to contribute
                                                                                       further to portfolio upgrading.

                                                                                     • Value thresholds were not met on Moranbah
                                                                                       Grosvenor and Nickel.

                                                                                     • Total disposal proceeds of $3.5bn in 2015
 Niobium and                Exxaro                  Other          Total disposals
                                                                                       and 2016.
 Phosphates

 (1)   Pre-tax proceeds. Post-tax disposal proceeds were $1.6bn.
                                                                                                                                      26
BUSINESS UPDATE

Mark Cutifani

                  Minas-Rio – First Ore on Ship (FOOS)Conveyors
                                                       at Iron OreatTerminal,
                                                                     Sishen iron
                                                                              Portore
                                                                                   of mine
                                                                                      Açu,
SIGNIFICANT PROGRESS ON CHANGE PLATFORM…

                                           • Functional Model…implemented and “indirects” reduced 33%.
   Organisation
                                           • Headcount………….….reduced by ~40% across the business.

                                           • Assets sold/closed(1)…reduced by 27 to 41…dealing with the tail.
        Portfolio
                                           • Major projects(2)…………………delivered 5 per key commitments.

                                            • Operating model……...….contributing to the productivity uplift.
       Business
                                            • Marketing model…..implemented with meaningful contribution.

Note: Movements stated are from 2012 to 2016.
(1) Since 2013, includes assets closed or placed on care and maintenance. Includes sale of Union announced in February 2017.
(2) Minas-Rio, Gahcho Kué, Barro Alto, Grosvenor, Boa Vista Fresh Rock (BVFR).
                                                                                                                               28
…DELIVERING MEANINGFUL PROGRESS SINCE 2012.

     Safety and                            • Safety…..incidents down 50% but more work needed on fatal risks.
    environment
                                           • Environmental incidents…down 85% due to upgrading standards.

                                           • Copper-equivalent production…….up 8%.
   Operational
  improvements                             • Copper-equivalent unit costs…down 31%.

                                           • Cost and volume improvements…$3.1bn delivered.
        Cash
      generation                           • Capital expenditure………………………..down 55%.

Note: Movements stated are from 2012 to 2016.
                                                                                                                29
PRODUCTIVITY IMPROVEMENTS ONGOING

                                                 110                          108

 (1) Includes benefits of portfolio upgrading.
 (2) Cu Equiv (Copper-equivalent) is calculated using long-term consensus parameters. Excludes domestic / cost-plus production. Production shown on a reported basis.
 (3) Unit cost includes only AA’s equity share of De Beers and Platinum. Excludes equity accounted assets and assets not in commercial production. Calculated using long-term   30
     consensus prices.
PORTFOLIO UPGRADING CONTINUED IN 2016
                       Portfolio upgrading                  MARGINS AND RETURNS
                                 Rustenburg
                                                             Portfolio clean-up of lower margin / shorter life
                                 Callide
                                                                assets will continue – Union disposal announced in
                                 Foxleigh
                                                                the past week.
                                 Niobium and Phosphates

Disposals(1)
                                 Exxaro
                                                             Niobium and Phosphates sold for $1.5bn.
                                 Tarmac Middle East

                                 Kimberley                   Value discipline maintained - offers on a number of
                                 Pandora                        other high quality assets rejected.
                                 Union

                                 Dartbrook
                                                             Moranbah, Grosvenor and Nickel assets to be
                                                                retained in quality asset mix.
                                 Thabazimbi
                                 Drayton
Restructure(2)                                               No further sales required for debt reduction.
                                 Snap Lake

                                 Twickenham
                                                             Asset quality and margins are the key drivers.
  (1) Includes completed and announced.
  (2) Includes assets closed and on care and maintenance.
                                                                                                                     31
BUILDING A RESILIENT BUSINESS

               De Beers                                            Platinum                            Copper            Bulks and Other Minerals

                       Jwaneng                                        Mogalakwena                                               Sishen
Botswana                                                                                                               Iron ore
                                                                                                        Los Bronces              Kolomela
                       Orapa                                          Amandelbult
                                                                                                                       and
                                                                                            Chile                                 Minas-Rio
                                                                                                                       manganese
                       Venetia                                                                                                   • Samancor
South Africa                                       South              • BRPM                            Collahuasi
                      • Voorspoed                  Africa                                                                         • SA Thermal
                                                                      • Mototolo                                                    (domestic)
                       Debmarine                                                                                                  SA Thermal
Namibia                                                               • Modikwa                                        Coal
                      • Namdeb                                                                                                      (export)
                                                                                                        Quellaveco
                                                                                            Projects                               Australia Met.
                       Gahcho Kué                                                                     • Sakatti                   Cerrejón
Canada
                      • Victor                     Zimbabwe           • Unki                                           Nickel      Barro Alto

Portfolio priorities

 Highest quality assets that will drive returns through the cycle and contribute meaningfully to free cash flow and dividends.
 Scalable assets that provide operational leverage and future potential.
 Diversification maintained across quality asset mix…exploring all options for our bulk assets in South Africa.
 Established global leadership positions underpinned by asset quality…developing positions with focus on quality.
 Rightsizing of overhead structures enabled by portfolio restructuring…retaining key skills leveraging quality asset potential.
                                                                                                                                                     32
Note: Assets listed do not form an exhaustive list of Anglo American’s mining operations.
2017 GUIDANCE

                Nujoma vessel, Debmarine Namibia
TARGETING A FURTHER $1BN IMPROVEMENT
Incremental EBITDA improvement ($bn)             2017 Targeting $1.0bn cost & volume improvement
                                                    $0.5bn in plan.

                                           4.1
                                                    ~$0.25bn identified.

                                                    ~$0.25bn work in progress.
                                1.0
                    1.5

                   Costs
                                                 2017 Focus – apply Operating Model disciplines
                    1.0
                                                    Optimising operational design & management.

        1.6
                  Volume                            Enhancing productivity.
                    0.5
                                                    Cost management.

    2013 - 2015    2016      2017 Target

                                                                                                   34
FINANCIAL GUIDANCE – KEY METRICS

      Financial metrics and net debt                                            2017F
                                                                                  $bn

      EBITDA cost and volume improvement                                           1.0

      Capex(1)                                                                    ~2.5

      Attributable free cash flow (based on average 2016 realised prices)         ~2.0

      Net debt (based on average 2016 realised prices)
DELIVERING CHANGE, BUILDING RESILIENCE

                 • Creating a high quality, long life asset portfolio.
  Operational
 improvement     • Operating model to help drive margins.

                 • Focused on cash flow generation.

                 • Disciplined capital management.
 Balance sheet
   discipline    • Reinstatement of dividend targeted for the end of 2017.

                 • Conservative debt ratios through the cycle.

                                                                             36
APPENDIX

           Platinum bars at the Precious Metals Refinery
COMMODITY AND PRODUCT PRICES
 Indexed prices (1 Jan 2015 = 1)

             Market Prices/FX       Ave 15       Ave 16
2.1                                                             2015                              2016                                                                                           Var.
                                                                                                                                                                                                Ave ‘15
          Iron Ore (CFR $/t)              56          58
                                                                                                                                                                                                  Vs.
2.0                                                                                                                                                                                             Ave ’16
          HCC Benchmark ($/t)            102         114
1.9       Copper (c/lb)                  249         221

1.8       ZAR / USD                    12.78       14.70
                                                                                                                                                                              Met Coal(1)       +24%
                    Average annual basket price
1.2                                                                                                                                                                        Thermal Coal(2) +5%

1.1
1.0                                                                                                                                                                                      (3)
                                                                                                                                                                                                (3)%
0.9                                                                                                                                                                                             +7%
                                                                                                                                                                                Iron   ore(4)
0.8                                                                                                                                                                             Copper          (11)%
0.7                                                                                                                                                                           Diamonds          (13)%

0.6                                                                                                                                                                           Platinum(5)       (8)%

0.5
0.4
 Jan 15       Mar 15        May 15        Jul 15       Sep 15        Nov 15    Jan 16       Mar 16       May 16         Jul 16       Sep 16       Nov 16        Jan 17

      Source: Thermal Coal – globalCOAL; Diamonds – De Beers Rough Price      Price line is equivalent to weighted average daily revenue for FY 2016 sales volumes.
      Index, Platinum, Copper & Nickel – London Metal Exchange; Met Coal –    (1) Met coal price line based on blended HCC spot and benchmark, PCI spot and API6 thermal coal.
      Platts Steel markets daily; Iron Ore – Platts 62% CFR China has been    (2) Coal RSA and Colombia.
      used in this instance as a generic industry benchmark.                  (3) Anglo American excludes Samancor, Niobium, Phosphates, Corporate and OMI. Includes Nickel, not shown on the
                                                                                   graph.
                                                                              (4) Iron ore price line based on CFR China.
                                                                              (5) Platinum basket price.
                                                                                                                                                                                                          38
EARNINGS SENSITIVITIES

  Sensitivities Analysis – 2016(1)                                                                      Impact of change ($m)

  Commodity / Currency                                          Change in price / exchange   Achieved         EBITDA

  Iron Ore                                                                    $10/t            64               397

  Hard Coking Coal                                                            $10/t            119              119

  Thermal Coal (SA)                                                           $10/t            60               188

  Thermal Coal (Australia)                                                    $10/t            55                39

  Copper(2)                                                                  10c/lb            225              123
  Nickel(3)                                                                  10c/lb            431               15
  Platinum                                                                  $100/oz            993              187
  Palladium                                                                 $100/oz            610              113

  Rhodium                                                                   $100/oz            680               22

  South African Rand                                                   ZAR / USD 0.10         14.70              32
  Australian Dollar                                                    USD / AUD 0.01          0.74              12

  Brazilian Real                                                       BRL / USD 0.10          3.48              20
  Chilean Peso                                                         CLP / USD 10.0          676               11
  Oil price                                                                $10 / bbl           44                90

  (1)   Reflects change on actual results for 2016.
  (2)   Includes copper from both the Copper business and Platinum Business Unit.                                               39
  (3)   Includes nickel from both the Nickel business and Platinum Business Unit.
OPERATING PERFORMANCE BY BUSINESS UNIT
                DE BEERS (US$/ct)(1)                           PLATINUM (US$/Pt oz)                             COPPER (C1 USc/lb)(2)                             NICKEL (C1 USc/lb)
                                         BWP                        -12%                  ZAR                                               CLP                                          BRL
                     -19%                10.89                                            14.70
                                                                                                                      -11%                  676                                          3.48
               83                                           1,508                                                                                                     -19%
Disposal /                                                                 1,330                              154
restructure

              73                                            1,420                        ~1,400               145                           ~145              431
                             67                                            1,276                                              137                                            350
                                           ~60                                                                                                                                           ~340

              2015          2016         2017F              2015           2016           2017F               2015           2016          2017F             2015            2016        2017F

                KUMBA (FOB US$/t)                            MINAS-RIO (FOB US$/t)(3)                      AUSTRALIAN COAL (US$/t)(4)                        SA COAL EXPORT (US$/t)(5)
                                         ZAR                                               BRL                                              AUD                                           ZAR
                     -13%                14.70
                                                                    -53%                   3.48                        -7%                  0.74
                                                                                                                                                                      -13%                14.70
                                                                                                                 55

              31                           ~30                60                                                                             ~55                 39                        ~35
                             27                                                                                  54            51                                               34
                                                                             28            ~27

              2015          2016         2017F              2015           2016           2017F                2015           2016         2017F               2015           2016        2017F
      Note: Unit cost guidance for 2017 based on average 2016 exchange rates. Unit costs all exclude royalties include only direct support costs.
      (1) De Beers unit costs are based on total production and operating costs and have been restated to exclude depreciation. Normalised for Snap Lake (C&M) and Kimberley disposal.
      (2) Copper normalised for Anglo American Norte disposal.
      (3) Minas-Rio unit costs are on a wet basis.
      (4) Coal Australia FOB/t cash cost in USD excludes Callide, royalties and study costs; normalised for Foxleigh and Drayton.
                                                                                                                                                                                                  40
      (5) Coal RSA FOB/t cash cost in USD comprises RSA Trade only, excludes royalties.
OPERATING PERFORMANCE BY KEY ASSET(1)
JWANENG(2) (US$/ct)                                     ORAPA(3) (US$/ct)                                LOS BRONCES(4) (C1 USc/lb)                        COLLAHUASI(4) (C1 USc/lb)
                                                                            +18%                                             +5%

                       -22%                                                                                                                                                  -19%

      40                                                   34                      33                                                       ~165            190
                                                                                            ~31             145        148          156
                                                                      28
                 27                    ~27                                                                                                                             137
                              21                                                                                                                                                     111     ~115

      2012      2015          2016    2017F              2012        2015          2016   2017F             2012      2015          2016    2017F          2012       2015           2016    2017F

VENETIA (US$/ct)                                        DBMN (US$/ct)                                      MOGALAKWENA                                      AMANDELBULT (US$/Pt oz)
                       -15%                                                                                (US$/Pt oz)
                                                                            -5%                                               -8%                                              -9%

       67
                 55                                                                                        1,855                                            1,837
                               47                        230        202                                                                     ~1,500
                                        ~45                                        191     ~190                       1,369         1,262                              1,382         1,256   ~1,250

      2012      2015          2016     2017F            2012        2015          2016    2017F             2012      2015          2016    2017F           2012       2015          2016    2017F

BARRO ALTO (C1 USc/lb)                                  AUSTRALIAN UG (US$/t)                              CERREJON (US$/t)                                 SISHEN (US$/t)
                       -23%                                                                                                                                                   -12%
                                                                                                                             -10%

      620                                                                  +13%
                                                                                                             39                                               39
                 453                                     113                                                           31                                               33                    ~30
                                                                                                                                     28      ~30                                      29
                               351     ~330
                                                                     45            51       ~55

      2012      2015          2016     2017F            2012        2015          2016    2017F             2012      2015          2016    2017F           2012       2015          2016    2017F
(1)    2016 unit cost are shown on a nominal basis. 2017 unit costs calculated using average 2016 exchange rates. Unit costs all exclude royalties include only direct support costs.
(2)    Jwaneng P&L cash costs increase in 2017 as a result of increased expenditure in the income statement for waste stripping for Cut-8 as first ore is mined in 2017 (i.e. reduction in
       capitalised waste associated with Cut-8).                                                                                                                                                      41
(3)    Increase at Orapa reflects lower production to meet market demand.
(4)    Los Bronces and Collahuasi C1 unit cost shown including by-product credits.
PRODUCTION OUTLOOK(1)

                                             Units                                 2015                      2016                    2017F                     2018F                       2019F

Diamonds(2)                                     Mct                                   29                        27                   31-33

Platinum(3)                                    Moz                                   2.3                       2.4              2.35-2.40                        ~2.5                      ~2.1(4)
                                                                                                                          (Previously 2.4-2.5)      (Previously 2.5-2.6)

Copper (5)                                        Kt                                 709                      577                 570-600                630-680(6)                   590-650

Metallurgical coal(7)                            Mt                                   21                        21                   19-21                     20-22                       20-22
                                                                                                                           (Previously 24-25)        (Previously 23-24)

Thermal coal(8)                                  Mt                                   28                        29                   29-31                     29-31                       29-31
                                                                                                                           (Previously 28-30)        (Previously 28-30)

Iron ore (Kumba)(9)                              Mt                                   43                        41                   40-42                     40-42                       40-42
                                                                                                                             (Previously ~40)          (Previously ~40)

Iron ore (Minas-Rio)(9)                          Mt                                     9                       16                   16-18                     15-18                  22-26.5
                                                                                                                           (Previously 19-21)        (Previously 22-24)

Nickel                                            Kt                                  30                        45                      ~45                       ~45                        ~45
                                                                                                                           (Previously 42-45)        (Previously 45-47)

(1)   All numbers are stated before impact of potential disposals.
(2)   Includes 100% of volumes from JOs with the exception of Gahcho Kué, which is on an attributable 51% basis. Production beyond 2017 subject to trading conditions.
(3)   Produced ounces. Includes production from JOs and third parties.
(4)   Decline from 2018 due to Rustenburg POC, which will be processed based on a tolling arrangement from 1 November 2018 and therefore is excluded from production guidance.
(5)   Copper business unit only. On a contained-metal basis. Reflects impact of Anglo American Norte disposal and closure of Collahuasi oxides (combined 40kt impact in 2015 and 120ktpa
      thereafter). 2017-2019 guidance includes production for El Soldado of 50-60kt in each year.
(6)   Increase from 2017 reflects expected temporary grade increase.
(7)   Reflects the impact of the sale of Foxleigh, completed on 29 August 2016 (2016 impact of ~0.7Mt and ~2Mt thereafter).
(8)   Export South Africa and Colombia.
(9)   Kumba excluding Thabazimbi. Kumba on a dry basis and Minas-Rio on a wet basis.
                                                                                                                                                                                                     42
ORGANISATION RESTRUCTURING – ON TRACK
Employee and contractor numbers

                                            Support       Operations

                                  -39%
                       162,000
     157,000
                                  151,000
                                  13,000
                                                  128,000
                                                      11,500

                                                                       95,000   95,000
                                                                        8,700    Other
                                                                                  Coal

                                                                                Iron ore

                                                                                De Beers

                                                                                Copper

                                                                                Platinum

      2012              2013       2014               2015             2016      2016

                                                                                           43
You can also read