Consumer Demand for Organic Milk Continues to Expand-Can the U.S. Dairy Sector Catch Up?
←
→
Page content transcription
If your browser does not render page correctly, please read the page content below
A publication of the
                                                                                                     Agricultural & Applied
The magazine of food, farm, and resource issues                                                      Economics Association
1st Quarter 2015 • 30(1)

Consumer Demand for Organic Milk
Continues to Expand—Can the U.S. Dairy
Sector Catch Up?
Catherine Greene and William McBride
JEL Classification: Q1, Q11, Q13
Keywords: Conventional Dairy, Costs of Production, National Organic Standards, Organic Dairy, Pasture

The U.S. Department of Agriculture’s (USDA) Market                              states still play large roles in organic dairy production.
News reported widespread concern in 2014 about tight-                               Organic dairy pastures are beginning to disappear in
ening organic dairy supplies, with supermarkets in many                         California due to the devastating drought over the last sev-
parts of the United States posting signs about organic milk                     eral years. Organic dairy producers in California are also
shortages by the end of the year. U.S. food retailers and                       facing high organic feed grain prices and strong compe-
milk processors have informed customers that they can’t                         tition for their land from other high-value commodities,
meet demands for organic milk a number of times since the                       which could weaken organic dairy production in that state
organic dairy sector gained traction with consumers over a                      (Thomas, 2014). Even if California production declines,
dozen years ago. The number of certified organic milk cows                      continuing development of organic dairy production in
in the United States increased rapidly between 2000 and                         the traditional milk-shed states, lower feed grain prices,
2008—to over 250,000 organic milk cows (3% of the U.S.                          and diversity in the business models used for organic dairy
total)—and then stagnated through 2011, according to                            production could support expansion of the U.S. organic
USDA’s most recent estimate (USDA Economic Research                             dairy sector.
Service (ERS), 2013).
    Some organic dairy producers exited the sector in 2009                      Consumer Base for Organic Dairy Continues to Widen
when processors cut back on organic dairy contracts dur-
                                                                                Organic dairy products are now the second leading food
ing the downturn in the U.S. economy. Organic milk de-
                                                                                category—after fresh fruits and vegetables—for U.S. sales
mand rebounded quickly, but movement back into organic
                                                                                of organic food. Numerous studies have underscored con-
production is complicated by the three-year transition
                                                                                sumer preferences for organically produced food because
period required for land that is in conventional produc-
                                                                                of their concerns regarding the environment, animal wel-
tion. Expanding milk demand, along with recent drought
                                                                                fare, and their own health. Although nutritionists have not
conditions and high organic feed grain prices, especially in
                                                                                yet reached a consensus about whether organic food offers
California, are also playing roles in the current shortages.
                                                                                more nutrients than conventional food, there is evidence
    U.S. milk production began dispersing from its concen-                      that enhanced nutrition is associated with organic dairy
tration in the Northeast, Upper Midwest, and Central re-                        products. A recent meta-analysis of studies during 2009-
gions—the traditional U.S. milk shed—many decades ago                           11 comparing the nutrient quality of organic and conven-
(Jesse, 2002). California is the top conventional dairy state,                  tional dairy products found that organic dairy products
and also became the top organic dairy state in 2008 with                        contain significantly higher protein, α-linolenic acid (ALA,
the largest number of certified organic milk cows. Although                     C18 : 3 n-3), total omega-3 fatty acid, conjugated linoleic
California had nearly a quarter of the certified organic milk                   acid, and other nutrients. The meta analysis concluded
cows in the United States in 2011, traditional milk-shed                        that organic dairy farming leads to enhanced nutrient

©1999–2015 CHOICES. All rights reserved. Articles may be reproduced or electronically distributed as long as attribution to Choices and the Agricultural &
Applied Economics Association is maintained. Choices subscriptions are free and can be obtained through http://www.choicesmagazine.org.

1                  CHOICES         1st Quarter 2015 • 30(1)                                                                                  AAEA-0115-712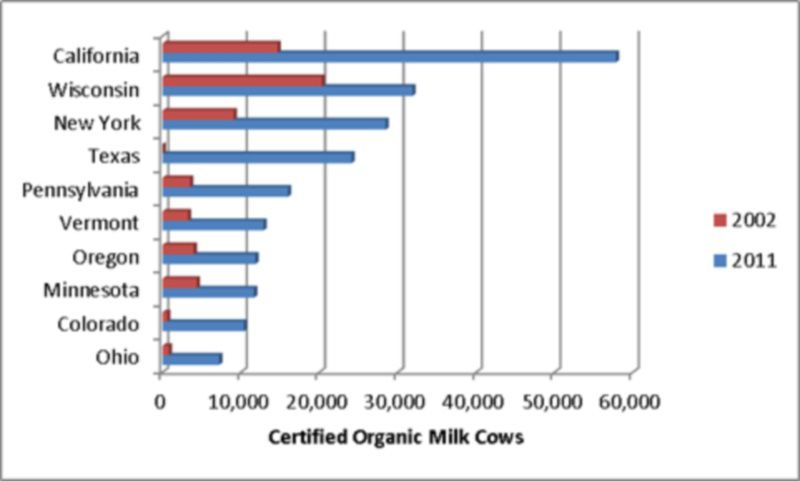
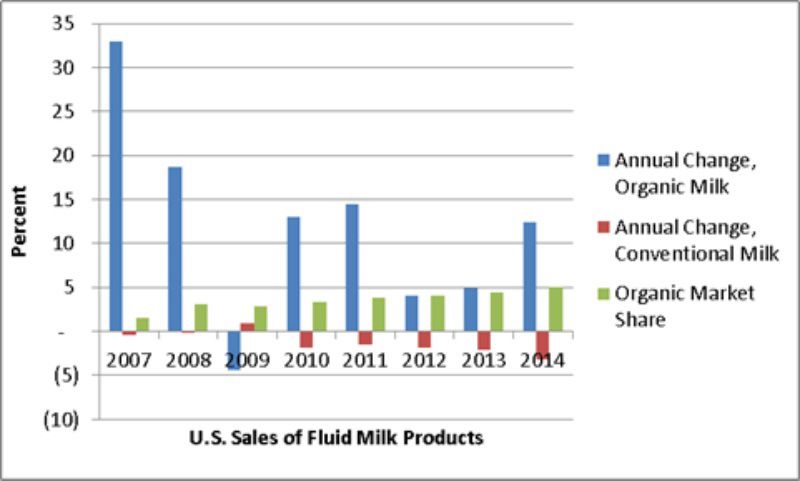
quality due to the higher fresh for-
age intake of organic cows (Palupil et            Figure 1: U.S. Market Penetration of Organic Milk, 2007-2014
al., 2012). A subsequent study—the
first large-scale, nationwide study of
fatty acids in U.S. organic and con-
ventional milk—found that con-
sumption of predominantly organic
dairy products may enhance public
health by decreasing dietary omega-6
to omega-3 ratios from today’s gener-
ally unhealthy levels (Benbrook et al.,
2013).
    Organic products have shifted
from being a lifestyle choice for a
small share of consumers to being
consumed at least occasionally by
a majority of Americans. Similarly,
mass market retailers, rather than nat-           Source: AMS-USDA, Federal Milk Market Order statistics.
ural food stores, are now the top sales           Note: Estimates for 2014 are for the first half only.
channels for organic food. Walmart,
the largest food retailer in the United         dairy products which take more              Unfortunately, just as U.S. organic
States, and other supercenters that             pounds of milk to produce. Most of          dairy production was ramping up,
often target budget-conscious con-              the decline in U.S. dairy consump-          the downturn in the U.S. economy
sumers, are continuing to increase              tion is due to the substantial drop         started in late 2007 and organic milk
their organic food offerings—both               in milk consumption during this pe-         sales actually declined 4% between
Walmart and Target announced new                riod, and Americans now consume             2008 and 2009—the only time in re-
organic food initiatives in 2014. Also,         only about 75% of the amount of             cent years that sales of conventional
USDA Market News recently report-               dairy products recommended in the           milk showed positive growth (Figure
ed that a national drugstore chain              Federal dietary guidelines designed to      1). Consumer demand for organic
added organic milk to its cooler sec-           promote health and prevent diseases.        milk rebounded quickly in 2010,
tion in 2014.                                   The decline in recent years is illustrat-   but organic dairy processors had not
    In 1997—the year that USDA                  ed by USDA estimates of fluid milk          renewed their contracts with many
published its first proposed rule to es-        product sales, which show negative          producers, and conversion back to
tablish national organic standards—             annual growth for conventional milk         organic was a slow process.
industry estimates pegged retail                for most years between 2007 and the             While the current organic milk
sales of organic milk, yogurt, butter,          first half of 2014 (Figure 1).              shortage also reflects impacts from
cheese, and other dairy products at                 The organic market share of total       the widespread drought in 2012 and
$382 million in the United States               fluid milk sales in the United States       higher prices for organic feed grains
(Nutrition Business Journal, 2013).             has increased steadily—from 1.92            in recent years, growth in the milk
Retail sales of organic dairy products          percent in 2007 to nearly 5 percent         sector has routinely been hampered
more than tripled between 1997 and              in 2013—although annual growth              by supply shortages. USDA’s ERS
2002, to $1.2 billion, and are forecast         in organic milk sales has fluctuated.       conducted a nationwide survey of
to reach $5.5 billion in 2014.                  The annual growth in organic milk           all certified organic processors and
    In contrast, overall U.S. consump-          sales peaked at 33% in 2007. Or-            manufacturers in 2004, and inquired
tion of milk, yogurt, butter, cheese            ganic dairy processors had recruited        about which organic products were
and other dairy products has fallen             new organic dairy farmers to add            in short supply. Among the catego-
from 339.2 pounds per person in                 capacity and pushed hard for them           ries which had shortages—milk, feed
1970 to 275.9 pounds in 2012 (Bent-             to transition to organic production         grains, produce, and soybeans—milk
ley, 2014), although total milk pro-            before June 2007, when an organic           had the most critical shortage, with
duction increased during this period            regulatory provision that eased whole       26% of the processors reporting milk
due to increasing consumption of yo-            herd conversion from conventional to        shortages (Greene et al., 2009).
gurt, cheese, and other manufactured            organic production was set to expire.

2             CHOICES        4th Quarter 2015 • 30(1)
Landmark Policy Change on • Animals must obtain a minimum pasture-based feeding was more com-
Pasture in 2010 of 30% dry-matter intake from mon on smaller dairy farms and that
grazing pasture during the grazing 4% of organic dairy farms never used
The historical focus of organic ag- season; pasture (McBride and Greene, 2007).
riculture is on ecologically based
farming, and the national organic • Producers must have a pasture
management plan and manage Organic Dairy Production Still
standards, published by USDA in
2000, maintain this focus. USDA pasture as a crop to meet the feed Regionally Diverse
regulations require that organic farms requirements for the grazing ani- Fast-growing consumer demand and
be “managed in accordance with the mals and to protect soil and water large price premiums for organic
Act and regulations in this part to re- quality; and, milk have made the organic dairy sec-
spond to site-specific conditions by • Livestock are exempt from the tor a bright spot for many producers
integrating cultural, biological, and 30% dry-matter intake require- over the last dozen years. Researchers
mechanical practices that foster cy- ments during the finish feeding at ERS examined milk prices in the
cling of resources, promote ecological period, not to exceed 120 days. mid-2000s, using Nielsen supermar-
balance, and conserve biodiversity” Livestock must have access to pas- ket scanner data, and found that the
(USDA Agricultural Marketing Ser- ture during the finishing phase. price for organic milk over conven-
vice, 2000). The national standards In announcing the new pasture re- tional milk ranged from 72% above
virtually exclude the use of synthetic quirements, Agriculture Secretary the conventional price in Western
chemicals, antibiotics, and hormones Tom Vilsack emphasized that it “will states to 126% above the conven-
in crop production, and prohibit the give consumers confidence that or- tional price in the East (Greene et
use of antibiotics and hormones in ganic milk or cheese comes from cows al., 2009). The national average price
livestock production. raised on pasture, and organic family premium for organic milk was 98%
The USDA national organic stan- farmers the assurance that there is above the conventional price in 2004.
dards also require organic livestock one, consistent pasture standard that Organic milk prices in 2006 varied
production systems to accommodate applies to dairy products” (USDA substantially by fat content, container
an animal’s natural nutritional and Office of Communications, 2010). size, and branding, with organic price
behavioral requirements, to ensure Small-scale dairy farmers, in particu- premiums for a half-gallon of milk
that dairy cows and other ruminants lar, had been concerned that they ranging as high as 109% for name-
have access to pasture. However, weren’t on a level playing field with brand organic milk above store-brand
regulations published in 2000 lacked large-scale corporate dairies. USDA conventional milk. In contrast with
specific criteria that organic certifiers surveyed U.S. organic dairy farmers conventional milk prices, organic
could use to measure whether organic in 2005, prior to implementation of milk prices were estimated to increase
producers were complying with the these requirements, and found that as the fat content declined.
law. Although organic processors
used images of cows grazing in pas- Figure 2: Top Ten Organic Dairy States Reflect Regional Diversity
ture to sell milk to consumers, not
all the organic dairies were providing
their cows with pasture. A number of
organic stakeholder groups—includ-
ing organic dairy associations in the
Northeast and other traditional milk-
shed states—urged USDA to add spe-
cific enforcement criteria for the use
of pasture.
In June 2010, USDA published
new rules on organic pasture and re-
quired compliance within a year. The
pasture rules require that:
• Animals must graze pasture dur-
ing the grazing season, which
must be at least 120 days per year; Source: USDA, Economic Research Service, based on information from
USDA-accredited State and private organic certifiers.
3 CHOICES 4th Quarter 2015 • 30(1)U.S. organic dairy production communities by protecting the health ERS researchers compared or-
had just started two decades ago of the family farm—working toward ganic and conventional dairy produc-
when USDA reported that there were both economic and environmental tion in 2005 and 2010. The primary
6,000 certified organic dairy cows na- sustainability.” difference in the production practices
tionwide. Over the period between Aurora Organic Dairy owns and used by organic versus conventional
2002 and 2011—USDA’s most re- operates 5 organic dairy farms in dairies is in the feeding system (Mc-
cent estimate—the United States Colorado and Texas, with a total herd Bride and Greene, 2007). In 2005,
expanded from 67,000 organic milk of more than 22,000 organic dairy more than 60% of organic operations
cows to 255,000 organic milk cows, cows, and an organic dairy processing reported using pasture-based feed-
approximately 3% of total dairy plant in Plattesville, Colo. Aurora Or- ing that provided more than half of
cows. USDA’s Census of Agriculture ganic Dairy is the leading producer seasonal forage (during the grazing
reported that organic dairy farms ac- and processor of store-brand organic months) from pasture, compared to
counted for 5% of total U.S. dairy milk and butter for U.S. retailers, and just 18% for other operations. The
farms in 2012. Most of this growth develops initiatives “to be a respon- growth hormone recombinant bovine
took place prior to 2008, when the sible corporate citizen and to be good somatatropin (rbST) is not available
sector contracted with the downturn stewards of our natural resources.” to organic producers, but was used by
in the economy. 17% of conventional operations, who
Horizon Organic began process- also were much more likely to utilize
California was the top state for ing organic milk 20 years ago and
both organic and conventional dairy regular veterinary services and a nu-
currently sources milk from nearly tritionist. The use of these practices
production in 2011. Wisconsin and 700 certified organic family farms in
California traded places between likely contributed to the significantly
21 states. Horizon Organic indicates higher production per cow on con-
2002 and 2011 as the top state with that “our family farmer partners sup-
the most organic dairy cows (Figure ventional versus organic operations.
ply 99% of our milk. Horizon Or- Organic operations averaged about
2). The top 10 states with the most ganic also owns and operates a farm
organic dairy cows were still region- 13,600 pounds of milk per cow in
in Maryland that supplies 1% of our 2005, versus nearly 19,000 pounds
ally diverse in 2011, and all had sub- milk.” Horizon Organic also owned
stantial increases in the number of or- on conventional operations.
large dairy farms in Colorado and
ganic dairy cows during that period. Idaho until recently. According to the 2005 ERS analy-
Various organic dairy business sis of national dairy survey data, to-
models are in play in the United States. Organic Dairies are Much Different tal economic costs were significantly
While the majority of organic dairy higher for organic dairy and soybean
than Conventional Dairies operations than for conventional op-
farms are small-scale family farms, the
United States also has large-scale cor- USDA surveyed organic milk produc- erations. With an average price pre-
porate dairy farms as well. The chal- ers in 2005 and again in 2010 as part mium of $6.69 per hundredweight
lenges involved in meeting USDA’s of USDA’s annual survey of farm and (cwt., which is 100 pounds of milk)
strong pasture standard implemented ranch operators the Agricultural Re- for organic milk, organic milk pro-
in 2011 may dampen the movement source Management Survey (ARMS). ducers covered most of the additional
to large-scale dairy farms seen in con- These surveys sample organic dairy operating costs of organic production
ventional dairy production. producers at much higher rates than in 2005. The value of production mi-
their occurrence in the population in nus operating costs was higher for or-
The three largest organic milk order to develop sufficient data for a ganic producers than for conventional
processors in the United States— comparison of practices and costs on producers in 2005 and 2010, for all
Organic Valley, Horizon, and Au- conventional and organic farms. Or- size groups (Table 1). However, the
rora—illustrate different approaches ganic milk producers usually begin as premium didn’t cover the total costs
to organic dairy production. Organic operators of conventional dairies be- of organic producers, which includes
Valley is a farmer-owned coopera- fore undergoing what can be a chal- the opportunity cost of unpaid labor,
tive, with 1,779 participating farm lenging and costly transition process. in either year for any size group. The
families in 2014 that sets member- Conventional dairy producers need value of production minus total eco-
determined pay prices and provides to adjust their approach to dairy nomic costs was also negative for most
equity ownership in a leading na- herd management during the transi- size groups in conventional produc-
tional food brand. Organic Valley tion to comply with USDA organic tion. Only the largest size groups of
indicates that “the central mission of standards. conventional producers had positive
our cooperative is to support rural returns above total economic costs.
4 CHOICES 4th Quarter 2015 • 30(1)Table 1: U.S. Milk Production Costs and Returns per Hundredweight Sold, by Size and Type of Operation, 2005 and 2010
Organic
Item Year Fewer than 50‐99 100‐199 200 or more 500‐999 1,000 Cows All
50 Cows Cows Cows Cows Cows or more Sizes
$/Hundredweight Sold
Value of Production, Minus Operating Costs1 2010 8.08 9.16 7.82 10.56 N/A N/A 9.18
1
Value of Production, Minus Operating Costs 2005 8.72 8.41 7.65 7.19 N/A N/A 7.92
2
Value of Production, Minus Total Costs 2010 ‐19.38 ‐11.4 ‐7.61 ‐0.43 N/A N/A ‐8.42
Value of Production, Minus Total Costs2 2005 ‐12.91 ‐8.45 ‐5.63 ‐1.2 N/A N/A ‐6.19
Percent of Farms 2010 49 34 12 5 N/A N/A ‐‐
Percent of Farms 2005 45 42 8 5 N/A N/A ‐‐
Percent of Milk Production 2010 19 27 20 34 N/A N/A ‐‐
Percent of milk production 2005 18 33 12 37 N/A N/A ‐‐
Conventional
Item Year Fewer than 50‐99 100‐199 200‐499 500‐999 1,000 Cows All
50 Cows Cows Cows Cows Cows or more Sizes
$/Hundredweight Sold
Value of Production, Minus Operating Costs1 2010 2.52 3.64 4.16 3.94 5.29 5.63 4.82
Value of Production, Minus Operating Costs1 2005 5.57 4.62 5.69 5.94 5.49 6.8 5.93
Value of Production, Minus Total Costs2 2010 ‐20.03 ‐11.24 ‐5.72 ‐3.61 ‐0.04 1.78 ‐2.58
2
Value of Production, Minus Total Costs 2005 ‐12.22 ‐7.94 ‐3.62 ‐0.67 0.49 2.95 ‐1.39
Percent of Farms 2010 29 36 19 9 4 3 ‐‐
Percent of Farms 2005 31 35 19 9 3 2 ‐‐
Percent of Milk Production 2010 4 11 13 14 16 41 ‐‐
Percent of milk production 2005 5 14 16 18 15 32 ‐‐
N/A = not applicable.
1
Operating costs include feed, veterinary services, medicine, bedding, fuel, electricity, repairs, certification, and marketing services.
2
Total costs include operating costs, plus allocated overhead (hired labor, opportunity cost of unpaid labor, capital recovery of
machinery and equipment, opportunity cost of land (rental rate), taxes, insurance, and general farm overhead).
Notes: Coefficients of variation (CVs) were checked for the category totals: gross value of production, and feed, operating,
allocated overhead, and total costs. All CVs were less than 25 percent.
Source: USDA‐Economic Research Service, based on data from USDA Agricultural Resources Management Surveys in 2005 and 2010.
The trend toward larger farms in accounted for a slightly smaller per- economy experienced a recession, an-
conventional dairy production was centage of total production—34%— nual sales growth is still in the high
evident in the five years between in 2010. single digits. The growing scientific
the two USDA organic surveys. The consensus on the nutritional benefits
largest size group for conventional The Future of Organic Milk of organic milk, and wider availabil-
production—1,000 cows or more— Production ity in mainstream markets, could help
represented 2% of conventional dairy push consumer demand higher.
farms and had 32% of total milk pro- As is always the case, the future of
organic milk production is largely in Another bright note for organic
duction in 2005 (Table 1). In 2010, dairy producers is that a recent study
the largest group contained 3% of the hands of the consumer. Without
growing demand, production will of U.S. consumer demand for milk
conventional farms in 2010 repre- shows that organic milk demand is
senting 41% of total production. not expand. Consumer demand for
organic milk expanded rapidly for price elastic, and that the substitution
Although the larger size groups in pattern between organic and conven-
the organic dairy sector had higher several decades, jumping from a niche
market in natural foods stores to tional milk with differing fat content
economic returns, a trend toward shows greater movement toward or-
concentration of production was not shelf-space allocations in most main-
stream food stores. In recent years, ganic milk than back to conventional
as evident. The largest size group for milk (Li, Peterson, and Xia, 2012).
organic production—200 or more even the large retailers, like Walmart
and Target, have been responsive to With stricter pasture rules raising
cows—represented 5% of the dairy costs in the organic dairy sector, high-
farms in 2005 and accounted for consumer demand for organic milk.
While U.S. sales of organic milk have er producer prices for organic milk
37% of total production. The largest are likely needed to attract more dairy
organic size group still represented dropped from the double-digit an-
nual increases shown until the general farmers into this sector. Even prior
5% of the dairy farms in 2010, but to USDA enforcement of stricter
5 CHOICES 4th Quarter 2015 • 30(1)pasture rules in 2011, ERS analysis Greene, C., C. Dimitri, B. Lin, W. Palupil, E., A. Jayanegara, A. Ploeger,
of the organic dairy sector in 2005 McBride, L. Oberholtzer, and T. and J. Kahl. 2012. “Comparison
and 2010 found that none of the size Smith. 2009. “Emerging Issues in of nutritional quality between
groups covered total economic costs the U.S. Organic Industry,” Eco- conventional and organic dairy
in either year. The discrepancy was nomic Information Bulletin EIB- products: a meta-analysis,” Jour-
largest for the smaller farms, partly 55, U.S. Department of Agricul- nal of the Science of Food and Ag-
because they had higher labor costs ture, Economic Research Service, riculture, Vol. 92, Issue 14, pp.
and lower yields from using more June. 2774-2781. Available online:
pasture for feed. Horizon Organic, a division of The http://onlinelibrary.wiley.com/
Even with stronger USDA pas- WhiteWave Foods Company, doi/10.1002/jsfa.5639/full.
ture requirements, coexistence of or- Denver, Colo. Available online: Thomas, M. 2014. “The drought is
ganic producers with very different http://www.horizondairy.com/ destroying California’s organic
business models is likely to persist Jesse, E. 2002. “Facing up to the dairy farms,” Grist, September 11.
in the organic dairy sector to some Western Dairy Boom,” College U.S. Department of Agriculture,
degree. Some analysts argue that or- of Agricultural and Life Sciences, Agricultural Marketing Service
ganic sector expansion that includes Cooperative Extension, Univer- Dairy Market News. Various is-
large-scale farms with lower costs can sity of Wisconsin-Madison, Re- sues. U.S. Department of Agri-
make organic food—which has less thinking Dairyland Report Series, culture, Agricultural Marketing
pesticide residue and other positive No. 3, September. Service, https://www.marketnews.
attributes—more affordable for low- usda.gov/mnp/da-home
income consumers (Johnson, 2013). Johnson, J. 2013. “The Wal-Mart
USDA’s organic regulatory program Effect on Organics: A Defense of U.S. Department of Agriculture,
plays a key role in setting and enforc- Large-Scale Organic Production,” Agricultural Marketing Service.
ing strict standards, and ensuring that Duke Environmental Law & Policy 2000. “National Organic Pro-
all producers demonstrate compliance Forum, Vol. XXIV:241-278, Fall. gram; Final Rule, 7 CFR Part
with the rules. These rules provide a Li, X., H. Peterson, and T. Xia. 2012. 205,” Federal Register, December
framework for future innovations in “Consumer Demand for Organic 21. Available online: http://www.
organic dairy production systems. In Fluid Milk by Fat Content,” Jour- usda.gov/nop.
particular, research is needed on ways nal of Food Distribution Research, U.S. Department of Agriculture, Eco-
to lower the costs and improve the Vol. 43, Issue 1, March. nomic Research Service. 2013.
quality of pasture-based dairy systems McBride, W., and C. Greene. 2007. “Organic Production Data Prod-
in the challenging climates and con- “Characteristics, Costs, and Issues uct,” U.S. Department of Agri-
ditions across the country. for Organic Dairy Farming,” Eco- culture. Available online: http://
nomic Research Report ERR-82, www.ers.usda.gov/data-products/
For More Information U.S. Department of Agriculture, organic-production.aspx
Aurora Organic Dairy, Boulder, Colo. Economic Research Service. U.S. Department of Agriculture, Of-
Available online: http://www.au- Nutrition Business Journal. 2013. Ta- fice of Communications. 2010.
roraorganic.com ble 22—U.S. Organic Food Sales News Release. “USDA Issues
by Product ($Mil) 1997-2008, Final Rule on Organic Access to
Benbrook, C., G. Butler, M. Latif, C.
2009e-2014e. Pasture,” February 12.
Leifert, and D. Davis. 2013. “Or-
ganic Production Enhances Milk Organic Valley, La Farge, Wis. Avail- Catherine Greene (cgreene@ers.usda.
Nutritional Quality by Shifting able online: http://organicvalley. gov) and William McBride (wmc-
Fatty Acid Composition: A United coop. bride@ers.usda.gov) are Senior Econo-
States–Wide, 18-Month Study.” mists at the Economic Research Service,
PLoS ONE 8(12): e82429. Avail- U.S. Department of Agriculture. The
able online: doi:10.1371/journal. views here do not necessarily represent
pone.0082429. the views of the Economic Research Ser-
Bentley, J. 2014. “Trends in U.S. Per vice nor the U.S. Department of Agri-
Capita Consumption of Dairy culture.
Products, 1970-2012,” Amber
Waves, U.S. Department of Agri-
culture, June 2.
6 CHOICES 4th Quarter 2015 • 30(1)You can also read