2020 REGIONAL OPTIMISATION DAY - MCCULLOUGH FARM PARTNERSHIP LTD NZ SUPREME WINNER BEST WAIKATO FARM PERFORMANCE LOWEST ENVIRONMENTAL IMPACT ...
←
→
Page content transcription
If your browser does not render page correctly, please read the page content below
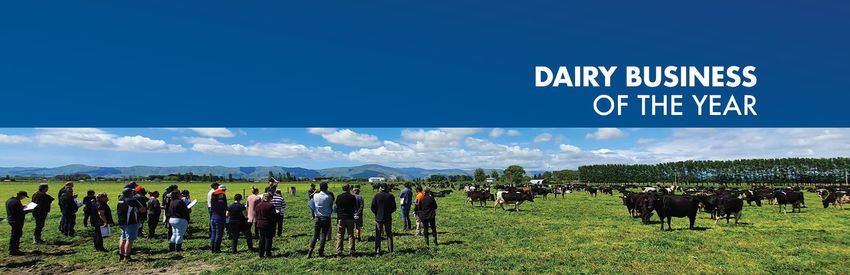
2020 Regional Optimisation Day

   McCullough Farm Partnership Ltd
       Richard & Nadine McCullough

      100 Kentucky Road, Karapiro – S/N OCD 075

         NZ Supreme Winner
   Best Waikato Farm Performance
    Lowest Environmental Impact
Key Performance Indicators Summary
Please Note: benchmarks used in this report should be considered as indicative only and may or may not
precisely reflect the regional average.

 Farm System                                                 Farm            District         New Zealand
                                                            2018/19          Average            Top 10%
    Usable Hectares                                           305              265                288
    Milking Hectares                                          245              217                244
    Peak Milking Cows                                         630              690                807

 People Productivity                                         Farm         DBOY          District           New
                                                            2018/19      National       Average          Zealand
                                                                         Average                         Top 10%
    People Investment per Cow ($)                             $495        $485              -               -
    Cows per Full Time Equivalent (50hr FTE)                   267         176             142             177
    Milk Solids per worked hour                              45.55        29.71             -               -
    Training spend per FTE in Dollars ($)                     $212        $338              -               -
    Training spend per FTE in Time (hrs)                      3.82         6.28             -               -
    Unplanned Costs per FTE ($)                               $699        $476              -               -
    Unbudgeted Days Lost per FTE                              0.42         3.16             -               -
    Labour Turnover - Management Staff (%)                     0%           4%              -               -
    Labour Turnover - Non-Management Staff                     0%          22%              -               -
    % days lost due to injury per FTE                          0%           4%              -               -
    Rostered days off per annum per FTE                      107.73       61.41             -               -

 Environmental                                                Farm                                  DBOY
                                                             2018/19                              National
 Management                                                                                        Average
    Effluent Pond                                           Claylined                               Lined
    % of Farm Irrigated with Effluent                         54%                                    38%
    N Loading on Effluent Area (kg/ha)                         47                                    131
    KgMS/ha per KgN Loss/ha                                    34                                     53
    N Leached (kg/ha)                                          26                                     46
    N Conversion Efficiency (%)                               56%                                    29%
    Soluble N Use (kg/ha)                                      59                                    142
    P Loss (kg/ha)                                             0.6                                    1.4
    Olsen P Levels                                           Above                               At Optimum
                                                            Optimum
    Winter Cropping % of Farm                                  0%                                     3%
    Winter Soil Management                                   Formal                                 Formal
                                                            Standoff                               Standoff
   Green House Gases (Total CO2 Equivalents)                  8,647                                  3,660
Livestock Management                           Farm     District   New Zealand
                                              2018/19   Average      Top 10%
Peak Milking Cows                               630       690          807
Milksolids per Cow (kgMS/cow)                   443       423          477
Milksolids as % of Cow Liveweight                83        85           95
Milksolids per Milking Hectare (kgMS/ha)       1,140     1,450        1,579

Pasture &                                      Farm     District   New Zealand
                                              2018/19   Average      Top 10%
Feed Management
Annual Stocking Rate – milking area            2.57       3.35        3.25
Homegrown Grazed Feed as % of Diet              65         62          63
Total Feed Fed (tDM/cows)                      6.12       5.36        5.58
Grazed Feed Fed (tDM/cows)                     3.67       3.26        3.60
Homegrown Feed – Direct Costs ($/tDM)           87         80          96
Grazed Feed – Direct Costs ($/tDM)              52         51          64
Conserved Feed – Direct Costs ($/tDM)          187        220         251
Fodder Purchased – Direct Costs ($/tn)          0         323         307
Concentrate Purchased – Direct Costs ($/tn)    340        341         352

Profitability & Resilience                     Farm     District   New Zealand
                                              2018/19   Average      Top 10%
Milk Income per kgMS ($/kgMS)                   7.01      6.68          6.67
Total Assets Managed per Hectare ($/ha)        61,811    80,701       63,430
Gross Farm Income per Hectare ($/ha)           8,728     10,566       11,095
Operating Costs per Hectare ($/ha)             4,895     7,539         7,165
Earnings before Interest and Tax per Ha        3,834     3,025         3,934
Return on Total Asset (%)                        6.2       3.5           6.3
Operating Profit Margin (%)                     43.9      26.2          36.3
Gross Farm Income per kgMS ($/kgMS)             7.66      7.19          7.05
Operating Costs per kgMS ($/kgMS)               4.29      5.24          4.48
Cost of Production per kgMS ($/kgMS)            4.46      5.47          4.52
Cost of Production + Financing per kgMS ($)     6.24      6.60          5.55
Definitions of KPIs
UNDERSTAND WHAT YOU’RE COMPARING
It is important to have an understanding of how your physical and financial Key
Performance Indicators (KPIs), and the benchmarks you are comparing, are calculated. See
www.dboy.co.nz for more detail.

Gross Farm Income calculations for the DBOY competition are determined using an accrual
basis, which means that the gross farm income is calculated on the milk produced in the
season that is being analysed, times (multiplied by) the amount paid for the milk that was
produced in that same season. It is important to note that this differs from the actual gross
revenue that is received within the dairy farming enterprise, as income received in the
season being analysed includes last year’s deferred payments and a portion of the
payments received for the season being analysed.
When measuring financial performance within a production season to determine business
profitability, using non-accrual gross revenue is somewhat misleading when there is
significant season to season variation in payout, and/or above normal variability in weather
conditions, i.e. if the season prior to the production season being analysed had a higher
payout it would bump up the gross farm income received in the production season being
analysed. Because DBOY uses accrued income when calculating gross farm income, it
provides a truer representation of the income generated in the season being analysed, so
cost, production, and income, are more aligned.

Total Operating Costs is the total operating costs that are incurred during the production
season being analysed and adjusted for feed/supplements on hand at opening and closing
of the season, imputed (unpaid) labour and management, depreciation, and other expense
adjustments. Total Operating Costs does not include financing costs. This includes
adjustments for expenses paid in the year being analysed that relate to production from the
previous or coming year, such as prepaid fertiliser.

EBIT (Earnings Before Interest and Tax) per hectare is gross farm income minus total
operating costs or operating surplus +/- adjustments divided by usable hectares. EBIT per
hectare excludes all financing expenses.

Farm Working Expenses per kgMS (FWE/kgMS) is all physically paid expenses (real cash
payments). This gives an indication of cashflow but is not a comparable figure between
businesses. Adding financing cost to FWE/kgMS will provide the break-even point in terms
of cashflow, indicating the revenue required from milk and livestock sales to ensure there is
cash in the bank.

Operating Costs per kgMS (OC/kgMS) is the FWE +/- non-cash adjustments including
depreciation and imputed labour and inventory changes. This indicates the overall expense
of the business on a per kgMS basis. Adding financing costs to OC/kgMS provides the break-
even point for the full business or the income required from milk and livestock profit (gross
farm income per kgMS).
Operating Profit Margin represents the percentage of total farm income retained as profit
for interest payments, principal repayments, tax and true 'profit' (e.g. a 25% margin would
mean $0.25 for every dollar is available for paying interest, principal and tax). The higher the
OPM the more secure and resilient the business is. OPM target levels should be relative to
the farm system being operated, with high feed-input systems generally achieving lower
operating profit margins than low feed-input systems.
Cost of Production of a kgMS (COP/kgMS) is the Farm Working Expenses plus depreciation
and imputed labour +/- feed inventory changes, +/- livestock inventory changes minus
livestock purchases. This calculation includes the cost of producing milk, livestock and feed.
This is a key indicator of resilience, as having a low COP will enable a business to withstand
fluctuations in milk payouts. The cost of production/kg milksolids plus financing is
effectively the milksolids price the business requires to break even, as it combines both
COP/kgMS and debt servicing costs.

Return on Total Assets (ROTA) equals EBIT divided by total assets FARMED. The most
important measure of profitability is Return on Total Assets (ROTA). This is calculated by
dividing EBIT by the total value of all assets (both owned and leased). This generates a
profitability value which can be compared across all business types, and accounts for farms
with a lower milk production capability against those with a high milk production capability,
based on resources available to them. To maximise ROTA it is important not to over-
capitalise, as this in turn would require an increase in EBIT to achieve the same ROTA. The
capital includes: all land (milking and support), livestock, vehicles, plant and machinery,
and dairy company shares and other farm related shares and current assets.

Return on Asset (ROA) is EBIT minus lease fees divided by total assets OWNED. This is all
farm assets owned by the business, meaning it includes all assets whether financed or
owned outright and excludes all leases.

Return on Equity (ROE) is EBIT, less lease fees, less interest, divided by equity. ROE includes
all assets that are owned outright and excludes all leases and the financed portion of assets,
providing a comparison to money invested in the bank. ROE provides the most important
indicator of net wealth growth.

Grazed Feed and Conserved Feed Costs are calculated based on the total homegrown
feed costs, including costs such as pasture renovation, irrigation and fertiliser and
apportioned based on the proportion of homegrown feed that comes from grazed feed
versus conserved feed for the year. Conserved feed also includes the direct hay & silage
making costs of the business.
Agenda & Table of Contents

9.50am - Introductions
Welcome .............................................................................................................. 1
Health and Safety – Emergency Plan ......................................................................... 2
Sponsors Introduction............................................................................................ 4
Objectives of the Day.............................................................................................. 6
10.10am - Overview of the Farm System
Farm System and Farmers History ............................................................................ 7
10.30am - Sustainability Measures
People Leadership and Productivity ......................................................................... 8
Environmental Management ..................................................................................10
11.00am - Livestock and Pasture Farm Walk
Livestock and Production ......................................................................................12
Feed Management ................................................................................................13
11.40am - Profitability and Resilience Discussion
Profitability of the Business ....................................................................................14
Farm Business Snapshot ........................................................................................15
Discussion ...........................................................................................................16
12.10pm - Analysing Your Business
Entering DBOY 2021 ..............................................................................................21
12.30pm - Lunch Break
Lunch Break ........................................................................................................17
1.15pm - Informal Discussions with our Sponsor Partners
Progressing Your Business – Where to Start ..............................................................18
Welcome
Regional Optimisation Days are held on the DBOY20 Regional Winners' farms throughout
New Zealand during November. These field day events are a great day out and an excellent
opportunity to hear and learn from some of New Zealand's most resilient, sustainable and
innovative dairy farmers. Attending these events provide the opportunity to see first-hand
those farming principles that are applied on these profitable and resilient farms, and a
perfect time to ask questions, share ideas, and to expand your own farm knowledge that
could then be applied to your farming system.
As outlined in the DBOY purpose statement, there is also a focus on the environmental
management and people productivity at these events, which, along with the financial
performance, demonstrates why and how these farming enterprises are sustainable
businesses that perform year on year.
Remaining profitable during years of volatile milk payouts, while staying focused on
environmental good practice, and supporting the people on your farm to perform at their
best for themselves and for your business, are critical factors in operating a sustainable and
resilient business.
Benchmarking across a number of Key Performance Indicators (KPIs) is the only way to
objectively assess your business performance against your peers. While focusing on farm
performance, this field day also places an emphasis on the use of benchmarking to
continually refine and modify business performance.
DBOY’s Vision & Purpose Statement
The strategic purpose of Dairy Business of the Year is to contribute to dairy farmers and the
dairy industry in New Zealand by:
1. challenging paradigms to bring about ongoing improvements in farm profitability;
2. developing resilient and sustainable farming systems;
3. recognising and reinforcing the value of motivated and innovative people within
farming enterprises;
4. increasing the awareness of dairy farming practices that minimise dairy farming
impact on the environment;
To bring about positive change across these four core objectives Dairy Business of the Year
activities and events encourage dairy farmers of every scale and business model to benchmark
profit, people management and environmental practices to identify gaps and implement
solutions.
0800 735 588 team@dboy.co.nz www.dboy.co.nz 1 |P a g e
Health and Safety – Emergency Plan
General Information
Property Address: 100 Kentucky Road, Karapiro – S/N OCD #075
DBOY Officer: Jono Buchly Phone: 027 202 7034
Hosts Names: Richard & Nadine McCullough Phone: 027 468 0503
Evacuation Procedures
Evacuation Signal Safe Assembly Area Location
Air Horn and/or Verbal Instruction In Front of PKE Bunker
Accident Procedures Earthquake Procedures
1. Stay Calm. 1. Seek Shelter under a table or solid
2. Shut Down any plant or equipment. object that will provide protection
3. Provide first aid if someone is injured. from falling debris.
4. Dial 111 and ask for the appropriate 2. Keep Clear of collapsible structures.
emergency Services.
5. Arrange for someone to meet them at
the front of the site when they arrive.
Other Emergencies Procedures:
In the event of a Fire, Chemical Spill, Gas Leak, Electrical Event or any other Emergency:
1. Evacuate the Site to a Safe Assembly Area.
2. Dial 111 and ask for FIRE.
3. Report to the Officer or Host.
Health and Safety Kit
“Red Box” located prominently at the event meeting place contains:
✓ First Aid Kit(s).
✓ Fire Extinguisher or Fire Blanket.
✓ Air Horn.
✓ Sun Block.
0800 735 588 team@dboy.co.nz www.dboy.co.nz 2 |P a g e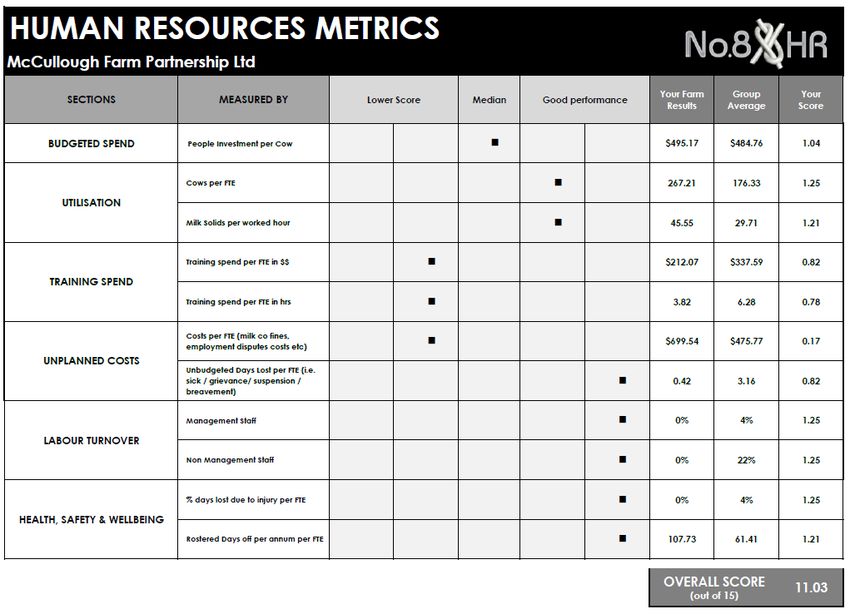
Emergency Contacts First Aider on Site: Monique Stewart 027 438 8085 Nearest Medical Centre/ Hospital: Cambridge Medical Centre 07 827 7184 Police / Fire / Ambulance: Dial 111 Hazardous and Restricted Areas This is a working farm so please follow the below: 1. Stay clear of tanker tracks. 2. Do not touch electric fences as they may be live. 3. Stay clear of any drains and culverts - these will be pointed out to you. 4. Watch for bulls on farm, do not aggravate. 5. Do not enter paddocks or cross fences unless instructed to do so. 6. When in a paddock tread carefully and watch for rabbit holes and uneven surfaces. 7. Stay clear of effluent ponds, do not pass fences or climb structures. 8. Where children have been brought along, please supervise at all times in locations. 0800 735 588 team@dboy.co.nz www.dboy.co.nz 3 |P a g e
Sponsors Introduction
Gold Sponsors
Jono Buchly, Business Manager
027 202 7034
jono.buchly@headlands.co
0800 73 55 88
www.headlands.co
Jane Davidson, Principal Advisor, Animal Sector
022 069 1822
jane.davidson@mpi.govt.nz
0800 00 83 33
www.mpi.govt.nz
Silver Sponsor
Matt Macfie, Sales & Marketing Manager
021 803 412
matt.macfie@nutrinza.com
0508 768 723
www.nutrinza.com
0800 735 588 team@dboy.co.nz www.dboy.co.nz 4 |P a g eBronze Sponsors
Dean Williamson, Publisher
027 889 3070
dean.williamson@globalhq.co.nz
www.globalhq.co.nz
Steve Sutherland, Marketing Manager
027 543 0989
steve.sutherland@genetic.co.nz
www.pioneer.co.nz
Jon Watson, National Manager - Rural
027 306 8732
jon.watson@nzi.co.nz
www.nzi.co.nz
Jackie Harrigan, Editor
027 359 7781
jackie.harrigan@nzfarmlife.co.nz
www.nzfarmlife.co.nz
Taryn Joseph, Marketing Manager
021 188 1595
taryn@fertco.co.nz
www.mineralboost.co.nz
Supporting Sponsors
Toni Trusler, General Manager
027 599 8909
toni@no8hr.com
www.no8hr.co.nz
Alastair Taylor, Business Development Manager
021 857 627
ataylor@overseer.org.nz
www.overseer.org.nz
0800 735 588 team@dboy.co.nz www.dboy.co.nz 5 |P a g eObjectives of the Day ✓ Gain an understanding of how this farm has achieved top performance across financial, environmental and human resources management ✓ Increase awareness of the critical Key Performance Indicators (KPIs) that influence resilience and sustainablility within a successful dairy system ✓ Recognise the value of benchmarking and identify potential growth opportunities within your dairy system ✓ Review the Return on Total Assets (ROTA) achieved by DBOY finalists at various milk payouts with the purpose of asking this important question – how does your business compare? ✓ Address all queries and comments What areas of your business do you need to spend more time in or on? 0800 735 588 team@dboy.co.nz www.dboy.co.nz 6 |P a g e
Farm System and Farmers History
Farm System Farm District New Zealand
2018/19 Average Top 10%
Usable Hectares 305 265 288
Milking Hectares 245 217 244
Peak Milking Cows 630 690 807
Farm and Personal History
▪ Two years doing Economics at Waikato University, then did a Diploma of Agriculture at
Massey. Worked for my parents on their dairy farm for a few years before going
overseas.
▪ Worked in Canada in 2000 and Denmark from 2001-2003 before coming home to start
sharemilking for my parents. Purchased the current farm in partnership with my
parents in 2008.
Farm Philosophy and Systems
▪ The farm is 100% autumn calving, changed from split calving about 4 years ago
▪ Try to be all grass from mid-September to mid-February, then feed out on the feedpad
over autumn / winter about 50-55% of their feed will be on the feedpad over winter,
mainly pkextra20 and canola at the start of calving, plus homegrown maize silage
▪ The aim of the system is to be profitable, environmentally sustainable, good animal
welfare but also provide a good lifestyle for owners and staff
0800 735 588 team@dboy.co.nz www.dboy.co.nz 7 |P a g ePeople Leadership and Productivity
People Productivity Farm DBOY District New
2018/19 National Average Zealand
Average Top 10%
People Investment per Cow ($) $495 $485 - -
Cows per Full Time Equivalent (50hr FTE) 267 176 142 177
Milk Solids per worked hour 45.55 29.71 - -
Training spend per FTE in Dollars ($) $212 $338 - -
Training spend per FTE in Time (hrs) 3.82 6.28 - -
Unplanned Costs per FTE ($) $699 $476 - -
Unbudgeted Days Lost per FTE 0.42 3.16 - -
Labour Turnover - Management Staff (%) 0% 4% - -
Labour Turnover - Non-Management Staff 0% 22% - -
% days lost due to injury per FTE 0% 4% - -
Rostered days off per annum per FTE 107.73 61.41 - -
Key Concepts
▪ Roster. 7 on 2 off March to May (calving) then 10 on 4 off rest of season, aim to have 40
working week on average
▪ Try to be flexible and keep the workplace free of irritating problems.
▪ Have realistic expectations
This section of the DBOY Farm Performance Report is managed by No8HR. For further
information on the people leadership scorecard or for advice with your own staffing,
please contact No8HR on 07 870 4901 or visit www.no8hr.co.nz
0800 735 588 team@dboy.co.nz www.dboy.co.nz 8 |P a g e 0800 735 588 team@dboy.co.nz www.dboy.co.nz 9 |P a g e
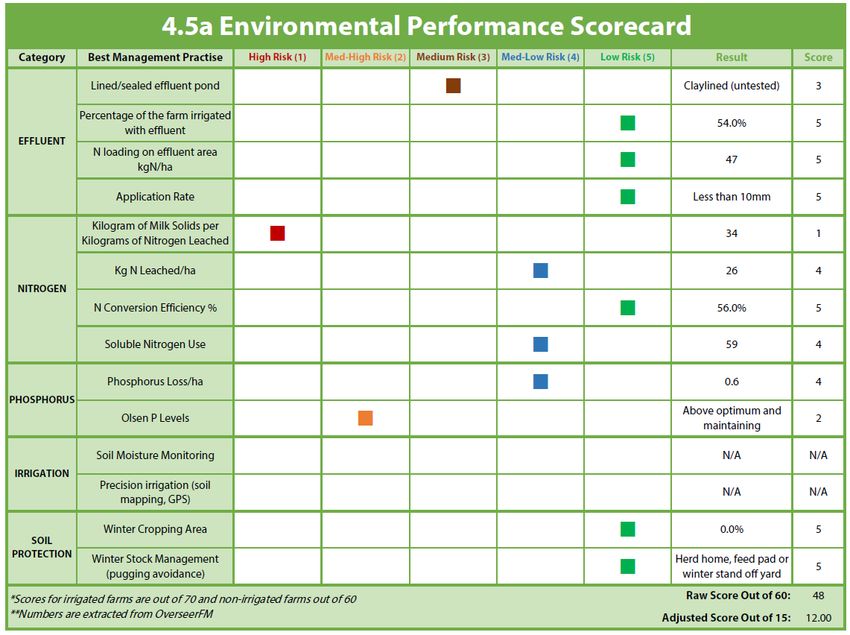
Environmental Management
Environmental Farm DBOY
2018/19 National
Management Average
Effluent Pond Claylined Lined
% of Farm Irrigated with Effluent 54% 38%
N Loading on Effluent Area (kg/ha) 47 131
KgMS/ha per KgN Loss/ha 34 53
N Leached (kg/ha) 26 46
N Conversion Efficiency (%) 56% 29%
Soluble N Use (kg/ha) 59 142
P Loss (kg/ha) 0.6 1.4
Olsen P Levels Above At Optimum
Optimum
Winter Cropping % of Farm 0% 3%
Winter Soil Management Formal Formal
Standoff Standoff
Green House Gases (Total CO2 Equivalents) 8,647 3,660
Key Concepts
▪ Try to leave the farm better environmentally in the future than it is now.
▪ Composting barn being built this year, also trying strip-tilling for maize.
▪ Dung beetles and planting swampier areas each year.
▪ Low Nitrogen usage and some plantain being planted as we re-grass paddocks.
0800 735 588 team@dboy.co.nz www.dboy.co.nz 10 |P a g e 0800 735 588 team@dboy.co.nz www.dboy.co.nz 11 |P a g e
Livestock and Production
Livestock Management Farm District New Zealand
2018/19 Average Top 10%
Peak Milking Cows 192 712 807
Milksolids per Cow (kgMS/cow) 366 405 477
Milksolids as % of Cow Liveweight 78 83 95
Milksolids per Milking Hectare (kgMS/ha) 950 1,251 1,579
Key Concepts
▪ Main focus with animal health is prevention is better than the cure, our main issue is
lameness and is the main reason for composting barn.
▪ No bobby calves.
▪ Improve per cow performance.
Cows
▪ 630 cows
▪ A2 Friesian AI used, tried sexed semen this year, 3 weeks Friesian and 1 week short-
gestation Hereford, then 6 weeks Hereford bulls (10 weeks total).
▪ Young stock mated to Highland bulls.
▪ 11% empty rate.
Young Stock
▪ Rearing about 150 calves a year at the moment, looking to replace a few average cows
in the herd and then hopefully in a few years reduce number of replacements.
▪ All young stock raised on farm.
0800 735 588 team@dboy.co.nz www.dboy.co.nz 12 |P a g eFeed Management
Pasture & Farm District New Zealand
2018/19 Average Top 10%
Feed Management
Annual Stocking Rate – milking area 2.57 3.35 3.25
Homegrown Grazed Feed as % of Diet 65 62 63
Total Feed Fed (tDM/cows) 6.12 5.36 5.58
Grazed Feed Fed (tDM/cows) 3.67 3.26 3.60
Homegrown Feed – Direct Costs ($/tDM) 87 80 96
Grazed Feed – Direct Costs ($/tDM) 52 51 64
Conserved Feed – Direct Costs ($/tDM) 187 220 251
Fodder Purchased – Direct Costs ($/tn) 0 323 307
Concentrate Purchased – Direct Costs ($/tn) 340 341 352
Key Concepts
▪ As much home-grown feed as practicable, all maize (34ha) grown on farm using a
lot of our effluent on maize paddocks.
▪ Pasture still main focus and supplement use varies depending on pasture growth.
▪ In winter aim for about 45 day round and increase or decrease supplement use not
round length.
Pasture
▪ Looking at doing hay this year instead of baleage.
Supplements
▪ Forward contract most of our feed.
0800 735 588 team@dboy.co.nz www.dboy.co.nz 13 |P a g eProfitability of the Business
Profitability & Resilience Farm District New Zealand
2018/19 Average Top 10%
Milk Income per kgMS ($/kgMS) 7.01 6.68 6.67
Total Assets Managed per Hectare ($/ha) 61,811 80,701 63,430
Gross Farm Income per Hectare ($/ha) 8,728 10,566 11,095
Operating Costs per Hectare ($/ha) 4,895 7,539 7,165
Earnings before Interest and Tax per Ha 3,834 3,025 3,934
Return on Total Asset (%) 6.2 3.5 6.3
Operating Profit Margin (%) 43.9 26.2 36.3
Gross Farm Income per kgMS ($/kgMS) 7.66 7.19 7.05
Operating Costs per kgMS ($/kgMS) 4.29 5.24 4.48
Cost of Production per kgMS ($/kgMS) 4.46 5.47 4.52
Cost of Production + Financing per kgMS ($) 6.24 6.60 5.55
Key Concepts
▪ Red Sky analysis last 4 out of 5 years to find weak points and try to improve on those
areas.
▪ Pay down debt when possible.
Cost Control Techniques
▪ System needs to work at high or low payouts without too many adjustments.
0800 735 588 team@dboy.co.nz www.dboy.co.nz 14 |P a g e 0800 735 588 team@dboy.co.nz www.dboy.co.nz 15 |P a g e
Discussion Current and Future Strategies ▪ Find best way to use composting barn, improve herd. Discussion Notes 0800 735 588 team@dboy.co.nz www.dboy.co.nz 16 |Page
Lunch Break Lunch break is a great opportunity to network. You may wish to record details of those you talk to so you can contact them later for further discussions. Name Phone Email Discuss more about Lunch Kindly Sponsored by Headlands Headlands, as part of the Intelact Consultancy Group, has been involved with Dairy Business of the Year since its inception in 2007. Headlands is committed to DBOY because the competition is based on a quantitative and transparent analysis of the farm performance across the three core business pillars. Defining business financial, environmental and human resources performance, and benchmarking that achievement against industry peers, is a cornerstone methodology in ensuring resilience and sustainability within a dairy farming enterprise. Headlands encourages dairy farmers of all sizes and systems to be “Ahead of the Game” and become involved in DBOY as part of the process of future proofing their dairy farming operation. Please contact us on 0800 73 55 88 to discuss your needs and how we can help you in your farming business, or contact: Jono Buchly Business Manager Mobile: 027 202 7034 Email: jono.buchly@headlands.co 0800 735 588 team@dboy.co.nz www.dboy.co.nz 17 |Page
Exploring Business Growth Opportunities Informal Discussion with our Sponsor Partners - Use the space below to brainstorm your ideas. PROGRESSING YOUR BUSINESS - WHERE TO START FARM SYSTEM – PHYSICAL OR FINANCIAL PEOPLE ENVIRONMENT 0800 735 588 team@dboy.co.nz www.dboy.co.nz 18 |Page
WHAT DO YOU THINK? FIVE CORE STRENGTHS OF THE BUSINESS 1. 2. 3. 4. 5. 0800 735 588 team@dboy.co.nz www.dboy.co.nz 19 |Page
FIVE OPPORTUNITIES FOR IMPROVEMENT OR BUSINESS
GROWTH
1.
2.
3.
4.
5.
0800 735 588 team@dboy.co.nz www.dboy.co.nz 20 |PageEntering DBOY 2021
Why Enter
✓ Detailed Analysis Report for all Entrants. The report highlights strengths and opportunities to
fine-tune the business by reviewing Profit (financials and farm system management), People
Leadership and Planet (environmental and nutrient management). Example report can be
viewed at www.dboy.co.nz.
▪ Profit: analysis of financial and physical performance, including farm system
management and financial performance.
▪ People: an assessment of labour management, staff engagement and overall
performance. With people management being one of the leading areas of a successful
business.
▪ Planet: a review of nutrient management and environmental preservation. The
assessment not only assesses the environmental impact, but how you could use nutrients
more effectively which can also be financially beneficial.
✓ Quick and Easy to Enter. The data forms are simple to complete, and no interviews are required,
analysis is based on performance results, so the hard work is already done.
✓ Huge Value for a Small Entry Cost. Thanks to the subsidies provided by our generous sponsors
you receive over $2,000 of information for only $450+GST for full analysis.
✓ Great Benefits for Top Performers. Along with the Award prizes there is an exclusive Leaders
Optimisation Day where all finalists can assess each other’s businesses and learn from other top
performers from around the country.
“The detailed physical and financial analysis and report from DBOY
provided us with a better understanding of the KPIs in our business. The
report reinforced our low-cost structure and identified areas that we
could tweak to gain even greater efficiencies. Winning the Regional and
Supreme has put us in good stead with our bank, and they have greater
confidence in us and see us as a low risk which is really important,
especially for any future developments or opportunities we may want
to pursue.” Andrew & Sibylle Sulzberger
“We have entered DBOY three times now as the data gained via the Farm
Performance Assessment Report is invaluable in assisting us make
evidence-based decisions for our business. DBOY allows us to
benchmark ourselves with other top-end businesses and provides an
accurate “warts and all” critique of our business. The report also helps
us set KPIs that ensure relevance for our goals. We now have a
comprehensive set of data that we use to not only assess performance,
but also assist with planning/modelling future strategies.” Tim
Montgomerie
0800 735 588 team@dboy.co.nz www.dboy.co.nz 21 |PageHow to Enter
All forms can be completed online at www.dboy.co.nz, or by contacting DBOY via email
at team@dboy.co.nz, or phone 0800 735 588 and request an electronic entry form that
can be completed within Excel.
STEP ONE - ENTRY FORM
1. Can we enter?
Any business entity can enter (owner operators, sharemilkers with property owners,
lease farms, equity partnership, companies). As long as we receive the season's
financial information for the whole business system, we can combine them into one
business for the competition, e.g. owner and sharemilker.
2. Do I have to be in the competition?
No - You can choose to opt out of “competing” and you will still receive all the same
comprehensive analysis and report. All sections of the entry form must still be
completed; you cannot choose to drop sections out. NOTE that only businesses
that comply with regional council regulations are eligible to compete.
3. Global Dairy Farms
View DBOY Example Report online at www.dboy.co.nz
i. $450+GST for a full analysis; physical data forms must be completed
4. Complete Entry Form / Client Authority Form
i. Complete online or request a form or complete overleaf (~5 minutes)
STEP TWO - COMPETE DATA COLLECTION
1. People Productivity Form
i. Complete online or request a form (~10 minutes)
2. Environmental Form
i. Complete online or request a form (~10 minutes)
3. Financial/Physical Forms
i. Global Dairy Farms – Complete online or request a form (~30 minutes)
STEP THREE - PROVIDE REQUIRED INFORMATION
1. Where required, ensure you have requested further information ahead of time from
either your accountant and/or nutrient advisor (for an updated Overseer) in order to
provide all the information required by DBOY.
2. Answer any questions the DBOY team may have that will allow your business to be
analysed promptly and accurately.
0800 735 588 team@dboy.co.nz www.dboy.co.nz 22 |Page 0800 735 588 team@dboy.co.nz www.dboy.co.nz 23 |Page
Feedback Form
We would appreciate if you could complete this form and hand it to the DBOY presenter.
Name
1. Where did you hear about the field day? (tick box)
Flyer in mailbox
Ad in the paper
Facebook
DBOY website – www.dboy.co.nz
Word of mouth – friend or co-worker
Word of mouth – through one of the sponsors
Word of mouth – local store or other rural professionals
Other, please specify
2. Please rate how satisfied you were with the event
(1= disappointed, 10= very satisfied)
1 2 3 4 5 6 7 8 9 10
3. What did you find of particular interest during the day and would like to see again on
another farm next year?
4. Is there anything you were hoping to get out of the day which was not covered?
5. Is there anything you felt didn’t need to be covered, or you did not enjoy?
0800 735 588 team@dboy.co.nz www.dboy.co.nz 24 |Page6. Will you be coming to the Regional Optimisation Days in your region next year? Yes / No
If no, why not?
7. How aware are you of DBOY’s analysis and reporting on your own business?
This is the first time I knew that DBOY completed a business analysis and report
A friend or neighbour had mentioned that DBOY prepared an analysis and report
My consultant/bank manager/other had mentioned that DBOY completes a business
analysis and report, but I haven’t taken it further
I have entered in the past
I have entered in the last few years, and am very familiar with a DBOY report
I have recently reviewed the DBOY webpage
I am aware of the analysis and report through the DBOY Facebook page
Other
8. Would you be interested in having DBOY analyse your farm business? Yes / No
If no, why not?
Please contact me regarding entry/analysis
Name:
Email:
Phone:
Thank you!
0800 735 588 team@dboy.co.nz www.dboy.co.nz 25 |PageYou can also read