STRATEGIC ASSET MANAGEMENT PLAN BRIDGES 2020-2030 - West Coast Council
←
→
Page content transcription
If your browser does not render page correctly, please read the page content below
STRATEGIC ASSET MANAGEMENT PLAN
BRIDGES
2020-2030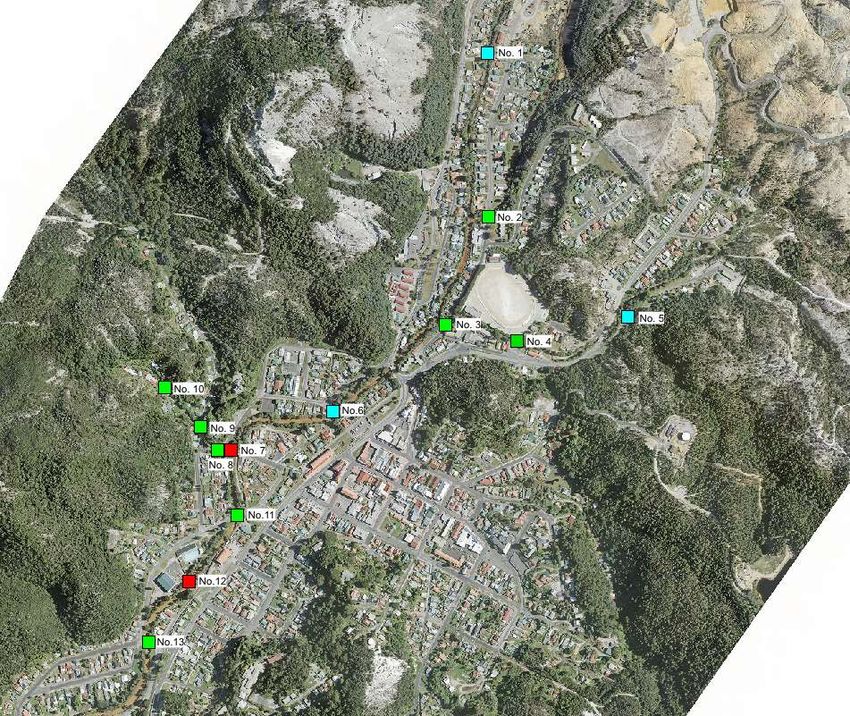
1.0 INTRODUCTION
1.1         Purpose:
To provide strategic guidance on management and renewal of Council owned or managed bridge infrastructure for a 10-
year period. Bridge infrastructure includes; vehicle bridges, pedestrian bridges and bridge-sized culverts.
This asset management plan communicates the requirements for the sustainable delivery of services through
management of assets, compliance with regulatory requirements, and required funding to provide the appropriate levels
of service over the long-term planning period.
This strategic asset management plan is to be read with the West Coast Council planning documents. Including the; West
Coast Council Asset Management Policy and West Coast Community Plan 2025. This plan may also be supplemented by
an Asset Management Plan which would provide more detail on engineering, maintenance and financial projections.
The Asset Management Plan, if required will be created, maintained and monitored by the Works and Operations
Department.
1.2        Background
Bridges are an important asset class with key risks if not managed correctly, including collapse or economic impacts from
weight restrictions or diversion requirements. Bridges are expensive to maintain, with increasing weight and safety
expectations and renewal represent a significant portion of Council’s available capital expenditure budget.
Currently West Coast Council have a total of seventy (70) bridge assets made up of:

    Bridge Type                               Number                                Value (as at 2018-2019)

    Concrete Bridges                          7                                     $1,960,613

    Timber Bridges                            14                                    $2,327,864

    Steel/Aluminum Bridges                    14                                    $2,115,706

    Bridge size culverts                      35                                    $4,379,125

The West Coast Council currently uses a contracting company to conduct routine inspections to provide advice on asset
condition, maintenance requirements, renewal requirements and safety requirements.
Condition of bridges measured using a 1 – 5 grading system (1 = very good and 5 = very poor). Most of the Council’s
bridges are currently within 1-2 (very good – good). However, at present there is a backlog of renewals pending based
on the useful life records. Additionally, the current allocated annual funding is not enough to maintain the current service
levels of bridges as the move through their expected life cycle, and therefore service levels are expected to deteriorate
which in turn could lead to;
•        increasing risk
•        increasing future financial liability for Council
•        increasing deferred maintenance costs
•        decreasing customer satisfaction
Bridge deterioration can happen rapidly, and previous experience indicates that renewals and proactive maintenance
are currently not enough to prevent unexpected safety measures including weight limitations being required.

1.3        Strategic Assessment
Our present funding levels are insufficient to continue to provide existing services at current service levels in the medium
term. Therefore, with no change in budget allocation or levels of infrastructure the following will occur:
•        The bridge conditions will deteriorate over time
•        Increasing safety risks causing potential road closures
•        Restricted access will disrupt the traffic patterns
•        Doesn’t meet the expectations of users

2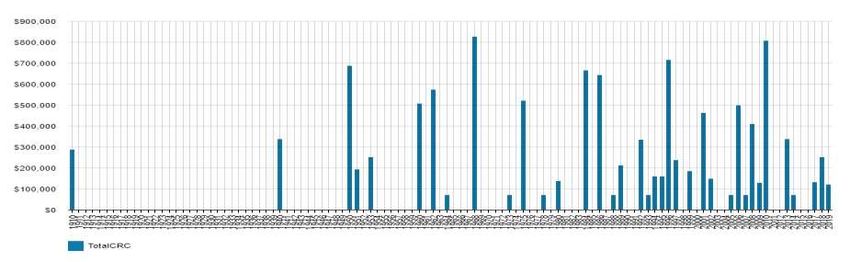
We currently do not allocate enough budget to sustain these services at the desired standard or to provide all new
services being sought. Works and services that cannot be provided under present funding levels are:
•     The replacement of all the bridges and culverts that require renewal.
•     The building new bridges in the West Coast region in the next 10 years.
1.4     Strategic Aims:
The following strategic aims provide the basis for the strategic asset management plan:
•     Ensuring adequate access for emergency services vehicles, including alternative access where feasible.
•     Ensuring adequate access for resident and business vehicles, including appropriate weight limitations.
•     Alignment of bridge infrastructure levels with current and projected future need.
•     Minimizing ongoing maintenance costs by using operationally cost-effective bridge design and reducing service
      levels where viable.
•     Spreading bridge renewals over the period to minimise the impact in any one financial year.
•     Providing enough forward projections to facilitate grant funding applications.
•     Continuously improving asset management plans and register to better inform Council planning.
1.5     Strategic Solutions:
To implement these aims the strategic asset management plan adopts the following practices where possible:
•     The replacement of timber bridges with concrete structures or culverts where possible.
•     The replacement of vehicle bridges with foot bridges, or disposal of bridges where excess capacity exists.
•     Upgrade of bridges to allow higher load rating across freight paths.
•     Decisions to extend the planned life of bridges where assessment allows including through partial replacement.
•     A conservative approach to safety and lifespan of bridges which are on singular access routes.
•     Use of weight limitations on some bridges to monitor usage and control lifespan.
1.6 Contents
This Strategic Asset Management Plan has the following sections:
•     Operations and Maintenance Plan
•     Renewal, Acquisition and Disposal Plan
•     Risk Management Plan
•     Financial Impact Assessment
•     Continuous Improvement and Review Plan

3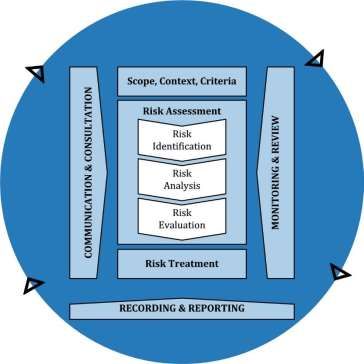
2.0      OPERATIONS AND MAINTENANCE PLAN
2.1      Introduction
Operations include regular activities to provide services. Examples of typical operational activities include cleaning,
street sweeping, asset inspection, and utility costs.
Maintenance includes all actions necessary for retaining an asset as near as practicable to an appropriate service
condition including regular ongoing day-to-day work necessary to keep assets operating. Examples of typical
maintenance activities include pipe repairs, asphalt patching, and equipment repairs.
2.2      Inspections
Through the planning period it is expected that Council will continue to use a contract service provider to conduct the
required inspections and to advise on reactive and safety maintenance requirements.
The periodic inspections assist Council in understanding reactive maintenance required, safety measures (including
weight limits) required, and verify the renewal/disposal schedules by providing updates on the condition of bridge
assets.
2.3      Current operations and maintenance
Current budget allocation (2019-2020) is $22,935 p.a.
Council’s operational expenditure is mainly spent on the bridge inspections at present and very limited budget is
allocated to the maintenance works. Current approach is reactive maintenance, which is based on works requests,
incident reports, etc. Forecast operations suggests increasing budget requirements to allow more sustainable
maintenance program and improve the Council’s asset register data through a better inspection regime. With the current
level of allocation service levels will tend to deteriorate. It should be noted that if assets are disposed of in accordance
with this plan the forecast operation and maintenance costs are expected to decrease.
To address this, it is recommended that operational funding for bridges and culverts increase by $16,000 p.a. With the
total increasing by CPI. This funding will primarily be used for deck surface maintenance, structural component renewal
and corrosion prevention.
In addition to the additional funding Council will proactively use weight limitations to protect bridges that are in areas
they provide the only access. While these limitations will not be used to prevent economic activity, they will allow Council
to have greater awareness of the tonnages crossing bridges and to update the expected remaining life based on that.

4
3.0          RENEWAL, DISPOSAL AND AQUISITION
3.1          Renewal Plan
Renewal is major capital work which does not significantly alter the original service provided by the asset, but restores,
rehabilitates, replaces or renews an existing asset to its original service potential. Work over and above restoring an
asset to original service potential is an acquisition resulting in additional future operations and maintenance costs.
Assets requiring renewal are identified from one of two approaches in the Lifecycle Model.
•        The first method uses Asset Register data to project the renewal costs (current replacement cost) and renewal
         timing (acquisition year plus updated useful life to determine the renewal year), or
•        The second method uses an alternative approach to estimate the timing and cost of forecast renewal work (i.e.
         condition modelling system, staff judgement, average network renewals, or other).
The typical useful lives of assets used to develop projected asset renewal forecasts are shown in Table 3.1. Asset useful
lives were last reviewed on 2018/19.1
Table 3.1: Useful Lives of Assets

    Asset (Sub)Category                                           Typical Useful life

    Concrete Bridges                                              80

    Timber Bridges                                                20-60

    Steel/Aluminium Bridges                                       70-80

    Bridge size culverts                                          70-80

The estimates for renewals in this plan are based on the asset register, with renewals scheduled to occur at the end of
the expected useful life, modified by condition modeling and assessments.
The age profile for bridge assets is shown in Figure 3.1

         1
             West Coast Council BMS 19 dated 24.06.2019

5
Figure 3.1 – Age Profile of Bridge Assets
3.2 Renewal ranking criteria
Asset renewal is typically undertaken to either:
• Ensure the reliability of the existing infrastructure to deliver the service it was constructed to facilitate (e.g.
replacing a bridge that has a 5 t load limit), or
• To ensure the infrastructure is of sufficient quality to meet the service requirements (e.g. condition of a
playground).6
It is possible to prioritise renewals by identifying assets or asset groups that:
• Have a high consequence of failure,
• Have high use and subsequent impact on users would be significant,
• Have higher than expected operational or maintenance costs, and
• Have potential to reduce life cycle costs by replacement with a modern equivalent asset that would provide the
equivalent service.2
The ranking criteria used to determine priority of identified renewal proposals is detailed in Table 3.3.
Table 5.3.1: Renewal Priority Ranking Criteria
Criteria Weighting
Condition (Structural and physical condition) 30%
Road/footpath Hierarchy (importance and usage) 25%
Risk 25%
Financial benefits (reductions in maintenance works) 20%
Forecast renewal costs are projected to increase over time if the asset stock increases. If assets decrease, then forecast
renewal cost will also decrease.
2
Based on IPWEA, 2015, IIMM, Sec 3.4.5, p 3|97.
63.3 10 Year Renewal Program An overview of the ten-year renewal, disposal and acquisition plan is at Appendix A. This plan was developed based on the above asset information, the strategic aims and the strategic solutions in sections 1.4 and 1.5. The plan identifies several assets for renewal either at current levels of service or lower levels of service. The plan includes a number of asset disposals bringing the overall proposed expenditure to feasible levels. 3.4 Acquisition Plan Acquisition reflects are new assets that did not previously exist or works which will upgrade or improve an existing asset beyond its existing capacity. They may result from growth, demand, social or environmental needs. Assets may also be donated to the West Coast Council. Council is aware of the current difficulty in funding the existing bridge network, both maintenance and renewals, and therefore endeavours to prioritise renewal projects over the creation of new assets or upgrading existing assets. In relation to the upgrade of assets, Council focuses on upgrading the safety features associated with bridges such as barrier rails and approach rails. These acquisitions should be funded by an additional $15,000 p.a. made available as soon as possible. It is recommended that this additional $15,000 p.a. be made available as soon as possible for safety works including improved signage and barriers, and additional safety requirements that are expected to be mandated through the 10- year planning period. It is possible that future developments may require additional bridges, or bridges with a higher capacity within the 10- year planning period. Where that is the case Council will seek to secure funding from the developer of other sources to provide the acquisition costs. 3.5 Disposal Plan Disposal includes any activity associated with the disposal of a decommissioned asset including sale, demolition or relocation. Any costs or revenue gained from asset disposals will be included in the long-term financial plan. In considering assets for disposal Council has undertaken an assessment of the asset service levels currently provided. Particularly in Queenstown there is an over service of bridges when compared to the strategic aims of 1.5, particularly in light of the current ability to fund renewals and ongoing maintenance costs. Currently many areas are serviced by more than two bridges, providing additional convenience but at a significant cost. Additionally, there are a high number of pedestrian bridges. The current bridge infrastructure in Queenstown is shown in Appendix B. In line with the strategic aims in sections 1.5 and 1.6 Council will reduce that infrastructure to that shown in Appendix C. These disposals will be scheduled to occur at the end of useful life when maintenance costs tend to increase. Overall, this will result in a reduction in vehicle and pedestrian bridges in Queenstown. There will also be replacement of bridges with lower cost alternatives (culverts etc.) where feasible, these are not likely to lesson service level and therefore will not be classed as a disposal. 7
4.0 RISK MANAGEMENT PLAN
The purpose of infrastructure risk management is to document the findings and recommendations resulting from the
periodic identification, assessment and treatment of risks associated with providing services from infrastructure, using
the fundamentals of International Standard ISO 31000:2018 Risk management – Principles and guidelines.
Risk Management is defined in ISO 31000:2018 as: ‘coordinated activities to direct and control with regard to risk’ 3.
An assessment of risks associated with service delivery will identify risks that will result in loss or reduction in service,
personal injury, environmental impacts, a ‘financial shock’, reputational impacts, or other consequences. The risk
assessment process identifies credible risks, the likelihood of the risk event occurring, and the consequences should the
event occur. The risk assessment should also include the development of a risk rating, evaluation of the risks and
development of a risk treatment plan for those risks that are deemed to be non-acceptable.
4.1         Critical Assets
Critical assets are defined as those which have a high consequence of failure causing significant loss or reduction of
service. Critical assets have been identified and along with their typical failure mode, and the impact on service delivery,
are summarised in Table 4.1. Failure modes may include physical failure, collapse or essential service interruption.
Table 4.1 Critical Assets

    Critical Asset(s)                      Failure Mode                          Impact

    Bridges/culverts                       Failure of structural component       Potential road closure
                                           and
                                           collapse

    Guardrails/safety components           Weather/       vehicle      Impact    Restrictions      and          temporary
                                           damages                               bridge/footpath closures

By identifying critical assets and failure modes an organisation can ensure that investigative activities, condition
inspection programs, maintenance and capital expenditure plans are targeted at critical assets.
4.2         Risk Assessment
The risk management process used is shown in Figure 6.2 below.
It is an analysis and problem-solving technique designed to provide a logical process for the selection of treatment plans
and management actions to protect the community against unacceptable risks.
The process is based on the fundamentals of International Standard ISO 31000:2018.

3
    ISO 31000:2009, p. 2

8
Figure 4.2 Risk Management Process – Abridged Source: ISO 31000:2018, Figure 1, p. 9
The risk assessment process identifies credible risks, the likelihood of the risk event occurring, the consequences should
the event occur, development of a risk rating, evaluation of the risk and development of a risk treatment plan for non-
acceptable risks.
An assessment of risks associated with service delivery will identify risks that will result in loss or reduction in service,
personal injury, environmental impacts, a ‘financial shock’, reputational impacts, or other consequences.
Critical risks are those assessed with ‘Very High’ (requiring immediate corrective action) and ‘High’ (requiring corrective
action) risk ratings identified in the Infrastructure Risk Management Plan. The residual risk and treatment costs of
implementing the selected treatment plan is shown in Table 4.2. It is essential that these critical risks and costs are
reported to management and the West Coast Council.
Table 4.2: Risks and Treatment Plans
Service or Asset at What can Risk Risk Treatment Plan Residual Risk Treatment
Risk Happen * Costs
Rating
(VH, H)
Bridges and culverts Critical structural High Renewal Low Up to $550,000
failure Annually
(Condition rating of Reduce load limit
$1,000
4 or 5) Engineering design for
strengthening/ $20,000
upgrades
9Bridge network Underfunding High Seek external funding Low $5,000
leading to poor (grants) and train staff
conditions and to improve application
safety of users quality
Engineering designs $20,000
and estimates to
improve budget
forecasts and
allocations
Bridge network Poor condition High Incorporate inspection Low Up to $20,000
of non-structural and Annually
maintenance/upgrade
components
work routines to the
causing traffic annual maintenance
and pedestrian program
hazards
Desktop study and
(guardrails, deck prioritise locations
surface, based on works
approaches and requests/ complaints
walkway
surfaces)
Note * The residual risk is the risk remaining after the selected risk treatment plan is implemented.
4.3 Infrastructure Resilience Approach
The resilience of our critical infrastructure is vital to the ongoing provision of services to customers. To adapt to changing
conditions we need to understand our capacity to ‘withstand a given level of stress or demand’, 1 and to respond to
possible disruptions to ensure continuity of service. Resilience is built on aspects such as response and recovery
planning, financial capacity, climate change and crisis leadership. We do not currently measure our resilience in service
delivery. This may be included in future iterations of the asset management plan.
4.4 Service and Risk Trade-Offs
The decisions made in adopting this Plan are based on the objective to achieve the optimum benefits from the available
resources.
What we cannot do. There are some operations and maintenance activities and capital projects that are unable to be
undertaken within the next 10 years. These include:
• Further structural engineering assessments (Level 3 inspection) for the back log of sites that require
intervention
• Adaptation of a detailed routine maintenance program is not possible with the current budget allocation
Where there is forecast work (operations, maintenance, renewal, acquisition or disposal) that cannot be undertaken
due to available resources, then this will result in service consequences for users. These service consequences include:
• General deterioration of the wearing components and impact on rider comfort levels
The operations and maintenance activities and capital projects that cannot be undertaken may sustain or create risk
consequences. These risk consequences include:
• Potential road closures due to failure of safety/structural components
• Congestions in local streets in case of detours and affect local roads due to heavy vehicle access
• Isolation of local community groups/ residents
• Impact on council’s reputation
10These actions and expenditures are considered and included in the forecast costs, and where developed, the Risk
Management Plan.
4.5 Climate Change and Adaption
The impacts of climate change can have a significant impact on the assets we manage and the services they provide. In
the context of the Asset Management Planning process climate change can be considered as both a future demand and
a risk.
How climate change will impact on assets can vary significantly depending on the location and the type of services
provided, as will the way in which we respond and manage those impacts.
As a minimum we should consider both how to manage our existing assets given the potential climate change impacts,
and then also how to create resilience to climate change in any new works or acquisitions.
Opportunities identified to date for management of climate change impacts on existing assets are shown in Table 4.3.
Table 4.3 Managing the Impact of Climate Change on Assets
Climate Change Projected Change Potential Impact on Assets Management
Description and Services
Rainfall events Frequent and high Flash flooding causing Maintenance works to
intensity overtopping improve freeboard and
outfalls
Temperature difference Cold winters and Affect the useful lives of deck Consider resilient materials
warmer summers materials due for overlays and resurfacing
Additionally, the way in which we construct new assets should recognise that there is opportunity to build in resilience
to climate change impacts. Buildings resilience will have benefits:
• Assets will withstand the impacts of climate change
• Services can be sustained
• Assets that can endure may potentially lower the lifecycle cost and reduce their carbon footprint Table 4.4
summarises some asset climate change resilience opportunities.
Table 4.4 Building Asset Resilience to Climate Change
New Asset Description Climate Change impact Build Resilience in New Works
These assets?
Concrete substructure Extreme flood events can Renewal bridge designs to consider increased rainfall
cause flood/impact damages flood events and impact damages
to the structure
The impact of climate change on assets is a new and complex discussion and further opportunities will be developed in
future revisions of this asset management plan.
1112
5.0 FINANCIAL SUMMARY
This section contains the financial requirements resulting from the information presented in the previous sections of
this asset management plan. The financial projections will be improved as the discussion on desired levels of service and
asset performance matures.
5.1 Current Service Levels
These infrastructure assets have significant replacement cost estimated at $11,452,206.
Estimated available funding for this period is $2,220,000 or $222,000 on average per year as per the long-term financial
plan or budget forecast. This is 62.69% of the cost to sustain the current level of service at the lowest lifecycle cost.
The anticipated planned budget leaves a shortfall of -$132,112 on average per year of the forecast lifecycle costs
required to provide current services compared with planned budget currently included in the Long-Term Financial Plan.
However, this Plan proposes to reduce the renewal costs by electing to dispose of assets rather than replace which will
reduce this shortfall.
The best available estimate of the value of assets included in this Asset Management Plan are shown below. The assets
are valued at fair value at cost to replace service capacity.
Current (Gross) Replacement Cost             $11,452,206
Depreciable Amount                           $11,697,694
Depreciated Replacement Cost                 $5,914,399
Depreciation                                 $169,917
5.2 Operational and Maintenance Cost Projections
It is proposed to increase the operational and maintenance costs by approximately $16,000 p.a. plus an inflation
increase. These figures are estimates and become less certain over the ten-year period. This is detailed in Table 5.1.
Table 5.1         Operational Cost Projections

 Financial       Forecast Operation               Forecast Maintenance                Total
 Year
 Beginning

 2019            $22,955.00                       $16,000.00                          $40,974.00

 2020            $22,970.00                       $16,007.50                          $40,997.50

 2021            $22,985.00                       $16,015.00                          $41,021.00

 2022            $23,000.00                       $16,022.50                          $41,044.50

 2023            $23,015.00                       $16,030.00                          $41,068.00

 2024            $23,030.00                       $16,037.50                          $41,091.50

 2025            $23,045.00                       $16,045.00                          $41,115.00

 2026            $23,060.00                       $16,052.50                          $41,138.50

 2027            $23,075.00                       $16,060.00                          $41,162.00

 2028            $23,090.00                       $16,067.50                          $41,185.50

13
5.3      Renewal, Acquisition and Disposal Costs
These figures are estimates, details can be found in Appendix A. This is also detailed below in Table 5.2.

Table 5.1         Acquisition, Renewal and Disposal Cost Projections

 Financial     Forecast              Forecast
 Year
               Acquisition           Capital Costs (replacement/disposal)
 Beginning
               (Safety upgrades)

 2019           $0.00                $200,634

 2020           $15,000.00           $530,905

 2021           $15,000.00           $14,000

 2022           $15,000.00           $107,080

 2023           $15,000.00           $202,130

 2024           $15,000.00           $392,030

 2025           $15,000.00           $331,830

 2026           $15,000.00           $553,440

 2027           $15,000.00           $20,220

 2028           $15,000.00           $173,280

 2029          $15,000.00             $108,840

5.4      Funding Strategy
The proposed funding for assets is outlined in the West Coast Council’s budget and long-term financial plan.
The financial strategy of the West Coast Council determines how funding will be provided, whereas the asset
management plan communicates how and when this will be spent, along with the service and risk consequences of
various service alternatives.
5.5      Valuation Forecasts
Asset values are forecast to remain approximately the same over the life of this strategic plan. Additional assets are
added in the form of safety upgrades, and the value of assets may increase as they are renewed. This will be offset by
asset disposal.

5.6      Key Assumptions Made in Financial Forecasts
In compiling this Plan, it was necessary to make some assumptions. This section details the key assumptions made in the
development of this Plan and should provide readers with an understanding of the level of confidence in the data behind
the financial forecasts.
Key assumptions made in this asset management plan are:

14
• The current operations and maintenance budgets have been used and have been increased by a fix variable.
There has been no accounting for variation in assets over the life of the plan as this is subject to Council
approval.
• Renewal forecasts have been made by professional judgement and are subject to approval by Council
• Current day dollars and does not include contingencies for ancillary works in relation to renewals.
• No additional contingency has been added for the increase in cost above and beyond current low levels of
inflation.
5.7 Forecast Reliability and Confidence
The forecast costs, proposed budgets, and valuation projections in this Plan are based on the best available data. For
effective asset and financial management, it is critical that the information is current and accurate. Data confidence is
classified on a A - E level scale4 in accordance with Table 5.3
Table 5.3: Data Confidence Grading System
Confidence Grade Description
A. Highly reliable Data based on sound records, procedures, investigations and analysis, documented properly and
agreed as the best method of assessment. Dataset is complete and estimated to be accurate ±
2%
B. Reliable Data based on sound records, procedures, investigations and analysis, documented properly but
has minor shortcomings, for example some of the data is old, some documentation is missing
and/or reliance is placed on unconfirmed reports or some extrapolation. Dataset is complete
and estimated to be accurate ± 10%
C. Uncertain Data based on sound records, procedures, investigations and analysis which is
incomplete or unsupported, or extrapolated from a limited sample for which grade A or B data
are available. Dataset is substantially complete but up to 50% is extrapolated data and accuracy
estimated ± 25%
D. Very Uncertain Data is based on unconfirmed verbal reports and/or cursory inspections and analysis. Dataset
may not be fully complete, and most data is estimated or extrapolated. Accuracy ± 40%
E. Unknown None or very little data held.
The estimated confidence level for and reliability of data used in this Plan is shown in Table 5.4.
Table 5.4: Data Confidence Assessment for Data used in this Plan
Data Confidence Assessment Comment
Demand drivers C Historical observations and professional judgements
Growth projections B From Strategic Plan and Professional Judgement
Acquisition forecast D Professional judgement
Operation forecast B Based on Long-Term Financial Plan
Maintenance forecast B Based on Long-Term Financial Plan
4
IPWEA, 2015, IIMM, Table 2.4.6, p 271.
15Renewal forecast - B Based on Long-Term Financial Plan Asset values - Asset useful lives C Generic estimated in the Asset Register - Condition modelling C Generic estimated in the Asset Register Disposal forecast D Professional judgement The estimated confidence level for and reliability of data used in this Plan is considered Medium. 16
6.0 PLAN IMPROVEMENT AND MONITORING
6.1        Status of Asset Management Practices5
6.1.1 Accounting and financial data sources
This asset management plan utilises accounting and financial data. The source of the data is West Coast Council
accounting and financial system.
6.1.2 Asset management data sources
This asset management plan also utilises asset management data. The source of the data is AusSpan BMS reports on the
asset register.
6.2        Improvement Plan
It is important that an entity recognise areas of their asset management plan and planning process that require future
improvements to ensure effective asset management and informed decision making. The improvement plan generated
from this asset management plan is shown in Table 6.1.
Table 6.1: Improvement Plan

    Task    Task                                             Responsibility     Resources             Timeline
                                                                                Required

    1       Reassess the Asset register data and update      AusSpan/ Works &   WOP’s staff           1 year
            disposal plans/ remove duplicates and validate   Ops Manager

    2       Review asset condition data and validate         AusSpan/ Works &   WOP’s staff           1 year
            useful life
                                                             Ops Manager
                                                             (MWO)

    3       Infrastructure resilience plan                   AusSpan            GM/WOP manager        Before next
                                                                                                      revision

    4       Customer consultation to improve customer        MWO                WOP/Media/field       Before next
            service level expectations                                                                revision
                                                                                staff

    5       Include Bridge components useful life and        AusSpan/ MWO       WOP staff             Before next
            expand the register data to reflect main                                                  revision
            components (Substructure, Deck, Super
            structure, etc.)

    6       Improve the funding strategy for budgeting       GM/MWO/Finance     Finance team and      Before next
            operations, maintenance and renewals             (Account teams)                          revision
                                                                                staff

    7       Review risk and treatment plan for current       GM/MWO/            WOP staff             Before next
            service levels and update                                                                 revision
                                                             AusSpan

5
    ISO 55000 Refers to this the Asset Management System

17
6.1 Monitoring and Review Procedures This Plan will be reviewed and updated annually to ensure it represents the current service level, asset values, forecast operations, maintenance, renewals, upgrade/new and asset disposal costs and proposed budgets. These forecast costs and proposed budget are incorporated into the long-term financial plan or will be incorporated into the long-term financial plan once completed. The Plan will be revised every five years, or when there are significant changes in underlying data or circumstances. Progress against Strategic Asset Management Plans will be reported to Council annually. 8.4 Performance Measures The effectiveness of this asset management plan can be measured in the following ways: • Actual Renewals aligning with Forecast Renewals • The Asset Renewal Funding Ratio achieving the Organizational target (1.0). • Progress against the improvement plan • Reduction in Reactive Maintenance Costs Progress against Strategic Asset Management Plans will be reported to Council annually. 18
7.0 APPENDICES
Appendix Renewal Forecast Summary

 Replacement   No.         Asset Location         Type                    Current Condition   Options               Estimated Budget      Details
 Financial                                                                (Rating 1 to 5)
               (Appendix                                                                                            (Approximation in
 Year
               B)                                                                                                   2019/2020
                                                                                                                    Australian Dollars)

 2019/20       Not         Trial Harbour Road –   Timber vehicle bridge   4                   Replace – Concrete    $200,634              Single Access Point.
               shown       Trial Harbour                                                      vehicle bridge

 2020/21       No. 1       Wilsdon Street –       Timber vehicle bridge   5                   Replace – Single      $335,104              5t Load Limit
                           Queenstown                                                         lane vehicle bridge                         currently installed.
                                                                                              with no separate                            Next Reduction will
                                                                                              pedestrian access                           be Closure. Closure
                                                                                                                                          of vehicle access and
                                                                                                                                          foot traffic will leave
                                                                                                                                          one access to
                                                                                                                                          around sixty houses,
                                                                                                                                          via Bachelor Street.

               Not         Lowana Road –          Timber vehicle bridge   5                   Replace – Concrete    $195,810              Current 10t Load
               shown       Strahan                                                            vehicle bridge                              Limit. This will
                                                                                                                                          impact: eight
                                                                                                                                          properties,
                                                                                                                                          Wilderness Railway
                                                                                                                                          service and Forestry.

 2021/22       No. 7       King Street –          Timber footbridge       5                   Closure and           $14,000               This will result in loss
                           Queenstown             (former vehicle                             removal                                     of a pedestrian
                                                  bridge).                                                                                crossing.
                                                                                                                                          Downgraded to
                                                                                                                                          footbridge in 2016.
2022/23 No. 16 Off Murray Street – Pedestrian bridge 3 Closure and $9,000 This will result in loss
Pillinger Street removal of a pedestrian
Queenstown crossing.
No. 5 Tramway Street – Vehicle bridge 3 Replace with $98,080 Service maintained.
Queenstown concrete vehicle
bridge.
2023/24 No. 17 Off Murray Street – Pedestrian bridge 3 Replace with $115,410 Service maintained.
Queenstown pedestrian bridge
No. 8 Off King Street – Pedestrian bridge 3 Replace with $86,720 Service maintained.
Queenstown (former vehicle pedestrian bridge
bridge)
2024/25 Not Granville Harbour Timber vehicle bridge 2 Replace with $392,030 15t Load limit
shown Road – Granville concrete vehicle currently installed.
Harbour bridge Reduction of load
limit to 10t may be
required to preserve
bridge until Financial
Year 2024/25. Load
limits will restrict
emergency access
and economic
activity. Only access
for three shack
owners.
2025/26 No. 20 Cemetery Road – Timber vehicle bridge 2 Replace with $331,830 Service maintained.
Queenstown concrete vehicle
bridge.
2026/27 Not Park Road – Rosebery Timber vehicle bridge 2 Replace with $553,440 Service maintained.
shown concrete vehicle
bridge.
202027/28 Not Walking Track Stitt Pedestrian bridge 2 Replace to same $20,220 Service maintained.
shown River – Rosebery service level.
2028/29 No. 19 Hall Street – Timber vehicle bridge 2 Replace with $173,280 Service maintained.
Queenstown concrete vehicle
bridge.
2029/30 No. 6 Off Esplanade – Pedestrian bridge 4 Replace with $108,840 Current service level
Queenstown pedestrian bridge. maintained.
Scheduled for removal at end of life, but predicted end of life outside of period to 2029/2030
Replacement No. Asset Location Type Current Condition Options Estimated Budget Details
Financial (Rating 1 to 5)
(Appendix (Approximation in
Year
B) 2019/2020
Australian Dollars)
2030/31 No. 12 Esplanade - Driffield Pedestrian bridge Not Assessed Closure and Not yet estimated. Loss of pedestrian
Street Queenstown Removal. access convenience.
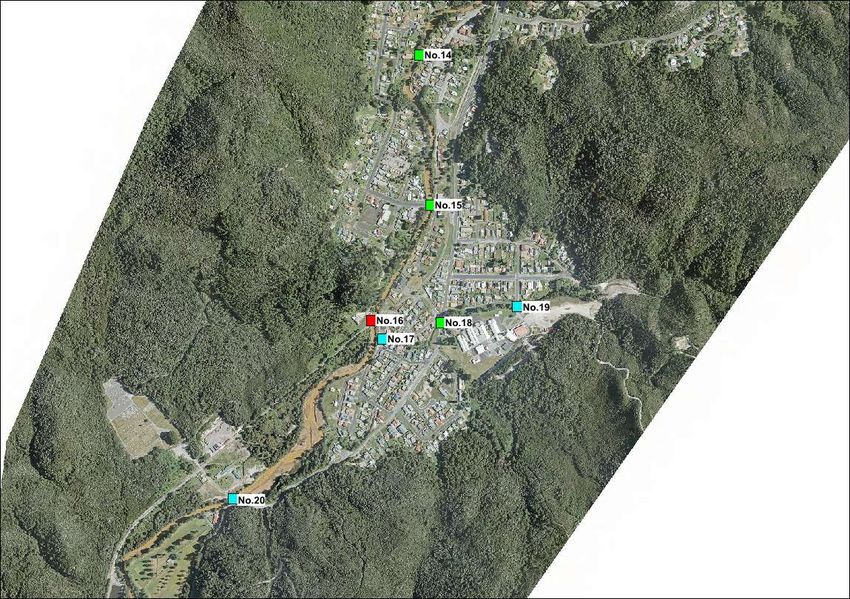
21Appendix B – Queenstown Bridges
KEY:
Bridge not planned for
replacement/removal
Bridge planned for removal
Bridge planned for replacement
Bridge:
No. 1 Wilsdon Street Vehicle/pedestrian
No. 2 Wilsdon Street Vehicle/pedestrian
No. 3 Wilsdon Street Vehicle/pedestrian
No. 4 Mary Street Pedestrian
No. 5 Tramway Street Vehicle
No. 6 Esplanade/Railway Reserve Pedestrian
No. 7 King Street Pedestrian
No. 8 King Street/Esplanade Pedestrian
No. 9 Preston Street Vehicle Culvert
No. 10 Arthur Street Vehicle Culvert
No. 11 Esplanade Vehicle/pedestrian
No. 12 Esplanade/Driffield Street Pedestrian
No. 13 Urquhart Street Vehicle/pedestrian
22Appendix B – Queenstown Bridges
Bridge:
No. 14 Lambert Street Pedestrian
No. 15 Braddon Street Vehicle/pedestrian
No. 16 Pillinger Street Pedestrian
No. 17 Elliott/Murray Street Pedestrian
No. 18 Conlan Street Vehicle/pedestrian
No. 19 Hall Street Vehicle/pedestrian
No. 20 Cemetery Road Vehicle
23You can also read