Strategic Summary 2015 2018 - Asset Management Plan
←
→
Page content transcription
If your browser does not render page correctly, please read the page content below
Asset Management Plan

Strategic
Summary
2015 – 2018
Document control

File name                         File location                                  Document version   Document date

Asset Management Plan Strategic   https://at.govt.nz/about‐us/transport‐plans‐   Final              27 July 2015
Summary 2015 – 2018               strategies/asset‐management‐plans/

                                                                     Signature                         Date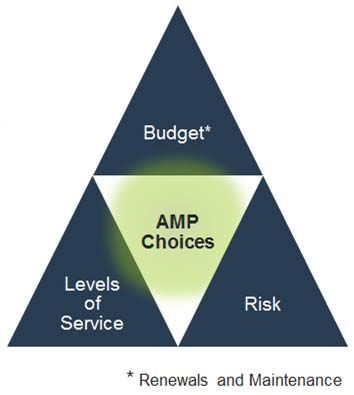
Asset Management Plan Strategic Summary 2015 - 2018

Table of Contents

The Asset Management Plan (AMP) at a Glance ............................................................................................... 1
1.      Strategic Themes Alignment ....................................................................................................................... 2
2.      The Transport Asset Portfolio ...................................................................................................................... 3
3.      Levels of Service ......................................................................................................................................... 4
     Customer levels of service .............................................................................................................................. 4
     Technical levels of service ............................................................................................................................... 4
4.      Asset Management Planning ....................................................................................................................... 5
5.      Growth and Demand.................................................................................................................................... 6
     Population and asset growth ........................................................................................................................... 6
     Consequential opex ......................................................................................................................................... 7
6.      Asset Investment and Funding .................................................................................................................... 8
     Asset investment needs, maintenance and operations ................................................................................... 8
     Approved funding, maintenance and operations ............................................................................................. 8
     Asset investment needs, renewals .................................................................................................................. 9
     Approved funding, renewals .......................................................................................................................... 10
7.      Network Asset Risk.................................................................................................................................... 12
8.      The One Network Road Classification....................................................................................................... 13
9.      Moving Towards AMP 2018 ...................................................................................................................... 13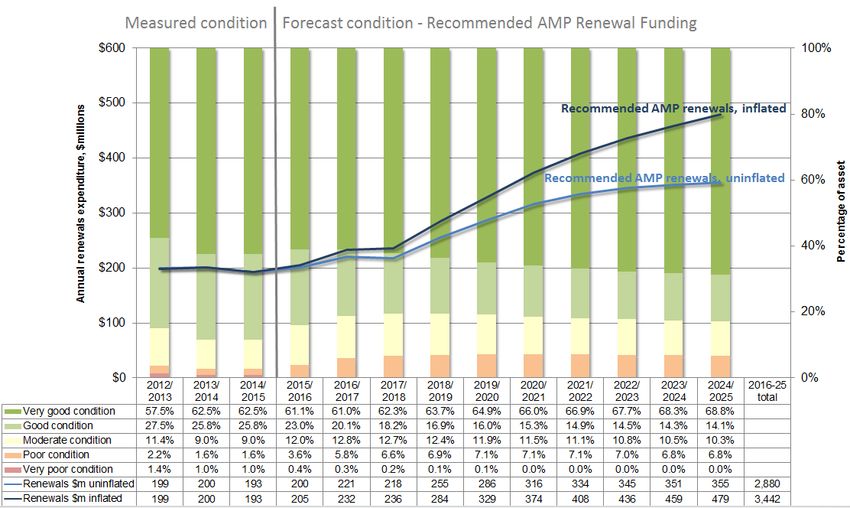
The As
sset Ma
anagem
ment P lan (AM
MP) at a Glan
nce
Auckland T
Transport’s (AT’s)
( plan to
t improve ttransport sttarts with looking after w
what we hav
ve:
AT manages $16.5 billion of assets, inc
cluding transp
port assets with on1
w a replacement value oof $13.4 billio
Auckland’s road netw work (exclud ding motorwa ays) is valued
d at $12 billio
on. These aassets provid
de for
8 billion km of vehiclle travel, oveer 180 million
n walking andd cycling trip movement of over
ps, and the m
62 millio
on tonnes of freight
f to, fro
om and withinn Auckland each
e year.
Auckland’s public tra
ansport network assets a are valued at $1.4 billion. The public ttransport (PT
T)
network carried overr 79 million trrips in 2014/2
2015.
Transport ne eciating with time and us
etwork assetts are depre se – at a rate million per year or
e of $261 m
$715,000 pper day.
Network leve e have been stable 2012--2015, and customer
els of service c satisfaction is hhigh. Currently:
Customeer satisfactio
on with roadss is 71%, foottpaths is 63%%, and public
c transport iss 81%
97% of n
network asse ets are in “Ve
ery Good”, “GGood” or “Mo oderate” condition
Backlog (assets past their renewwals interventtion point) is manageablee at $157 m
Transport ne
etworks are growing
g ne with popu lation growth
in lin mated 1.5% per year.
h, by an estim
The maintennance and operations
o off transport neetworks is th
he second la
argest item oof AT operattional
expenditure each year, after
a public trransport servvice contracts.
Road ma aintenance and
a asset-ba ased operatio
ons for the co ars2 is
oming 10 yea $1.15 billion
Public trransport asseet maintenan
nce and operrations for the coming 10 years is $$0.71 billionn
% per year, ass more road and PT asse
Costs are increasing by around 1.5% ets are addeed to the netw
work.
Renewals w will be AT’s la
argest item of
o capital exppenditure oveer the coming g 10 years (tthe City Rail Link
is second). Renewals ne eeds are ass
sessed in the e Asset Management Pla an based on providing a fitf for
purpose leveel of service and managin ng risk while
e optimising whole
w of life costs.
c
AT has sspent close to
t $200 millio
on on renewa
als each yea
ar from 2012--2015.
Uninflate
ted Inflated
Renewa
als funding re
ecommended d in the AMP
P over the coming 10 years is $2.88 b $3.44 b
Renewa
als funding ap
pproved in th
he Accelerate
ed Transportt Programme
e is $2.13 b $2.51 b
Approved re
enewals funding is sufficie ent in first 3 yyears of the 10 year LTP
P.
The 2018 AAMP is an op pportunity to review fund dling levels from
f 2018/20019, in orde r to maintain
n the
agreed levell of service frrom transporrt assets.
If renewals sspend is $3.444 billion (rec
commended ), wals spend is $2.51 billioon (approved
If renew d),
then by 2025 b1. Strattegic Themes
T s Align
nment
AT has identtified five stra
ategic theme
es to guide itts actions and decisions. The Asset M Management Plan is one e
of AT’s core strategic do ocuments, annd contributess to all five Strategic
S The
emes, and paarticularly to network
optimisation and resilience, and sustainable fund ding, as show wn in Table 1.
Table 1: Con
ntribution off the Asset Management
M t Plan to AT's Strategic Themes
T
The AMP ensures tha at existing P PT assets, including bu us
lanes, bus stops,
s stationns, trains, whharves and park
p and ridee,
are maintained and rene ewed approppriately to deeliver the leve
el
of service re
equired for th
he current annd future PT network.
The AMP sets s custome er levels of service for road and PT
P
network ass sets based on safety, aaccessibility, convenience
e,
reliability an
nd resilience.
The AMP balances leveels of servicee, cost and riisk to develo
op
an optimise
ed maintenan
nce and reneewals program mme.
The AMP demonstrates s that AT is m
managing an nd maintaininng
transport ne
etwork assetts for the be nefit of curre
ent and futurre
generationss, while optim
mising whole of life costs..
AT is recognised as impplementing, aand contributting to,
national and
d international best pracctice in Assett
Management Planning
This Strategic Summary presents the e key messa ges and dec cisions of the Asset Manaagement Plan. The
Strategic Su
ummary and AMPA are suppported by 1 5 Asset Clas
ss Managem ment Plans (A
ACMP’s). Thhese provide
e
technical analysis acrosss major asse
et classes. F
Figure 1 details the full do
ocument set.
Figure 1: AM
MP documen
nt set
22. The Transp
port As
sset Po
ortfolio
o
AT managess the most co omplex and diverse
d transsport network
k in New Zea
aland, conneecting people
e and moving
g
goods acrosss NZ’s large
est and fastes
st growing ci ty.
Auckland’s local road ne
etwork providdes for 8 billio
on km of veh hicle travel, over
o 180 milliion walking and
a cycling
trips, and the
e movement of over 62 million
m tonness of freight each year. Road assets m managed by AT have a
replacementt value of $11.974 billion,, and a curre
ent (deprecia ated) value off $7.684 billioon as shown
n in Table 2.
Table 2: Roaad assets
ROADS Replacement value Current va
alue
7,302 kilometres roa
ads $6.910 billion $4.724 billion (68%)
12,000 km
k stormwa ater
$2.341 billion $1.524 billion (65%)
channel, 75,481 catcch pits
6,959 kilometres of ffootpaths,
$0.865 billion $0.487 billion (56%)
321 km of cycleway ys
1,020 brridges and m
major
$0.819 billion $0.441 billion (54%)
culverts
oad and parkking assets
Other ro $1.039 billion $0.659 billion (57%)
TOTAL VAL
LUE ROAD ASSETS
A $11,974 billion $7.684 billion (65%)
Auckland’s ppublic transp
port network assets
a are va
alued at $1.4
4 billion, and will enable oover 79 millio
on PT trips in
n
2014/2015. Public Transsport assets are, on averrage, relative
ely new and overall
o curreent value is 83% of the
assets’ repla
acement valuue (Table 3). An exceptioon is wharvees which have e depreciateed by around half.
Table 3: Pub
blic Transporrt assets
PUBLIC TRA
ANSPORT Replacemen
nt value Current value
41 active
e rail station
ns,
associatted stabling a
and $0.619
$ billion
n $0.478 billio
on (77%)
depot
57 electric trains (E MUs),
$0.504
$ billion
n $0.496 billio
on (98%)
10 Dieseel Multiple U nits
6 Buswaay stations
$0.060
$ billion
n $0.046 billio
on (78%)
2,342 bu
us shelters
21 ferry wharves $0.110
$ billion
n $0.058 billio
on (53%)
$0.083
$ billion
n
AT HOP
P ticketing syystem $0.060 billio
on (72%)
(inc. softwaree)
TOTAL VAL
LUE PT ASS
SETS $1.376
$ billio
on $1.138 billion (83%)
33. Leve
els of Service
S e
Customerr levels off service
Customers a
are more like
ely to be satis
sfied when th
he transport network is:
• Safe: the ne er, and feels safer for all users over time
etwork is safe
• o access the network and
Accessible:: it is easy to d get to your destination
• Convenientt: the network is easy to u
use and travelling is a ple
easant experrience
• Reliable: tra
avel times forr people and
d freight are predictable
p and
a reliable
• Resilient: when
w things go
g wrong, oth
her travel opttions are ava
ailable and aaccess is quic
ckly restored
d
Generally Auucklanders are
a satisfied with
w the leve el of service provided
p by their
t transpoort network. Satisfaction
S
with roads in
ncreased 201 12-2014, and d satisfaction
n with footpaths was stab ble, as shownn in Figure 2.
Satisfaction with PT servvices is high, but declinedd in 2014 due e to a range of factors inccluding rapid
d patronage
growth. Futuure targets aim
a to mainta ain current saatisfaction levels by ensu
uring that asssets are main ntained,
operated and renewed as a needed to deliver a fit ffor purpose level of serviice.
Figure 2: Customer satissfaction tren
nds 2012‐20114 and targe
ets 2015‐2018
Satisfaction wiith Satisfaction wiith Satisfaction wiith
the quality of rroads the quality of ffootpaths public transpo rt services
Technicall levels of service
Underpinning the custom mer experience of safety, accessibility
y, convenience, reliabilityy and resilien
nce are
technical levvels of servicce. For exam
mple the smo oothness of rooad pavements, the facil ities provided at public
transport stoops and interrchanges, annd footpaths tthat provide a nonslip surface all conntribute to cus stomer
experience.
technical levvels of servicce are used throughout thhe AMP. The e thresholds used in reguular inspectio
ons of asset
condition, annd the interve ention points nance and renewals, are based on tecchnical levels
s for mainten s of service.
AT’s approach to setting technical levvels of servicce includes consideration
c n of strategicc priorities seet through the
e
Integrated T
Transport Proogramme. Higher standa ards are set for
f some ass sets based onn their role in n the PT
New Networrk, the Arteriaal Road netwwork, the Freeight Network ential “lifelinees” identified by the
k, or the esse
Auckland Inffrastructure Lifelines
L Gro
oup.
In each of th
he past three
e years, the great
g 97%) have been in “Veryy Good”, “Good” or
majorityy of assets (9
“Moderate” ccondition. Thhe AMP reco ommends co ontinuing the trend of goo
od asset conddition, by ste
eadily
renewing asssets at a rate
e that keeps pace with assset deteriorration.
44. Asset Management Planning
AT prepared its first Asset Management Plan in 2012. The 2012 AMP:
Integrated the systems and data of eight legacy councils
Set out a plan to maintain the condition and value of AT assets
Developed a framework of levels of service in response to customer needs
Recommended maintenance and renewals budgets for inclusion in the Regional Land Transport Plan
and in Auckland Council’s Long Term Plan to meet Auckland’s growth and economic development
needs
The 2015 AMP is a major review of AT’s asset management practices and:
Uses best practice modelling systems to develop whole of life strategies to maintain assets and to
renew at the optimal time
Includes more detailed consideration of levels of service for each class of asset. For example,
bridges are renewed when they fall into “poor” condition, because the impacts of asset failure are so
high. Less critical assets are renewed when their condition is “very poor”.
Calculates the consequential impacts of AT’s capital investments on long term maintenance and
renewals costs
Advises on the consequences of different levels of funding for maintenance and renewals
Budgets for asset maintenance and renewals are linked to levels of service and risk as shown in Figure 3.
The main objective of Asset Management Planning is to achieve the right balance between these three
drivers.
Figure 3: Asset Management Planning trade‐offs
5The links between asset condition, le
evel of servicce, cost and risk are showwn in Table 4 for the example of road
d
pavements. This shows that as asse et condition ddeteriorates with
w time and mer level of service
d use, custom
declines, riskk increases and
a the cost to bring the asset back tot a fit for purpose condittion increase
es.
Table 4: Linkks between level of servvice, cost andd risk for roa
ad pavementts
Condition Lev
vel of Service Cost
C Risk
90% of AT Custom
mer expectations met Needs ro
outine maintenance onlyy. Low risk
pavements
are in Very Cost: ma
aintenance
Good, Good d
$10,000 per km per year
or Moderate
condition
7% of AT Defectss noticeable but won’t Extent of
o surface pro
oblems meanns spot Low risk
pavements change
e customer behaviour fixes are
e no longer adequate. W Water may
are in Poor be enterring the road constructionn layers.
condition Cost: paavement resuurface
$100,000 per km
3% of AT Poor cu
ustomer expe
erience Wheel ru
uts and edge e breaks indiccate that On a fast
pavements road con
nstruction layyers are dammaged. and/or busy
are in Very Road is less comforttable for driveers and road, there
Poor conditiion (especia
ally) cyclists. could be a
significant
Cost: roa
ad rehabilitattion safety risk
$1,000,0000 per km
5. Grow
wth and
d Dema
and
Populatio
on and ass
set growth
h
In the three yyears from 2012-2015,
2 th
he road netw
work manage
ed by AT grew
w by:
107 km addiitional local roads,
r with a
associated streetlights, footpaths, kerbb & channel etc
19 additiona
al bridges
al signalised intersectionss
17 additiona
Transport assset growth occurs
o throug
gh:
• AT capital projects
• ets – roads and associate
Vested asse ed assets such as streetlights in new growth area as. These
are generallyy built by dev
velopers butt the respons erating, mainntaining and renewing
sibility for ope
these assetss is transferre
ed to AT
• State Highwway projects which
w can re s being transfferred to AT to manage and
esult in roads a maintain
as local road
ds. Cyclewa ays and share
ed paths connstructed by NZTA are al so transferre
ed to AT to
manage and d maintain.
Table 5 show
ws past and projected grrowth in the A
AT asset bas
se.
6Table 5: Asset growth summary 2013‐2018
Year Vested assets AT new Major assets added to network:
(excl. land) capital
2012/13 $13 m $440 m Manukau Carpark building, State Highways revoked
2013/14 $39 m $518 m Tiverton/Wolverton, EMU depot and first trains
2014/15 $36 m $558 m EMU trains, AMETI, Panmure and Manukau stations
2015/16 $40 m $422 m Otahuhu Bus Interchange
2016/17 $40 m $493 m Pukekohe Interchange, Te Atatu Road
2017/18 $40 m $410 m Albany Highway Upgrade
Consequential opex
New transport assets, from whichever source, bring consequential operations, maintenance and renewals
requirements. The AMP estimates that 1.5% more assets are added to the network each year. The financial
impact of this is shown in Table 6. Over the coming 10 years, consequential opex totals $98.1 million in
additional maintenance and operations funding requirements, just to keep up with growth in the asset base.
Table 6: Estimated consequential opex from asset growth
2015/ 2016/ 2017/ 2018/ 2019/ 2020/ 2021/ 2022/ 2023/ 2024/ 2016-2025
($million)
2016 2017 2018 2019 2020 2021 2022 2023 2024 2025 total
Consequential opex from asset growth 1.7 3.4 5.2 6.9 8.8 10.6 12.5 14.4 16.3 18.3 98.1
The rate of growth in transport assets will accelerate as Auckland’s population continues to grow and as
initiatives including Strategic Housing Areas increase the supply of new housing. Preliminary calculations
suggest that this will increase consequential opex requirements by $600 per dwelling per year. This suggests
that the above consequential opex estimates, calculated based on past trends, could significantly
underestimate the costs associated with connecting more than 10,000 new homes to the transport network
each year, as envisaged by the Auckland Housing Accord.
76. Asset Investment and Funding
The AMP development has informed the renewal and maintenance components of the 2015 Long Term Plan
and Regional Land Transport Plan. Key recommendations and decisions are summarised in Table 7.
Table 7: Summary of recommended AMP funding and approved ATP funding
Renewals are based on two funding scenarios: (10 year totals,
inflated)
Recommended (AMP) renewals funding $3.44 billion
Accelerated Transport Programme (ATP) $2.51 billion
Maintenance and operations:
Roads, footpaths, parking $1.15 billion
Public transport asset maintenance and operations* $0.71 billion
2016-2025 total AMP network needs $5.30 billion
*excludes PT services, corporate, and non-asset opex
Asset investment needs, maintenance and operations
Maintenance and asset-based operations are the second largest item of AT operational expenditure each
year, after public transport service contracts. Asset operations and maintenance requirements are assessed
and prioritised in the AMP based on:
• For the road network:
o Asset maintenance and operations costs, based on competitively tendered service delivery
contracts and known historical costs of delivering agreed levels of service
o Consequential operational and maintenance requirements of significant new infrastructure
planned to be added to the network
o Non-asset operational costs (mainly road safety) which are not set in the AMP but are
included for context
• For the public transport network:
o PT facilities maintenance and operations costs, based on the hours of operation, frequency of
services, customer levels of service and other cost drivers as set in the Regional Public
Transport Plan, and the impact of approved changes to the current levels of service
Over the decade from 2016, consequential opex from growth as shown in Table 6 is the major factor driving
maintenance and operations funding needs.
Approved funding, maintenance and operations
The approved ATP budget does not make any provision for the impact of consequential opex. Road
maintenance budgets do not increase at all over the coming 10 years as shown in Figure 4 and Table 8.
8Figure 4: Maiintenance and
d operations 2015/2016
2 too 2024/2025, Approved
A ATP funding
Table 8: Apprroved ATP fun
nding for maintenance andd operations
20155/ 2016/ 201 7/ 2018/ 2019/ 2020/ 20
021/ 2022/ 22023/ 2024/ 2016-2025
($million)
20166 2017 20118 2019 20020 2021 2022 2023 22024 2025 total
Roads mainttenance andd
114
4 114 11 4 114 11
14 115 115 115 1115 115 1,145
asset-based
d operations
Public transp
port maintenance
65 64 68
8 69 71
1 72 73
7 74 775 77 708
and asset-baased operations
Asset investment needs,
n ren
newals
AT determin nes its recom
mmended renewals progra amme by using a Renew
wals Optimisaation Model to
t estimate
the cost of re
enewing asssets in future years based
d on:
• Renewing asssets in the year
y in which
h they fall intto “very poor” condition
• y fall into “poor” conditionn. Critical as
Renewing crritical assets in the year iin which they ssets include
front of housse public tran
nsport assetss and assetss such as briddges where tthe impacts of o asset
failure are high.
• Accounting for
f new asse
ets added to the road and
d public trans
sport networkks
Renewals in nvestment neeeds do not change
c steaddily over time
e, because assets
a were nnot built at a steady rate
in the past a
and have diffe
erent conditio
on profiles a
and expected d lives.
Current spen nding on renewals is around $200 miillion each ye ear and the AMP
A forecast
sts the need for
f spending
at close to th
his level in ea
ach of the co
oming three yyears. From
m 2018/2019, renewals neeeds increas
se.
At the recom
mmended AM MP level of re ng, asset condition is ma
enewal fundin aintained andd the proportion of assetss
in very poor condition is maintained at
a 1% or lesss, as shown in Figure 5.
9Figure 5: Asset condition, actual 2013‐2015 and forecast 2016‐2025, recommended AMP renewal funding
Approved funding, renewals
In the Accelerated Transport Programme , renewals funding has been approved at close to recommended
levels for the first three years. However in the seven years from 2018/2019, renewals funding is set at a level
significantly lower than AT’s recommendation.
AT’s Renewals Optimisation Model is used to analyse the impacts on asset condition of the approved budget.
The results of this analysis are shown in Figure 6. Beyond 2018/2019, AT will not be in a position to maintain
assets in their current condition with approved levels of funding. By 2025, the proportion of assets in very
poor condition will have increased to 9.4%.
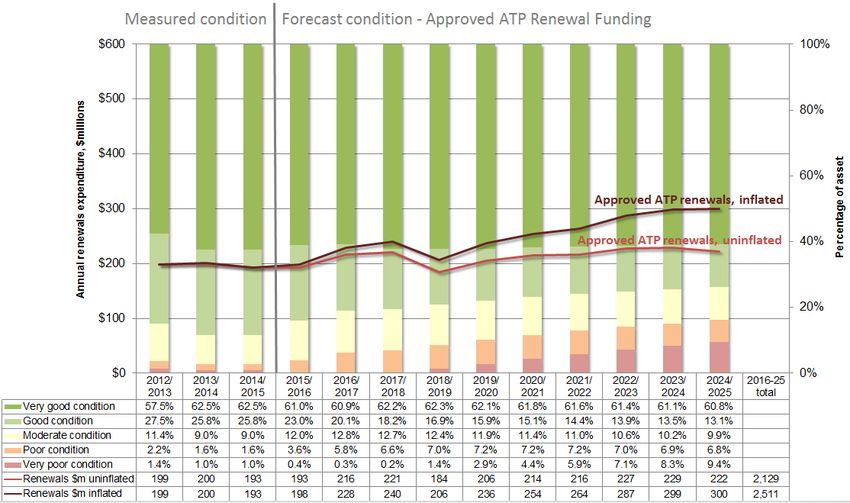
Figure 6: Asset condition, actual 2013‐2015 and forecast 2016‐2025, approved ATP renewal funding
10Assets in “veery poor” con
ndition provid
de a lower leevel of service, reducing customer
c sattisfaction. Reduced
R
renewals expenditure ma ay also bring
g higher risk aand increase ed whole-of-llife costs, thrrough increased need forr
maintenance e and through asset cond dition deterio
orating more steeply beca ause renewaals did not tak ke place at
the optimal ttime.
The gap betw TP renewals funding is shown in
ween recommended AMP renewals ffunding and approved AT
d Table 9, in the context of
Figure 7 and o asset dep reciation.
Figure 7: Reco
ommended AMP
A renewalss funding andd approved AT
TP renewals fu
unding, in conntext of depre
eciation
Table 9: Reco MP renewals funding and aapproved ATP
ommended AM P renewals fu
unding
2012/ 2013/ 2014/ 20116-
2015/ 2016/ 2017/ 2018/ 2019/ 2020/ 2021// 2022/ 20233/ 2024/
($million, inflatedd) 20133 2014 2015
2 20025
2016 2017 2018 2019 2020 2021 20222 2023 20244 2025
actuaal actual bu
udget tottal
Renewals AMP
n/a n/a n/a
n 205 232 236 284 329 374 408 436 4599 479 3,4442
recommendaation
Renewals
199 200 193
1 198 228 240 206 236 254 264 287 2999 300 2,5511
approved AT
TP
Shortfall n/a n/a n/a
n 7 4 -4 78 92 120 144 149 1600 179 9
931
Depreciation
n
261
2 293 308 328 334 331 335 345 364 3733 386 3,3397
(network asssets)
If renewals aare funded at a lower leve
el, asset con
ndition deteriorates as shown in Figurre 8. This coompounds
the shortfall in maintenan
nce and operations fundiing, because e assets in pooor conditionn also cost more
m to
operate and maintain.
11Figure 8: Summary of condition impacts: recommended AMP renewals funding and approved ATP renewals funding
7. Network Asset Risk
Transport asset risks include death and serious injury risks. The list of negative outcomes that could result
from transport asset failure includes:
• Injury or death to transport users, operators or members of the public
• Reduced customer satisfaction, through impacts on safety, accessibility, convenience, reliability
and/or resilience
• Damage to infrastructure or property
• Reduced public transport patronage
• Increased operating and maintenance costs
• Environmental impacts (e.g. pollution of waterways, air or soil)
AT has prepared an Asset Risk Management Plan which identifies the key transport asset risks and sets out
how those risks are managed and controlled by AT activities.
AT is represented on the Auckland Infrastructure Lifelines Group, which has identified priority routes and
transport facilities and their potentially vital contribution in extreme events including earthquake, volcano,
tsunami and cyclone hazards.
128. The One N etwork
k Road Classiificatio
on
Network classsification an
nd priority setting has an increasing ro
ole in road asset manageement.
The One Ne etwork Road Classification (ONRC) iss a joint initiative of NZTA A and Local GGovernment NZ to
establish nattionally conssistent prioritiies to inform asset management plan
nning, investm
ment choices
s and
maintenance e and operattional decisio ons.
AT has completed initial ONRC requirements in i ts AMP 2015
5-2018, inclu
uding:
Classsifying the Auckland
A roa
ad network ba
ased on the function of each
e road in tthe network
Mea
asuring the current perforrmance of the
e AT network using the ONRC
O perforrmance measures
Devveloping a tra
ansition plan to guide full integration of
o ONRC into
o planning, m
management, financial
and delivery processes in thee 2018 AMP
The ONRC cclassificationn shows that Arterial and Regional roa
ads make up
p 18% (1,3144 km) of AT’s
s network by
length, but ccarry 72% of traffic as sho
own in Figure
e 9.
Figure 9: ONR
RC classification of the AT network by rooad length an
nd road use (v
vehicle km traavelled)
Working to a nationally agreed
a road classification
c n system is an
a opportunitty for AT to fuurther improv
ve Asset
Managemen nt Planning and
a to build th
he evidence linking costss, risks and le
evels of servvice.
NZTA expeccts that ONR RC will be the e basis for alllocation of its n to maintenaance and ren
s contribution newals of
local roads ffrom 2018 on nwards. This s represents a shift from subsidising AT’sA programmme, to co-innvesting in
ervice on AT roads, based
achieving a ffit for purposse level of se d on their importance in tthe national network.
9. Mov ing Tow
wards AMP 2
2018
For the first tthree years of
o the 2015 Long
L Term P s has been aapproved at levels close
Plan, funding for renewals
to the recommmendations in the AMP. AT’s ongoi ng programm me of asset condition
c moonitoring and annual
renewals wo ork programm ming will allow cessary to continue to delliver levels of service and
w re-prioritissation as nec d
manage riskk over this pe eriod.
The next lonng term plann
ning cycle, leeading to pubblication of th
he 2018-2028
8 Asset Mannagement Pla an, provides
an opportunity to addresss the signific
cant issues ra
aised by the proposed future shortfal l in funding from
f Year 4
of the ten-ye
ear Long Terrm Plan.
13The asset management and risk mitigation tasks set out in Table 10 will ensure continuous improvement in
Asset Management during the 2015-2018 period, and build the evidence base for a reassessment of funding
levels in the 2018 AMP.
Table 10: Asset management issues and risks 2015‐2018
Issue/risk Management/mitigation tasks
Increased requirement for asset Additional monitoring, risk management and
management planning reporting activities to manage higher levels of risk
and to meet new ONRC requirements
Annual updates of the AMP including key indicators
such as customer satisfaction, health and safety
issues, network condition and performance
Approved (ATP) maintenance and Reprioritising work from lower to higher risk impact
asset-based operations funding assets eg. defer renewals of lower volume local
does not provide for the impacts of roads in order to prioritise arterials and collectors,
asset growth reduce maintenance standards for some assets
Approved (ATP) renewals funding Analysis of the consequences resulting from the
from 2018/2019 forward does not level of funding proposed in the LTP, and the impact
meet recommended (AMP) of the shortfall relative to the needs identified in the
renewals needs AMP
Work closely with Auckland Council and NZTA to
ensure that AT’s funding needs are clear, and that
tradeoffs between cost, risk and level of service are
transparent
Levels of service for some assets Re-assess investment needs and levels of service.
cannot be sustained at current Consult on any proposed significant changes
levels of funding
Revisit the agreed levels of service and funding
envelope consequences in the 2018-2021 funding
round
Close monitoring of asset condition, network risk and
customer satisfaction trends
Forecasting of the links between funding and trends
in customer complaints and asset integrity
14www.AT.govt.nz Visit our Head Office Auckland Transport’s Call Centre operates 6 Henderson Valley Road, Henderson, 24 hours / 7 days / week Auckland 0612 Phone +64 9 355 3553 Private Bag 92 250, Auckland 1142 Fax +64 9 355 3550
You can also read