THIRD QUARTER 2019 INVESTOR PRESENTATION - SEPTEMBER 24, 2019 - FIRSTBANK
←
→
Page content transcription
If your browser does not render page correctly, please read the page content below

Third Quarter 2019 Investor Presentation

September 24, 2019
IMPORTANT INFORMATION FOR SHAREHOLDERS AND INVESTORS

This presentation shall not constitute an offer to sell, the solicitation of an offer to sell, or the solicitation of an offer to buy any securities or the
solicitation of any vote or approval, nor shall there be any sale of securities in any jurisdiction in which such offer, solicitation, or sale would be
unlawful prior to registration or qualification under the securities laws of any such jurisdiction. In connection with the proposed merger with FNB
Financial Corp. (“FNB”), FB Financial Corporation (“FB Financial”) will file a registration statement on Form S-4 with the Securities and Exchange
Commission (the “SEC”), which will contain the proxy statement of FNB and a prospectus of FB Financial. Investors and shareholders are
encouraged to read the registration statement, including the proxy statement/prospectus that will be part of the registration statement, because it will
contain important information about the proposed transaction, FNB, and FB Financial. After the registration statement is filed with the SEC, the proxy
statement/prospectus and other relevant documents will be mailed to FNB shareholders and will be available for free on the SEC’s website
(www.sec.gov). The proxy statement/prospectus will also be made available for free by contacting FB Financial Corporation Investor Relations at
(615) 564-1212 or investors@firstbankonline.com. No offer of securities shall be made except by means of a prospectus meeting the requirements of
Section 10 of the Securities Act of 1933, as amended.

PARTICIPANTS IN THE SOLICITATION

FB Financial, FNB, and certain of their respective directors and executive officers may be deemed to be participants in the solicitation of proxies from
FNB shareholders in connection with the proposed transaction under the rules of the SEC. Information about the directors and executive officers of
FB Financial may be found in the definitive proxy statement for FB Financial’s 2019 annual meeting of shareholders, filed with the SEC by FB
Financial on April 16, 2019, and other documents subsequently filed by FB Financial with the SEC. Information about the directors and executive
officers of FNB, including additional information regarding the interests of such participants, will also be included in the proxy statement/prospectus
regarding the proposed transaction when it becomes available. Free copies of these documents may be obtained as described in the paragraph
above.

                                                                                                                                                              1
Forward looking statements
Certain statements contained in this presentation may constitute forward-looking statements within the meaning of Section 27A of the Securities Act
of 1933, as amended, and Section 21E of the Securities Exchange Act of 1934, as amended. These forward-looking statements include, without
limitation, statements relating to the timing, benefits, costs, and synergies of the proposed merger with FNB (which we refer to as the “FNB merger”),
and FB Financial’s future plans, results, strategies, and expectations. These statements can generally be identified by the use of the words and
phrases “may,” “will,” “should,” “could,” “would,” “goal,” “plan,” “potential,” “estimate,” “project,” “believe,” “intend,” “anticipate,” “expect,” “target,” “aim,”
“predict,” “continue,” “seek,” “projection,” and other variations of such words and phrases and similar expressions. These forward-looking statements
are not historical facts, and are based upon current expectations, estimates, and projections, many of which, by their nature, are inherently uncertain
and beyond FB Financial’s control. The inclusion of these forward-looking statements should not be regarded as a representation by the FB Financial
or any other person that such expectations, estimates, and projections will be achieved. Accordingly, FB Financial cautions shareholders and
investors that any such forward-looking statements are not guarantees of future performance and are subject to risks, assumptions, and uncertainties
that are difficult to predict and that are beyond FB Financial’s control. Although FB Financial believes that the expectations reflected in these forward-
looking statements are reasonable as of the date of this presentation, actual results may prove to be materially different from the results expressed or
implied by the forward-looking statements. A number of factors could cause actual results to differ materially from those contemplated by the forward-
looking statements including, without limitation, (1) the risk that the cost savings and any revenue synergies from the proposed FNB merger or
another acquisition may not be realized or take longer than anticipated to be realized, (2) disruption from the proposed FNB merger with customer,
supplier, or employee relationships, (3) the occurrence of any event, change, or other circumstances that could give rise to the termination of the
merger agreement with FNB, (4) the failure to obtain necessary regulatory approvals for the FNB merger, (5) the failure to obtain the approval of
FNB’s shareholders for the merger, (6) the possibility that the costs, fees, expenses, and charges related to the FNB merger may be greater than
anticipated, including as a result of unexpected or unknown factors, events, or liabilities, (7) the failure of the conditions to the FNB merger to be
satisfied, (8) the risks related to the integration of acquired businesses (including the proposed FNB merger, FB Financial’s recent acquisition of
branches from Atlantic Capital Bank, and any future acquisitions), including the risk that the integration of the acquired operations with those of FB
Financial will be materially delayed or will be more costly or difficult than expected, (9) the risks associated with FB Financial’s pursuit of future
acquisitions, (10) the risk of expansion into new geographic or product markets, (11) reputational risk and the reaction of the parties’ customers to the
FNB merger, (12) FB Financial’s ability to successful execute its various business strategies, including its ability to execute on potential acquisition
opportunities, (13) the risk of potential litigation or regulatory action related to the FNB merger, and (14) general competitive, economic, political, and
market conditions.

Many of these factors are beyond FB Financial’s ability to control or predict. If one or more events related to these or other risks or uncertainties
materialize, or if FB Financial’s underlying assumptions prove to be incorrect, actual results may differ materially from the forward-looking statements.
Accordingly, shareholders and investors should not place undue reliance on any such forward-looking statements. Any forward-looking statement
speaks only as of the date of this presentation, and FB Financial does not undertake any obligation to publicly update or review any forward-looking
statement, whether as a result of new information, future developments or otherwise, except as required by law. New risks and uncertainties may
emerge from time to time, and it is not possible for FB Financial to predict their occurrence or how they will affect FB Financial.

FB Financial qualifies all of its forward-looking statements by these cautionary statements.

                                                                                                                                                                       2
Use of non-GAAP financial measures
This presentation contains certain financial measures that are not measures recognized under U.S. generally accepted accounting principles (“GAAP”)
and therefore are considered non-GAAP financial measures. These non‐GAAP financial measures include, without limitation, adjusted net income,
adjusted diluted earnings per share, adjusted pro forma net income, adjusted pro forma diluted earnings per share, core noninterest expense, core
noninterest income, core efficiency ratio (tax-equivalent basis), banking segment core efficiency ratio (tax-equivalent basis), mortgage segment core
efficiency ratio (tax-efficiency basis), adjusted mortgage contribution, and adjusted return on average assets and equity. Each of these non-GAAP
metrics excludes certain income and expense items that the Company’s management considers to be non‐core/adjusted in nature. The Company refers
to these non‐GAAP measures as adjusted or core measures. The presentation also presents tangible assets, tangible common equity, tangible book
value per common share, tangible common equity to tangible assets, return on tangible common equity, return on average tangible common equity,
adjusted return on average assets, adjusted return on average equity, adjusted return on average tangible common equity, pro forma return on average
assets and equity and pro forma adjusted return on average assets and equity. Each of these non-GAAP metrics excludes the impact of goodwill and
other intangibles.

The Company’s management uses these non-GAAP financial measures in their analysis of the Company’s performance, financial condition and the
efficiency of its operations as management believes such measures facilitate period-to-period comparisons and provide meaningful indications of its
operating performance as they eliminate both gains and charges that management views as non-recurring or not indicative of operating performance.
Management believes that these non-GAAP financial measures provide a greater understanding of ongoing operations and enhance comparability of
results with prior periods as well as demonstrating the effects of significant non-core gains and charges in the current and prior periods. The Company’s
management also believes that investors find these non-GAAP financial measures useful as they assist investors in understanding the Company’s
underlying operating performance and in the analysis of ongoing operating trends. In addition, because intangible assets such as goodwill and other
intangibles, and the other items excluded each vary extensively from company to company, the Company believes that the presentation of this
information allows investors to more easily compare the Company’s results to the results of other companies. However, the non-GAAP financial
measures discussed herein should not be considered in isolation or as a substitute for the most directly comparable or other financial measures
calculated in accordance with GAAP. Moreover, the manner in which the Company calculates the non-GAAP financial measures discussed herein may
differ from that of other companies reporting measures with similar names. You should understand how such other banking organizations calculate their
financial measures similar or with names similar to the non-GAAP financial measures the Company has discussed herein when comparing such non-
GAAP financial measures. The tables included in the Appendix to this presentation provide a reconciliation of these measures to the most directly
comparable GAAP financial measures.

                                                                                                                                                            3
Strategic drivers

                                  Experienced Senior
                                  Management Team

           Strategic M&A and                              Elite Financial
          Capital Optimization                            Performance

           Scalable Platforms
              Enabled by                               Great Place to Work
              Technology

                                  Empowered Teams
                                   Across Attractive
                                 Metro and Community
                                        Markets

                                                                             4
Over 110 years of history
Organic growth
Acquisitions
Other
1990: 2001: 2004: 2008: 2014: 2015 - 2019: 2016: 2018: 2019:
Jim Ayers Opened Opened branch Opened two Opened branch Awarded “Top Rebranded to Completed Opened branch
acquired sole branches in in Knoxville branches in in Huntsville, Workplaces" by FB Financial secondary in Florence,
control of the Nashville and Chattanooga Alabama The and Completed offering of Alabama
Bank Memphis Tennessean IPO 3.7mm shares
Year: 1906 1984 1988 1990 1996 1999 2001 2003 2004 2006 2007 2008 2010 2012 2013 2014 2015 2016 2017 2018 2019
1984: 1988: 1996: 1999: 2003: 2007: 2015: 2016: 2019:
Jim Ayers Purchased Purchased Acquired Acquired The Acquired Acquired Completed core Acquired Atlantic Capital
and assets of First Bank of First State Bank of branches Northwest operating platform branches
associate National Bank West Bank of Murfreesboro in from Georgia Bank conversion
acquired of Lexington; Tennessee Linden Nashville MSA AmSouth in
the Bank Changed (Lexington) Bank in Chattanooga
2017: 2019:
franchise and Nations Tennessee MSA
Acquired Clayton Announced the
name to Bank branch community
Bank and Trust pending acquisition
FirstBank (Camden) 2001: markets
(Knoxville, TN) and of FNB Financial
Acquired Bank of American City Bank Corp.
Huntingdon (Tullahoma, TN) (Scottsville, KY)
1984 1996 1999 2001 2003 2004 2006 2007 2008 2010 2012 2014 2015 2016 2017 2018 2019
Assets ($bn) (1)
$0.3 $0.5 $0.8 $1.1 $1.1 $1.5 $1.9 $2.1 $2.1 $2.2 $2.4 $2.9 $3.3 $4.7 $5.1 $6.2
1 Pro forma for pending acquisition of FNB Financial Corp.
5Snapshot of FB Financial today
Company overview Current organizational structure
Second largest Nashville-headquartered bank and third largest
Tennessee-based bank
Originally chartered in 1906, one of the longest continually operated 100% stockholder of FirstBank
banks in Tennessee
Completed the largest bank IPO in Tennessee history in September
2016
Mr. James W. Ayers currently owns ~44% of FB Financial following
2018 secondary offering
Attractive footprint in both high growth metropolitan markets and
Financial highlights
stable community markets
Balance sheet data ($mm) 6/30/2019
Located in six attractive metropolitan markets in Tennessee &
Alabama Total assets $5,940
Strong market position in twelve community markets Loans - HFI 4,290
Mortgage offices located throughout footprint and strategically Total deposits 4,843
across the southeast, with a national online platform
Shareholder’s equity 719
Provides community banking, relationship-based customer service
with the products and capabilities of a larger bank Key metrics (%) 1H 2019
Local people, local knowledge and local authority Adjusted ROAA (%) 1.58%1
Adjusted ROATCE (%) 16.4%1
Personal banking, commercial banking, investment services, trust
and mortgage banking NIM (%) 4.50%
Core Efficiency (%) 65.4%1
Completed Atlantic Capital branch deal in April 2019 with $588.9
Tangible Common Equity / Tangible Assets (%) 9.2%1
million in deposits and $375.0 million in loans. Announced FNB
Financial Corp. acquisition in September 2019 (see pg. 20). Note: Unaudited financial data as of June 30, 2019
1 Non-GAAP financial measure. See “Use of non-GAAP financial measures” and
“Reconciliation of non-GAAP financial measures” in the Appendix hereto.
6A leading community bank headquartered in Tennessee
Top 10 banks in Tennessee¹ Top 10 banks under $30bn assets in Tennessee¹,2
Deposit Percent of Deposit Percent of
TN TN
Branches market company Branches market company
Rank Name Headquarters deposits Rank Name Headquarters deposits
(#) share deposits (#) share deposits
($bn) ($bn)
(% ) (% ) (% ) (% )
1 First Horizon Memphis, TN 164 $24.7 15.4% 75.5% 1 Pinnacle Nashville, TN 48 13.5 8.5% 69.3%
2 Regions Birmingham, AL 218 18.4 11.5% 18.7% 2 FB Financial Nashville, TN 60 4.4 2.7% 90.4%
3 BB&T Winston-Salem, NC 147 15.5 9.7% 4.7% 3 Franklin Financial Franklin, TN 15 3.1 2.0% 100.0%
4 Pinnacle Nashville, TN 48 13.5 8.5% 69.3% 4 Wilson Lebanon, TN 28 2.3 1.5% 100.0%
5 Bank of America Charlotte, NC 58 12.6 7.9% 0.9% 5 Simmons First Pine Bluff, AR 42 2.0 1.3% 12.3%
6 FB Financial Nashville, TN 60 4.4 2.7% 90.4% 6 Reliant Bancorp Brentwood, TN 22 1.8 1.1% 100.0%
7 U.S. Bancorp Minneapolis, MN 91 3.5 2.2% 1.0% 7 CapStar Financial Nashville, TN 13 1.7 1.1% 100.0%
8 Franklin Financial Franklin, TN 15 3.1 2.0% 100.0% 8 Home Federal Knoxville, TN 23 1.7 1.1% 100.0%
9 Wilson Lebanon, TN 28 2.3 1.5% 100.0% 9 Educational ServicesFarragut, TN 14 1.6 1.0% 100.0%
10 Fifth Third Cincinnati, OH 35 2.3 1.4% 1.8% 10 First Citizens Dyersburg, TN 25 1.4 0.9% 100.0%
#2 community bank in Tennessee2
Source: SNL Financial; Note: Deposit data as of June 30, 2019; Pro forma for completed acquisitions since June 30, 2019 and pending acquisitions announced as of September 18, 2019.
1 Sorted by deposit market share, deposits are limited to Tennessee.
2 Community bank defined as banks with less than $30bn in assets.
7Attractive footprint with balance between stable community markets and high
growth metropolitan markets
Our current footprint1
Market rank by deposits:
Nashville (12th)
Nashville MSA Chattanooga (5th)
Knoxville MSA Knoxville (9th)
Jackson (3rd)
Memphis (29th)
Jackson MSA Huntsville (19th)
Memphis MSA
Chattanooga MSA
Huntsville MSA
Metropolitan markets
Community markets
Total loans (excluding HFS)2 - $4.3bn Total full service branches2 – 66 branches Total deposits2 - $4.8bn
Other Mortgage /
12% Other
Community 9%
42%
Community Metropolitan
19% 69% Metropolitan
Metropolitan 58%
58% Community
33%
1 Source: SNL Financial. Statistics are based upon county data. Market data is as of June 30, 2019 and is presented on a pro forma basis for completed acquisitions since June 30, 2019 and pending acquisitions as
of September 18, 2019. Size of bubble represents size of company deposits in a given market.
2 Financial and operational data as of June 30, 2019.
8Well positioned in attractive metropolitan markets
Nashville rankings: “The new 'it' City” – The New York Times1 Chattanooga
4th largest MSA in TN
Metro for professional and Most attractive mid-sized
#1 business service jobs2
#2 cities for business3
Diverse economy with over 24,000 businesses
Employs over 260,000 people
Focused on attracting tech companies and start-ups; first municipality to
Fastest growing large metro Healthiest economy in top debut a gigabit network
#3 economy4
#4 100 metro areas5
Memphis
Home to leading companies…with more on the way 2nd largest MSA in TN
AllianceBernstein LP to base Diversified business base and has the busiest cargo airport in North
1,050 jobs in Davidson county America
North America HQ
Amazon operations hub will 11.5 million tourists visit annually, generating more than $3.3 billion for the
bring as many as 5,000 jobs local economy in 2016
Knoxville
Nashville growth
3rd largest MSA in TN
Population growth 2010 – 2019 (%) Approximately 14,000 warehousing and distribution jobs are in the area
17.0%
and account for an annual payroll of $3.8 billion
6.6%
Well situated to attract the key suppliers and assembly operations in the
Southeast
US Nashville
Projected population growth 2019 – 2024 (%) Huntsville
6.8%
3.6% Located in northern Alabama
One of the strongest technology economies in the nation, with the highest
concentration of engineers in the United States
US Nashville
6th largest county by military spending in the country
Projected median HHI growth 2019 – 2024 (%)
8.8% 11.1% Jackson
8th largest MSA in TN
US Nashville Complements and solidifies our West Tennessee franchise
FirstBank is an established leader with #3 market share
Source: S&P Market Intelligence; Chattanooga, Knoxville, Memphis, Huntsville Chambers of
Commerce, U.S. Department of Labor, Bureau of Labor Statistics, NAICS;
1 January 9, 2013 “Nashville Takes its Turn in the Spotlight”; 2 Forbes, June 2017;
3 KPMG, April 2014; 4 Headlight Data, July 2017; 5 ACBJ, October 2017.
91H 2019 highlights
Key highlights Financial results
Adjusted diluted EPS1 of $1.36, resulting in adjusted
ROAA1 of 1.58% 1H 2019
Diluted earnings per share $1.21
Completed acquisition of branches from Atlantic Capital Adjusted diluted earnings per share1 $1.36
Bank with $375.0 million in loans and $588.9 million in
deposits on April 5, 2019; results to date in line with
transaction assumptions Net income ($million) $38.3
Adjusted net income1 ($million) $42.9
Loans (HFI) grew to $4.3 billion, a 25.6% increase from
2Q 2018; grew 34.2% annualized from 4Q 2018 Net interest margin 4.50%
Impact of accretion and nonaccrual interest (bps) 17
Customer deposits grew to $4.8 billion, a 25.2%
increase from 2Q 2018; grew 36.9% annualized from Return on average assets 1.41%
4Q 2018 Adjusted return on average assets1 1.58%
Continued customer-focused balance sheet growth
Return on average equity 11.1%
resulting in a net interest margin of 4.50% for 1H 2019 Adjusted return on average equity1 12.4%
Completed exit of wholesale mortgage channels on Return on average tangible common equity1 14.6%
August 2, 2019; divestiture allows for additional focus Adjusted return on average tangible common 16.4%
on retail and Consumer Direct origination channels equity1
Efficiency ratio 69.3%
Total mortgage contribution, adjusted1 of $3.3 million in
Core efficiency ratio1, 65.4%
1H 2019, compared to $5.3 million in 1H 2018 Banking Segment core efficiency ratio1, 56.7%
1 Results are non-GAAP financial measures that adjust GAAP reported net income, total
assets, equity and other metrics for certain intangibles, income and expense items as
outlined in the non-GAAP reconciliation calculations, using a combined marginal
income tax rate of 26.06% excluding one-time items. See “Use of non-GAAP financial
measures” and the Appendix hereto for a discussion and reconciliation of non-GAAP
financial measures.
10Consistently delivering balanced profitability and growth
Pro forma return on average assets, adjusted1,2
1.69%
1.58%
1.52%
1.46%
1.21%
0.91%
0.84%
2013 2014 2015 2016 2017 2018 1H 2019
Drivers of profitability
Loans / deposits Net interest margin Core efficiency ratio2 NPLs (HFI) / loans (HFI) (%)
Loans excluding HFS Loans HFS 4.66% 75.4% 2.12%
4.46% 4.50% 73.9%
73.1%
101% 95% 95%
70.6%
84% 81% 88% 15% 7% 6% 4.10%
73% 77% 10% 3.93%3.97% 68.1%
1.21%
3% 11% 19%
5% 3.75% 65.8%
65.4% 0.68%
86% 88% 89% 0.54% 0.46% 0.43%
68% 74% 74% 70% 69% 0.32%
2012 2013 2014 2015 2016 2017 2018 2Q19 2013 2014 2015 2016 2017 2018 1H19 2013 2014 2015 2016 2017 2018 1H19 2013 2014 2015 2016 2017 2018 2Q19
1 Pro forma net income and tax-adjusted return on average assets include a pro forma provision for federal income taxes using a combined effective income tax rate of 35.37%, 35.63%, 35.08%, and 36.75% for
the years ended December 31, 2013, 2014, 2015, and 2016, respectively, and also includes the exclusion of a one-time tax charge from C Corp conversion in 3Q 2016 and the 4Q 2017 benefit from the 2017 Tax
Cuts and Jobs Act. Non-GAAP financial measures. A combined effective tax rate of 26.06% is being applied for the year ended December 31, 2018 and 1H 2019.
2 See “Use of non-GAAP financial measures,” and “Reconciliation of non-GAAP financial measures” in the Appendix hereto.
11Net interest margin remains strong
Historical yield and costs
7.0% $6,000
Avg. interest earning assets
6.0% $5,000
Yields and Costs (%)
5.0%
$4,000
($mm)
4.0%
$3,000
3.0%
$2,000
2.0%
1.0% $1,000
-- $0
2013 2014 2015 2016 2017 2018 1H19
NIM (%) 3.75% 3.93% 3.97% 4.10% 4.46% 4.66% 4.50%
Impact of accretion
and nonaccrual NA NA 0.01% 0.17% 0.24% 0.20% 0.17%
interest (%)2
Deposit cost (%) 0.48% 0.36% 0.30% 0.29% 0.42% 0.76% 1.14%
Average interest earning assets Yield on loans Loan (HFI) yield
Cost of deposits NIM
2017 2018 1H 2019
Contractual interest rate on loans HFI1 4.95% 5.42% 5.63%
Origination and other loan fee income 0.32% 0.39% 0.35%
5.27% 5.81% 5.98%
Nonaccrual interest collections 0.14% 0.04% 0.01%
1Includes tax-equivalent adjustment.
2
Accretion on purchased loans 0.22% 0.23% 0.20%
Data for nonaccrual interest collections not available prior to 2016.
NA = not available
Loan syndication fees 0.03% 0.01% 0.01%
Total loan yield (HFI) 5.66% 6.09% 6.20%
12Consistent loan growth and balanced portfolio
Total loan growth1 ($mm) and commercial real estate concentration
% of Risk-Based Capital
Commercial real estate (CRE)
concentration2
12/31/18 6/30/19
$4,290
$3,668 C&D loans subject to 100% risk-
99% 92%
$3,167 based capital limit
$1,702 $1,849
$1,341 $1,416
Total CRE loans subject to 300%
2013 2014 2015 2016 2017 2018 2Q19 238% 267%
risk-based capital limit
Loan portfolio breakdown1
Other Other
4Q 2012 5% 1-4 family
2Q 2019 6% 1-4 family
19% 16%
1-4 family
HELOC
5%
C&I 1-4 family C&I Multifamily
38% HELOC 37% 2%
13% C&D
12%
Multifamily
3%
C&D
CRE 8% CRE
14% 22%
Total Loans HFI: $1,240 million Total HFI loans: $4,290 million
1 Exclude HFS loans; C&I includes owner-occupied CRE; CRE excludes owner-occupied CRE.
2 Risk-based capital at FirstBank as defined in Call Report.
13Stable core deposit franchise
Total deposits ($mm) Cost of deposits
Noninterest bearing1(%) Cost of total deposits (%)
30.0%
25.7% 26.1%
24.2%
25.0% 22.8% 22.8% 23.0%
19.8%
20.0%
0.76% 1.14%
15.0%
$4,843
$4,172 0.42%
10.0%
$3,664 0.29%
$2,672 0.48%
$2,438 5.0% 0.36% 0.30%
$1,804 $1,924
0.0%
2013 2014 2015 2016 2017 2018 2Q19 2013 2014 2015 2016 2017 2018 1H19
Noninterest bearing deposits ($mm)1 Deposit composition as of June 30, 2019
Time Noninterest-
27% bearing
checking
23%
$1,112 Savings
$888 $949 Interest-bearing
$627 $697 4% checking
$357 $438 20%
Money market
26%
2013 2014 2015 2016 2017 2018 2Q19
43% Checking accounts
1 Includes mortgage servicing-related escrow deposits of $45.4 million, $53.7 million and $53.5 million for the years ended December 31, 2016, 2017 and 2018, respectively, and $68.3 million as of June 30, 2019.
There were no mortgage servicing-related escrow deposits prior to those periods.
14Mortgage operations overview
Highlights Mortgage production
Total Mortgage adjusted pre-tax contribution1
Consumer Direct
of $3.3 million for 1H 2019; adjusted for $1.9
million of restructuring expenses Correspondent 2017 2018 1H19
Third party originated
Retail
Mortgage banking income $45.5 million, Retail footprint
down 17.2% from 1H 2018
Completed the exit of wholesale origination
IRLC volume: $7.57bn $7.12bn $3.19bn
channels (TPO & Correspondent)
IRLC pipeline3: $504mm $319mm $609mm
Exit of wholesale origination channels allows Refinance %: 42% 34% 46%
additional focus on enhancing retail channels Purchase %: 58% 66% 54%
and improving operating efficiency moving
forward
Total adjusted pre-tax contribution1 (%)
Mortgage banking income ($mm) Banking
2017 2018 1H19 (excluding retail footprint) 1H18 1H19
Total Mortgage 9.3% 5.8%
Gain on Sale $ 103.7 $ 98.1 $36.9 (including retail footprint)
Fair value
$ 3.5 $ (9.3) $5.5
changes
Servicing $ 13.2 $ 20.6 $8.8
Revenue
90.7% 94.2%
Fair value $ (3.5) $ (8.7) $(5.7)
MSR change
1 Non-GAAP financial measure. See “Use of non-GAAP financial measures,” and “Reconciliation of non-GAAP financial measures” in the
Total Appendix hereto.
$116.9 $100.7 $45.5 2 See forward looking statements on Slide 1.
Income
3 As of the respective period end.
15Improving operating leverage remains a key objective
Improving operating efficiency Core efficiency ratio1 (tax-equivalent basis)
Consolidated 1H 2019 core efficiency
ratio1 of 65.4% driven by Banking Banking Segment, declined 14.8 percentage points since 2013
segment core efficiency ratio1 of 56.7%
Consolidated, declined 10.0 percentage points since 2013
Mortgage Segment
Integration of branch acquisition in line
with expectations
97.2% 98.4% 98.7%
95.9%
86.6% 85.2%
82.7%
Improved mortgage profitability as
75.4% 73.9% 73.1%
restructuring continues, offset by reduced 71.5% 70.6%
69.3% 67.6% 68.1%
servicing income 63.8% 65.8% 65.4%
60.6%
56.5% 56.7%
Core bank operating expense growth in
mid-single digits
Continued investment in revenue
producers, technology and operational
capabilities to improve on scalable 2013 2014 2015 2016 2017 2018 1H19
platform
1 Non-GAAP financial measure. See “Use of non-GAAP financial measures,” and “Reconciliation of non-GAAP financial measures” in the Appendix hereto.
16Asset quality continues to improve
Nonperforming ratios Classified & PCI loans ($mm)
NPLs (HFI) / loans (HFI) NPAs / assets¹ Classified Purchased credit impaired
2.12% $89
$70 $67
1.72% 1.53% $65 $66$69 $69
$55 $55
1.21%
1.01% $46
0.86%
0.68% 0.61% 0.59%
0.54%0.58% $21
0.46% 0.43% $16
0.32%
$0 $0
2013 2014 2015 2016 2017 2018 2Q19
2013 2014 2015 2016 2017 2018 2Q19
LLR / loans Net charge-offs (recoveries) / average loans
0.35%
2.41%
2.05%
1.50% 0.10%
0.07% 0.05%
1.18% 0.04%
0.00%
0.76% 0.79% 0.70%
(0.13%)
2013 2014 2015 2016 2017 2018 2Q19 2013 2014 2015 2016 2017 2018 1H19
1 Includes acquired excess land and facilities for all periods subsequent to the acquisition of the Clayton Banks and GNMA rebooked loans for 2017.
17Strong capital position for future growth
Capital position Tangible book value per share2
12/31/17 12/31/18 6/30/19
$17.02 $17.18
$14.56
Shareholder’s equity /
12.6% 13.1% 12.1%
Assets $11.56
TCE / TA2 9.7% 10.5% 9.2%
3Q16 4Q17 4Q18 2Q19
Common equity tier 1 /
10.7% 11.7% 10.4% Simple capital structure
Risk-weighted assets
Trust Tier 2 ALLL
Preferred 5%
Tier 1 capital / Risk- 5%
11.4% 12.4% 11.0%
weighted assets
Common
Total capital / Risk-
12.0% 13.0% 11.6% Equity Tier
weighted assets 1 Capital
90%
Tier 1 capital / Average
assets 10.5% 11.4% 10.0%
(Leverage Ratio) Total regulatory capital1: $588.9 million
1 Total regulatory risk based capital, FB Financial Corporation.
2 Non-GAAP financial measure. See “Use of non-GAAP financial measures,” and “Reconciliation of non-GAAP financial measures” in the Appendix hereto.
18M&A strategy1
Drive Times
Glasgow Tuscaloosa:
Clarksville
Kingsport
- Nashville ~3.5 hours
- Huntsville ~2 hours
Johnson
City
Birmingham:
- Nashville >3 hours
Asheville
- Huntsville ~1.5 hours
Atlanta:
- Nashville ~3.5 hours
Greenville
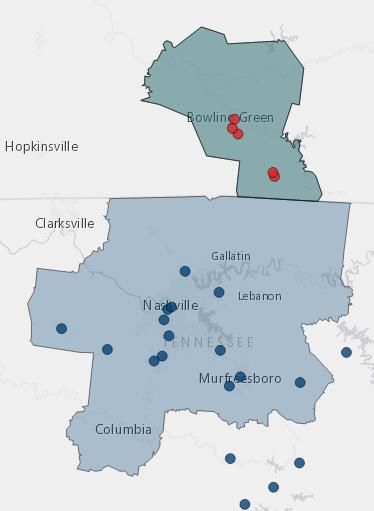
- ChattanoogaM&A update: announced acquisition of FNB Financial Corp. September 17, 2019
Pro Forma Footprint FNB Highlights
FBK Parent company of Farmers National Bank of Scottsville, which
was founded in 1923
FNB
Nashville MSA All 5 branches in the Bowling Green MSA, with 3 branches in
Bowling Green and 2 branches in Scottsville
Bowling Green MSA
The Bowling Green MSA is the fastest growing MSA in
Kentucky, is contiguous to the Nashville MSA, and provides a
natural expansion opportunity
Quality deposit base with 28% noninterest bearing deposits &
granular loan portfolio
Farmers National Bank of Scottsville Selected Financials(1)
6/30/19 Total Assets $ 252,538
6/30/19 Loans HFI 178,393
6/30/19 ALLL 1,895
6/30/19 Deposits 203,943
6/30/19 Consolidated Equity (2) 40,325
1H19 ROAA 1.18%
1H19 Efficiency Ratio (FTE) 66.9%
2Q 2019 Net Interest Margin 4.02%
2Q 2019 Yield on Loans 5.71%
2Q 2019 Cost of Deposits 0.90%
6/30/19 NPAs / Assets 0.33%
6/30/19 Reserves / NPLs 226.1%
6/30/19 Reserves / Loans 1.06%
6/30/19 TCE / TA 15.9%
6/30/19 Total RBC Ratio 21.1%
Source: S&P Global Market Intelligence
(1) Financials are bank-level
(2) Consolidated FNB Financial Corp. equity.
20FNB Financial Corp. transaction summary
Expand into attractive Bowling Green MSA ranked 7th in deposit market share
Dominant market share in Scottsville, KY with 54.5% of deposits
Strong financial performer with net interest margin > 4.00% and ROAA > 1.15%
Strategic Rationale Longstanding deposit relationships of a community bank founded in the 1920’s with a footprint in a
high growth MSA
Retain key management and local advisory board; similar culture
Low execution risk; operate on same core processing system (Jack Henry)
Transaction consideration of 954,827 shares of FBK common stock and $15.0 million of cash, or
$51.9 million based on FBK closing price of $38.67 on September 16, 2019
Price / Tangible Book Value: 1.29x
Transaction Summary Price / LTM Net Income: 16.4x
Core Deposit Premium: 6.9%
Transaction is subject to customary regulatory approvals and FNB shareholder approval; closing is
expected Q1 ‘20
Immediate marginal EPS accretion (excluding one time charges and CECL related provision)
Neutral to TBVPS at close of the transaction (including CECL impact and one time charges)
Financial Impact
~20% IRR
Estimated neutral to regulatory capital ratios
Source: S&P Global Market Intelligence
21Appendix
22Reconciliation of non-GAAP financial measures
Pro forma net income, adjusted
Pro forma diluted earnings per share, adjusted
1 2016 includes loss on sale of mortgage servicing rights, impairment of mortgage servicing rights, gain on sales or write-downs of other real estate owned and other assets and gain on sale of securities; 2015
includes bargain purchase gain and gain from securities; 2014 includes gain from securities; 2012 includes gain on sale of securities and loss on sale or write-downs of other real estate.
2 The Company terminated its S-Corporation status and became a taxable corporate entity (“C Corporation”) on September 16, 2016 in connection with its initial public offering. Pro forma amounts for income tax
expense, adjusted, and diluted earnings per share, adjusted, have been presented assuming the Company’s pro forma effective tax rate of 36.75%, 35.08%, 35.63%, 35.37%, and 33.76% for the years ended
December 31, 2016, 2015, 2014, and 2013, respectively, and also includes the exclusion of a one-time tax change from C Corp conversion in 3Q 2016 and the 4Q 2017 benefit from the 2017 Tax Cuts and Jobs
Act. 2019 and 2018 use a marginal tax rate on adjustments of 26.06%; 2017 uses a marginal tax rate on adjustments of 39.23%.
23Reconciliation of non-GAAP financial measures (cont’d)
Tax-equivalent core efficiency ratio(1)
(1) Efficiency ratio (GAAP) is calculated by dividing non-interest expense by total revenue.
24Reconciliation of non-GAAP financial measures (cont’d)
Segment tax-equivalent core efficiency ratio
1 Includes mortgage segment other noninterest mortgage banking expense, depreciation, loss on sale of mortgage servicing rights and amortization and impairment of mortgage servicing rights.
25Reconciliation of non-GAAP financial measures (cont’d)
Tangible book value per common share and tangible common equity to tangible assets
26Reconciliation of non-GAAP financial measures (cont’d)
Return on average tangible common equity
Return on average tangible common equity, adjusted
27Reconciliation of non-GAAP financial measures (cont’d)
Pro forma return on average assets and equity, adjusted
28Reconciliation of non-GAAP financial measures (cont’d)
Total mortgage contribution, adjusted
29You can also read