Review of Sustainability Measures for Tarakihi (TAR 1, 2, 3 and 7) for 2019/20 - June 2019
←
→
Page content transcription
If your browser does not render page correctly, please read the page content below
Review of Sustainability Measures
for Tarakihi (TAR 1, 2, 3 and 7) for
2019/20

Fisheries New Zealand Discussion Paper No: 2019/13

ISBN No: 978-1-98-859473-6 (online)

ISSN No: 2624-0165 (online)

June 2019

Disclaimer

While every effort has been made to ensure the information in this publication is accurate, Fisheries
New Zealand does not accept any responsibility or liability for error of fact, omission, interpretation or
opinion that may be present, nor for the consequences of any decisions based on this information.

Requests for further copies should be directed to:

Publications Logistics Officer
Fisheries New Zealand
PO Box 2526
WELLINGTON 6140

Email: brand@mpi.govt.nz
Telephone: 0800 00 83 33
Facsimile: 04-894 0300

© Crown Copyright – Fisheries New Zealand

Contents                                                   Page

1     Stocks being reviewed                                   1

2     Summary                                                 1

3     Quota Management System                                 2

4     Legal basis for managing fisheries in New Zealand       2

5     Treaty of Waitangi obligations                          2
5.1   Input and participation of tangata whenua               2
5.2   Kaitiakitanga                                           3

6     Relevant plans, strategies, statements and context      3

7     About the stock                                         3
7.1   About the species                                       3
7.2   Management target                                       3
7.3   Stock assessment                                        4
7.4   Current status, trends and projections in biomass       4
7.5   Current TAC, TACC and allowances                        8
7.6   Current other sustainability measures                   9
7.7   Uncertainties                                           9

8     Options                                                 9

9     Analysis of options                                    10
9.1   Background                                             10
9.2   Setting or varying the allowances                      12
9.3   Analysis of options for varying TAC and TACC           13
9.4   Economic evaluation                                    16
9.5   Environmental interactions                             18

10    Questions for submitters on options                    19

11    Deemed values                                          19

12    How to get more information and have your say          19

Appendix 1 The Industry Rebuild Plan                         20

                                                  i
1 Stocks being reviewed
Tarakihi (TAR 1, TAR 2, TAR 3 and TAR 7)
Nemadactylus macropterus; tiki
Figure 1: The Quota Management Area (QMAs) for East Coast tarakihi (TAR 2 and 3, and East Coast portions of TAR 1 and 7)
2 Summary
The primary driver for the review of East Coast tarahiki is the sustainability risk associated with the
current catch levels. This stock consists of TAR 2, TAR 3, and the East Coast portion of TAR 1 and
TAR 7 (Figure 1).
The stock assessment for East Coast tarakihi indicates that it is a single biological stock, and stock
abundance in 2019 is estimated to be 15.9% SB01. This is below the level that the Harvest Strategy
Standard recommends the development of a formal, time constrained rebuilding plan. As part of the
October 2018 sustainability round, the Minister of Fisheries (the Minister) decided to implement the
first stage (20% cut to the Total Allowable Commercial catch (TACC)) of a two-staged plan to rebuild
tarakihi abundance back to a target level of 40% SB0. The second stage is to implement additional
measures, as outlined in this paper, to further assist in the rebuild of East Coast tarakihi.
Three options are proposed to further support the rebuild of this stock:
Option 1: A 31% reduction to the combined TACC for TAR 1, TAR 2, TAR 3 and TAR 7 as
proposed by the Minister in the 2018 Decision Document. This is predicted to achieve a target
of 40% SB0 within 12 years, with cuts spread unevenly across quota management areas
1
SB0 is the spawning biomass (adult fish) of the unfished population.
Fisheries New Zealand Review of sustainability measures October 2019: TAR 1, 2, 3, • 1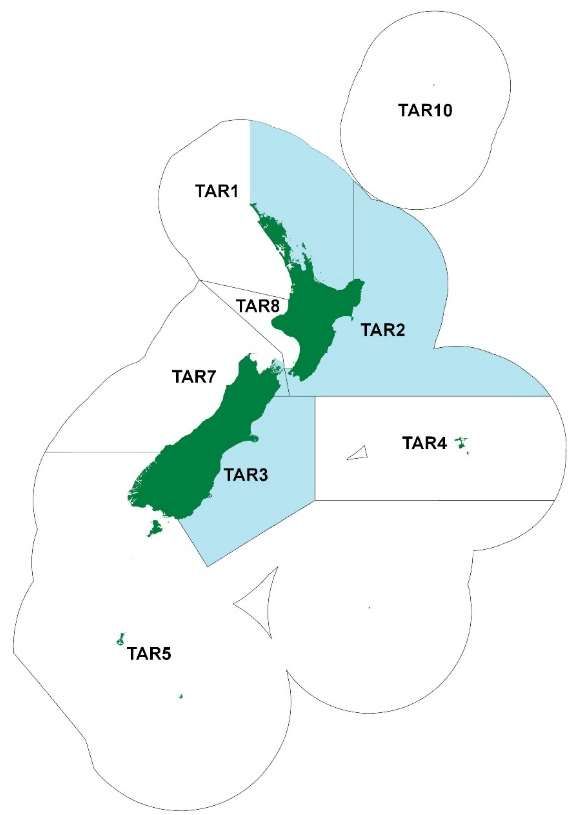
(QMAs) 1, 2, 3 and 7. In addition to this, the reduction for TAR 1 is assumed to occur across
the entire QMA, and not just the East Coast portion of that stock.
Option 2: A 35% reduction to the combined TACC for TAR 1, TAR 2, TAR 3 and TAR 7. This
is predicted to achieve a target of 40% SB0 within 11 years, which is generally consistent with
Fisheries New Zealand’s Harvest Strategy Standard. Catch reductions are proportionately
shared across the East Coast tarakihi stock, e.g. 50% catch reductions to TAR 2 and 3 and
the East Coast portion of TAR 1 and TAR 7.
Option 3: Maintain TACCs at current levels, and adopt additional management controls as
proposed through the commercial fishing industry’s ‘Eastern Tarakihi Management Strategy
and Rebuild Plan’ (the Industry Rebuild Plan). This option aims to rebuild the stock to a target
level of 35% SB0, over an unspecified timeframe, without any further TACC reductions.
The industry considers that the management actions outlined in the Industry Rebuild Plan will
significantly decrease the rebuild timeframes associated with the current catch limits, negating the
need for further cuts. The Industry Rebuild Plan is attached in Appendix 1, and discussed in section
9.3.
3 Quota Management System
Within New Zealand, tarakihi is managed using the Quota Management System (QMS). The fishing
year for tarakihi runs from 1 October to 30 September. For more information about the QMS go to
https://www.mpi.govt.nz/law-and-policy/legal-overviews/fisheries/quota-management-system/.
4 Legal basis for managing fisheries in New Zealand
The Fisheries Act 1996 provides the legal basis for managing fisheries in New Zealand, including the
Minister’s responsibilities for setting and varying sustainability measures. See the separate document
Overview of legislative requirements and other considerations on the Fisheries New Zealand
sustainability consultation webpage (https://www.fisheries.govt.nz/news-and-resources/consultations/review-
of-sustainability-measures-for-1-october-2019) for more information.
5 Treaty of Waitangi obligations
5.1 Input and participation of tangata whenua
Input and participation into sustainability processes is provided through Iwi Fisheries Forums, which
were established for that purpose. Each Iwi Fisheries Forum has developed an Iwi Fisheries Forum
Plan, which describes how the iwi in the Forum exercise kaitiakitanga over the fisheries of importance
to them, and their objectives for the management of their interests in fisheries. The Minister must have
particular regard to kaitiakitanga when making sustainability decisions.
Te Waka a Māui me Ōna Toka Iwi Forum (Te Waka a Māui), Te Hiku o te Ika Fisheries Forum, the
Mai I Ngā Kuri a Wharei ki Tihirau Iwi Fisheries Forum, Te Taihauauru and the Ngā Hapū o te Uru
Fisheries Forum had input into the selection of stocks to be reviewed in the 2018 and 2019
sustainability reviews.
Te Waka a Māui (TAR 3 & 7) represents the nine South Island iwi, each of which hold mana moana
and significant commercial and non-commercial interests in South Island fisheries. During 2018, the
Forum supported a review of TAR 3 and TAR 7, but did not support setting a customary allowance for
TAR 7 based on reported catch as this does not account for the full harvest. The forum has not
expressed a firm opinion in relation to the 2019 review, due to the lack of scientific information
available when the Forum met.
2 Review of sustainability measures October 2019: TAR 1, 2, 3, 7 Fisheries New Zealand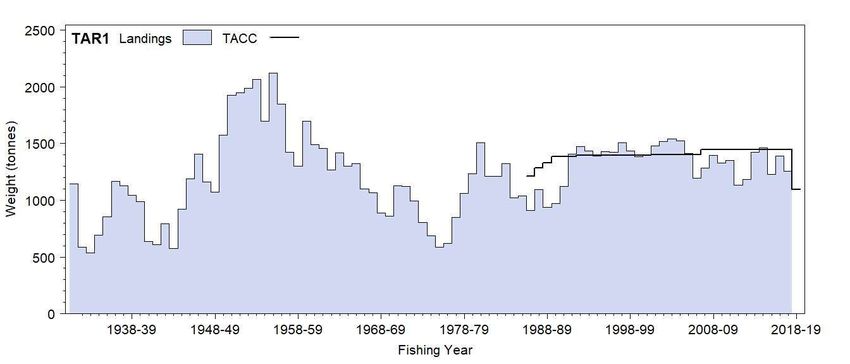
During 2018, Ngā Hapū o Te Uru (TAR 1) supported the highest reduction in TACC. The Forum
supported a recreational bag limit for tarakihi, but did not support any reduction in customary
allowance. Mai I Ngā Kuri a Whārei ki Tihirau (TAR 1) also supported a species-specific recreational
bag limit for tarakihi. During 2019, both of these forums recognised this species is a taonga to Maori,
recognising its importance to tangata whenua for customary, commercial, subsistence and
recreational purposes.

The Murihiku Mahinga Kai Hui (Southland) expressed no significant concerns during the 2018 review.

5.2 Kaitiakitanga
The fisheries plans associated with Te Waka a Māui me Ōna Toka, Mai I Ngā Kuri a Whārei ki Tihirau,
Ngā Hapū o Te Uru, and Te Hiku o te Ika Forums includes objectives for the management of fish
stocks, aligned with the aspirations of local iwi.

Fisheries New Zealand considers that the rebuild options presented in this discussion document will
contribute towards maintaining kaitiakitanga for Te Waka a Māui me Ōna Toka, Te Hiku o te Ika, Nga
Hapu o Te Uru o Tainui, and Mai I Ngā Kuri a Whārei ki Tihirau and support the objectives of their
Fisheries Plans.

6 Relevant plans, strategies, statements and context
The Draft National Inshore Finfish Fisheries Plan (2011), whilst not a statutory plan, provides guidance
on management objectives and strategies for finfish fisheries. The TAR 1 stock also intersects with the
Hauraki Gulf Marine Park, and the Minister is required to have regard to provisions in the Hauraki Gulf
Marine Park Act (HGMPA) 2000.

The proposals outlined in this paper are considered to be consistent with the objectives of the Hauraki
Gulf Marine Park Act and the Draft National Inshore Finfish Fisheries Plan.

Additionally, the East Coast tarakihi stock intersects with a number of regional council boundaries to
which coastal plans may apply. Fisheries New Zealand notes that both the Marlborough District
Council and the Bay of Plenty Regional Council coastal plans have measures to exclude some types
of fishing from inshore areas. Fisheries New Zealand notes that these measures are generally outside
of where tarakihi is targeted.

7 About the stock
7.1 About the species
Tarakihi are caught in coastal waters of the North and South Islands in depths from 30 m to 250 m.
They are a long-lived species, living to 40+ years, and reaching sexual maturity, on average, at 6
years and 33 cm in length. Tarakihi grow rapidly for the first 8 years and reach minimum legal size
(25 cm fork length) at 3-4 years. The best available science indicates that East Coast tarakihi is one
biological stock. Due to its biological characteristics and natural mortality rate, it is considered to be a
low productivity species (according to the Harvest Strategy Standard (HSS) operational guidelines),
which means that it is less resilient to high levels of fishing pressure than high productivity species.

7.2 Management target
Tarakihi is managed under Section 13 of the Fisheries Act 1996 (the Act). Section 13(2) of the Act
requires that stocks are maintained at or above a level that can produce the maximum sustainable
yield (MSY). Where MSY is not known, for low productivity species such as tarakihi, the HSS
recommends default proxies of 40% of the unfished biomass (40% SB0) for the target, 20% of the
unfished biomass (20% SB0) for the soft limit, and 10% of the unfished biomass (10% SB0) for the

Fisheries New Zealand                                     Review of sustainability measures October 2019: TAR 1, 2, 3, • 3

hard limit. Stocks should be managed to fluctuate around the management target, with at least a 50% probability of being at or above the target. This target represents a real-world biomass level that will produce the MSY, taking into account the characteristics of the species, variability in productivity, environmental variability, and uncertainties in stock status. The Minister has ultimate discretion as to the management target that is set for this stock. The HSS provides guidance on an appropriate management target, but equally the Minister is able to choose an alternative. During his 2018 decisions, the Minister indicated that he considered the proxy target of 40% SB0 for East Coast tarakihi to be appropriate. He also indicated an alternative target maybe considered, if supported by scientifically robust and peer-reviewed information. 7.3 Stock assessment The 2017 East Coast tarakihi stock assessment represented the first fully quantitative stock assessment for East Coast tarakihi. It integrated all available commercial catch and catch per unit effort (CPUE), commercial catch-at-age data, recreational catch estimates, relative biomass estimates, and catch-at-age data from fishery-independent surveys from the East Coast of the South Island. Combined with the updates to the stock assessment in 2018 and 2019, Fisheries New Zealand considers this to be the best available information. 7.4 Current status, trends and projections in biomass The abundance of East Coast tarakihi is currently estimated to be at 15.9% SB0, which is significantly below the management target of 40% SB0. It has also been below the soft limit of 20% SB0 since the early 2000s, and had an overall downward trend for approximately 30 years reaching its lowest point circa 2014. Since then it has shown an increasing trend, with a small dip in the most recent year. Projections at current catch levels suggest the stock is rebuilding and the biomass will have a 50% probability of meeting a target 40% SB0 in approximately 352 years (refer Figure 2). When a stock declines below its soft limit the HSS and guidelines recommend developing a formal, time-constrained, rebuilding plan. The plan should aim to restore the stock to at least the target level of biomass within a timeframe of between Tmin (minimum timeframe to achieve rebuild to target in the absence of fishing), and 2*Tmin (twice the minimum timeframe), with a 50% probability. For tarakihi, Tmin has been determined by the stock assessment model to be 5 years for a target of 40% SB0, and 4 years for a target of 35% SBo. 2 Note the simulation period is for 30 years, therefore the rebuild timeframe of 35 years for a target of 40% SB0 has been estimated based on continuation of the same linear trend. 4 Review of sustainability measures October 2019: TAR 1, 2, 3, 7 Fisheries New Zealand
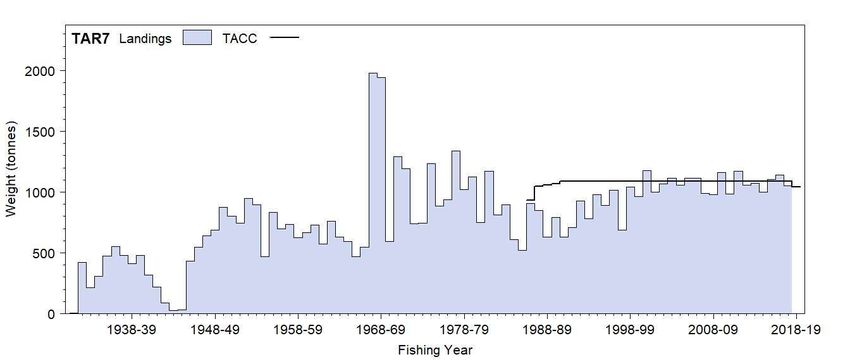
Figure 2: Spawning biomass levels. The projection, from 2018 forward (red shading), is based on current catch and the large
confidence intervals are due to uncertainty in spawning success and subsequent recruitment (fish above the minimum legal size
entering the fishery).

Customary fishery

Tarakihi (tiki) is an important species for customary fishing and is identified as a taonga species in the
Iwi Fisheries Plans that apply to the East Coast of the North and South Islands. Best available
information on customary catch was analysed in the 2018 tarakihi consultation document 3, and data
from the most recent fishing year indicates little to no change to those estimates.

Customary catch reporting information for the East Coast tarakihi is incomplete, with areas of TAR 1
and TAR 2 under the Fisheries (Amateur Fishing) Regulations 2013, which do not require reporting of
customary take. The information nevertheless suggests that current customary allowances adequately
provide for customary use of tarakihi at this time. Tangata whenua in TAR 1, 2, 3 & 7 may also be
using recreational bag limits to meet their needs.

Fisheries New Zealand notes that the proposals are likely to positively impact on the taiāpure and
mātaitai reserves by contributing to increasing abundance through the rebuild.

3
 Available at https://www.fisheries.govt.nz/news-and-resources/consultations/review-of-sustainability-measures-for-1-october-
2018/

Fisheries New Zealand                                              Review of sustainability measures October 2019: TAR 1, 2, 3, • 5
Recreational fishery
Tarakihi is one of the top five inshore recreational finfish species. Recreational fishing of tarakihi is
managed through daily bag limits. Depending on the area, tarakihi is included in a combined maximum
daily bag limit of between 20 and 30 finfish per person per day. Within the combined daily bag limit
there is an individual daily bag limit for tarakihi of either 10 (Kaikōura Marine Area), 15 (South East
Area) or 20 (other areas within East Coast tarakihi). Nationally, there is a minimum net mesh size of
100 mm, and a minimum legal size (MLS) of 25 cm (fork length) 4.
The National Panel Survey of Marine Recreational Fishers represents the best available information
on recreational harvest. The preliminary results of the 2017/18 survey are outlined in Table 1 below.
Table 1: Recreational allowances and National Panel Survey harvest estimates for TAR 1, 2, 3 & 7.
Recreational Allowance 2011/12 National Panel 2017/18 National Panel
Stock
(t) Survey harvest estimate (t) Survey harvest estimate (t)
TAR 1 110 117 ± (50) 62.23 ± (17)
TAR 2 73 72 ± (31) 110.23 ± (47.5)
TAR 3 15 3 ± (2) 5.18 ± (3)
TAR 7 23 23 ± (17) 20.57 ± (7.5)
Commercial fishery
Tarakihi is the third most valuable inshore commercial finfish fishery, with more than 80% of the Total
Allowable Catch (TAC) taken in commercial fisheries. The commercial fishery for tarakihi on the East
Coast, based on the TACC, is currently 3188 tonnes per annum, which is landed as follows:
TAR 1 (east): approximately 15% of the East Coast TAR fishery
The tarakihi target fishery accounts for about 80% of the annual catch. Most of the remainder of the
catch is taken as bycatch from bottom trawl fisheries targeting snapper, john dory, and gemfish. A
small percentage of the catch is taken by the danish seine, setnet, and bottom longline methods
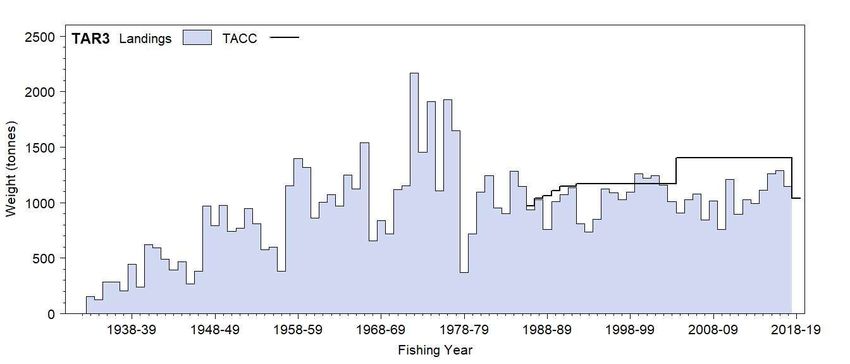
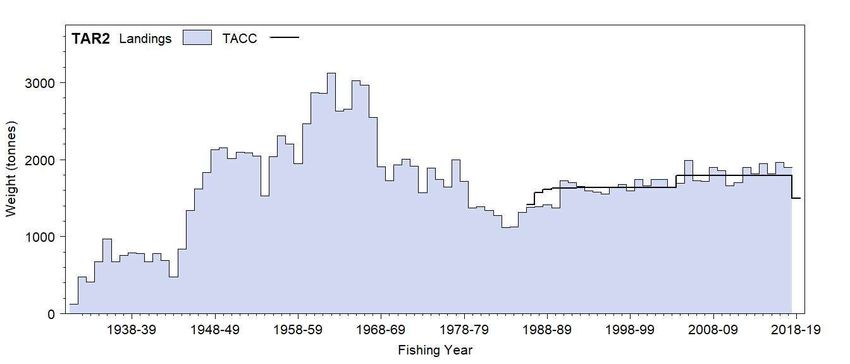
(Figure 3: Landings vs TACC for TAR 1 from the 1930 to 2017/18 TAR 2: approximately 46% of the East Coast TAR fishery The target trawl fishery has consistently accounted for about 88% of the annual catch, with a small proportion of the catch taken as by-catch in the red gurnard trawl fishery. The TACC was increased between 2004 and 2018. During this time the TACC has been over-caught by up to 10% in 8 of the 13 years (Refer Figure 4). Figure 4: Landings vs TACC for TAR 2 from 1930’s to 2017/18. TAR 3: approximately 33% of the East Coast TAR fishery Approximately 78% of the catch is taken by the target trawl fishery; and 10-15% is taken by a small target setnet fishery operating off Kaikōura. The remainder of tarakihi is taken as by-catch by bottom trawl fisheries. The TACC was increased between 2004 and 2018. During that time the TACC was significantly under caught (Figure 5). Fisheries New Zealand Review of sustainability measures October 2019: TAR 1, 2, 3, • 7
Figure 5: Landings vs TACC for TAR 3 from 1930’s to 2017/18.
TAR 7: approximately 6% of the East Coast TAR fishery
Catches from TAR 7 are mainly from the trawl fisheries targeting tarakihi (78%), blue warehou, red
cod, and giant stargazer. The TACC for TAR 7 is set at 1,042 tonnes (Figure 6), and approximately
15% of the total catch in recent years has been taken in the Cook Strait area.
Figure 6: Landings vs TACC for TAR 75 (includes all of TAR 7 - not restricted to Cook Strait) from 1930’s to 2017/18.
7.5 Current TAC, TACC and allowances
Table 2 below sets out current TACs, TACCs and allowances for TAR 1, TAR 2, TAR 3 and TAR 7.
Values for TAR 1 and TAR 7 are for the entire QMA, including the sub-areas TAR 1 (east) and TAR 7
(Cook Strait).
5
Note that, on average, the Cook Strait region represents approximately 15% of the total catch from TAR 7.
8 Review of sustainability measures October 2019: TAR 1, 2, 3, 7 Fisheries New ZealandTable 2: Total Allowable Catch for TAR 1, 2, 3, & 7
Allowances (tonnes)
Total Allowable Customary Recreational All other mortality
Total Allowable
Stock Commercial Catch Māori (tonnes) to the stock
Catch (tonnes)
(tonnes) (tonnes) caused by fishing
(tonnes)
TAR 1 1390 1097 73 110 110
TAR 2 1823 1500 100 73 150
TAR 3 1174 1040 15 15 104
TAR 7 1174 1042 5 23 104
7.6 Other sustainability measures
The main methods used to manage recreational harvests of tarakihi are Minimum Legal Size, method
restrictions (e.g. net mesh restrictions), and daily bag limits (refer section 7.4 above).
Commercial and recreational fishers are limited by a Minimum Legal Size of 25 cm fork length for
tarakihi in all areas.
7.7 Uncertainties
There are uncertainties around the stock structure and other assumptions in the assessment model.
These uncertainties lead to uncertainty in estimates of stock status, i.e., the current biomass as a
proportion of the virgin/unfished biomass.
Nevertheless, the assessment model has been peer reviewed and accepted by the Fisheries New
Zealand Southern Inshore Fisheries Assessment Working Group. The assessment model provided the
basis for the 2018 decisions, and is considered to represent best available information. All of the
available evidence clearly points to a sustainability risk, with the stock below the soft limit of 20% SB0.
Fisheries New Zealand acknowledges additional uncertainty around the projections of future stock
status based on alternative TACCs, largely resulting from unpredictable fluctuation in recruitment
driven by environmental conditions. Fisheries New Zealand plans to undertake regular stock
assessments and adjust catch limits accordingly, to ensure that the stock rebuild remains on track.
8 Options
Table 3 below sets out the options for varying the TACs, TACCs and Allowances for TAR 1, TAR 2,
TAR 3 and TAR 7. The third option has been proposed by the commercial fishing industry through its
Industry Rebuild Plan. The Industry Rebuild Plan proposes a suite of management actions as an
alternative to further TACC reductions, and is attached as Appendix 1.
Fisheries New Zealand Review of sustainability measures October 2019: TAR 1, 2, 3, • 9Table 3: Proposed catch limits and allowances
Allowances
Total
Total All other
Allowable
Allowable TACC % Customar Recreation mortality
Stock Option Catch
Commercia
change
l Catch y Māori al caused by
(tonnes) (tonnes) fishing
(tonnes) (tonnes)
(tonnes)
Option 1 3989 3249 31% 193 221 326
Option 2 3783 3063 35% 193 221 306
Option 3 5561 4679 0% 193 221 468
Combined
Status quo
TACC with
additional
controls
Option 1 871 625 43% * 73 110 63
Option 2 1106 839 24% * 73 110 84
Option 3 1390 1097 0% 73 110 110
TAR 1
Status quo
TACC with
additional
controls
Option 1 1383 1100 27% 100 73 110
Option 2 998 750 50% 100 73 75
Option 3 1823 1500 0% 100 73 150
TAR 2
Status quo
TACC with
additional
controls
Option 1 623 539 48% 15 15 54
Option 2 602 520 50% 15 15 52
Option 3 1174 1040 0% 15 15 104
TAR 3
Status quo
TACC with
additional
controls
Option 1 1112 985 5% * 5 23 99
Option 2 1077 954 9% * 5 23 95
Option 3 1174 1042 0% 5 23 104
TAR 7
Status quo
TACC with
additional
controls
* Catch limit reductions are proposed to come exclusively from the eastern portions of the TAR 1 and
TAR 7 stocks, referred to as TAR 1 (East) and TAR 7 (Cook Strait). This equates to approximately
50% reductions in catch for TAR 1 (East) and TAR 7 (Cook Strait).
9 Analysis of options
9.1 Background
As part of the Minister’s decisions on the 2018 October Sustainability Round, he decided to implement
a two-stage process for rebuilding the East Coast tarakihi stock. The staged approach provided the
commercial fishing industry an opportunity to plan and adjust their operations. The second stage
committed to a further additional review in 2019, with the expectation that additional cuts would be
required, to ensure the stock is rebuilt in an appropriate timeframe.
10 Review of sustainability measures October 2019: TAR 1, 2, 3, 7 Fisheries New ZealandWhen rebuilding a stock, regard should be given to relevant social, cultural and economic factors. This
is of particular importance when considering the target, rate and way in which a stock is moved
towards or above a level that can produce the MSY (Section 13(3) of the Act).
The Minister’s decision letter from the 2018 October Sustainability Round provided some clear
messages in relation to his objectives for the rebuild of this fishery, including:
A biomass target of 40% SB0 was considered robust and to constitute best available
information, noting that an alternative target maybe considered if supported by scientifically
robust and peer-reviewed information;
Support for a rebuild timeframe of 10 years; and
Acknowledgement that a 20% reduction (in 2018) will begin the process of rebuilding the
stock, but will not rebuild the stock at the rate and to the target agreed without significant
further measures.
In addition to these messages, the Minister acknowledged the work Industry had done to gather more
information to better inform tarakihi management and support stock rebuild, and invited the Industry to
submit a plan detailing this work for inclusion as part of the October 2019 Sustainability review for
tarakihi.
The proposed targets, and the associated way and rates of meeting those target under the different
options, are summarised in Table 4 below.
Table 4: The 3 rebuild options for the tarakihi stock in TAR 1 (east), 2, 3, and 7 (Cook Strait).
Option 1 Option 2 Option 3
Target 40% SB0 40% SB0 35% SB0
< 27 years, or 6.75*Tmin
Industry has indicated that the
Rebuild timeframe management actions outlined
12 year, or 2.4*Tmin 11 years, or 2.1*Tmin
(years) (Rate) in its plan will contribute to a
faster rate of rebuild, but the
actual time frame is unclear.
Catch reductions: 35% Industry Rebuild Plan: catch
Method of Catch reductions: 31%
reduction in TACC spreading, move on rules, and
achieving target reduction in TACC;
implemented in increased fishing selectivity to
(Way) implemented in 2019/20
2019/20 avoid juvenile/ unwanted fish.
The HSS proposes a proxy target of 40% SB0 for long-lived stocks such as tarakihi in the absence of a
robust, peer reviewed alternative. A target of 35% SB0 represents the industry proposed alternative.
While both targets meet the risk profiles in the HSS, Fisheries New Zealand would also encourage
industry to consider through its submission on this consultation, evidence that would demonstrate that
35% SB0 will provide for MSY, as is required under the Act. The Southern Inshore Science Working
Group was not able to determine if 35% SB0 was a more appropriate target than 40% SB0 due to the
lack of supporting evidence.
Based on the current stock status of 15.9% SB0, and taking into account the HSS, a formal, time-
constrained rebuilding plan for tarakihi is required. The HSS deems a stock to be fully rebuilt when
there is at least a 70% probability the stock is at or above the target. At 50% probability it is deemed
that a rebuilding plan is no longer required. Due to the fluctuating nature of fish stocks, an acceptable
level of probability that has been adopted to measure progress towards achieving the rebuild target is
50%.
The stock assessment determined that East Coast tarakihi would require a minimum of 5 years to
rebuild to the target of 40% SB0, or minimum of 4 years to rebuild to a target of 35% SB0, in the
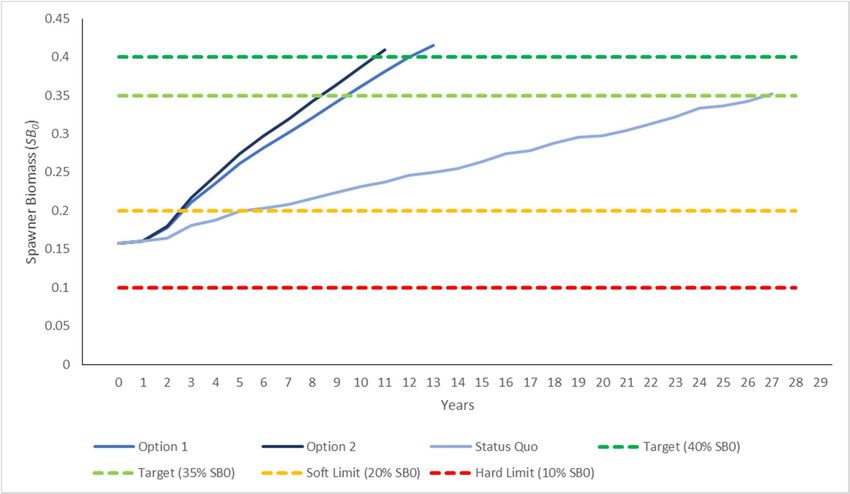
Fisheries New Zealand Review of sustainability measures October 2019: TAR 1, 2, 3, • 11absence of fishing. The HSS suggests a rebuild timeframe of 2*Tmin, where Tmin is the stock rebuild time in the absence of fishing (e.g. 5 years or 4 years depending on the target). To meet either of these timeframes, significant changes to the current regime are required. Figure 7 (below) compares the rebuilding rates for Options 1, 2 and the Status Quo. Option 3 (Industry Rebuild Plan) was not included in the graph below because the timeframe associated with the Industry Rebuild Plan as a whole package is not known. The Industry Rebuild Plan is proposing that its management actions will accelerate the rate of rebuild compared to the status quo, but does not define a timeframe. While the HSS provides guidance, the Minister has discretion regarding the choice of target biomass and the way and rate the stock is moved towards the target. Alternative TACs and rebuilding timeframes may be chosen by the Minister in consideration of the relevant factors. Figure 7: Comparison of rebuild rates for options 1, 2 and the status quo. Option 3 has not been displayed as the rebuild rate is unable to be calculated. The status quo represents the worst case scenario without any additional controls. 9.2 Setting or varying the allowances Having set the TAC, the Minister must make allowances for Māori customary non-commercial fishing interests, recreational fishing interests, and all other mortality to the stock caused by fishing, and then set or vary the TACC (as provided for in sections 20 and 21 of the Act). 9.2.1 CUSTOMARY NON-COMMERCIAL AND RECREATIONAL ALLOWANCES There are no proposals to change the current allowances for customary non-commercial and recreational catch. Customary non-commercial catch in the East Coast tarakihi fishery makes up only a small component of total removals (
day (depending on location), 4 tarakihi or less per person per day were landed on 73% (TAR 1), 51%
(TAR 2), 97% (TAR 3) and 84% (TAR 7) of recreational fishing trips.

9.2.2       ALLOWANCE FOR ALL OTHER MORTALITY TO THE STOCK CAUSED BY FISHING
All options propose allowances for other sources of fishing mortality equivalent to 10% of the
commercial catch. The proposed allowances account for illegal take, under-reporting, death of fish
required to be returned to sea, “ghost fishing” by lost gear, and burst nets.

9.3 Analysis of options for varying TAC and TACC
The options proposed outline two approaches to manging the rebuild of a fish stock. Options 1 and 2
represent the more traditional approach of adjusting the TAC, whereas Option 3 proposes alternative
management measures outside of TAC settings. These approaches are not exclusive and can be
combined where appropriate to achieve an effective outcome.

Fisheries New Zealand is interested in stakeholder feedback pertaining to which is the most
appropriate approach for the rebuild of East Coast tarakihi, or whether combining aspects of these
approaches is preferred.

Furthermore, regardless of which option is selected Fisheries New Zealand is committed to regular
monitoring and review of the East Coast tarakihi fishery to ensure its rebuild.

Option 1
Table 5: Summary of Option 1.

                   Target                                                       40% SB0

            Rebuild rate (years)                                           12 years or 2.4*Tmin

        Method of achieving target                 Catch reductions: 31% reduction in TACC; implemented in 2019/20

Option 1 represents a 31% reduction to the combined TACC for TAR 1, 2, 3 & 7. The Minister
proposed that this option be considered for the 2019 review as part of his decisions outlined in the
2018 Decision Document6.

The changes to TAC and TACC in Option 1 allow for East Coast tarakihi to recover to its management
target of 40% SB0 in 12 years (with a 50% probability). This would lead to a rebuild timeframe that is 2
years longer than that recommended by the HSS.

The primary difference between Option 1 and Option 2 is how the TACC reductions are shared across
the four stocks. Under Option 1, the TACC reduction for TAR 1 is assumed to be spread across the
entire stock, and not taken solely from the East Coast portion of the QMA. This assumption was made
because if the entire TACC cut was implemented in the East Coast portion of TAR 1 it would result in
an approximate 90% reduction in catches from the East Coast portion of TAR 1, effectively closing the
fishery.

The economic impact of this Option is estimated to be $7.3 million per annum over 12 years, and is
the largest economic impact over the period of rebuild (refer section 9.4 below).

Option 1 aligns with the objectives in the relevant Iwi Fisheries Forum Plans, primarily by ensuring that
the stock will rebuild to a level that supports specific goals, such as ensuring a thriving fishery, within a

6
    https://www.fisheries.govt.nz/news-and-resources/consultations/review-of-sustainability-measures-for-1-october-2018/

Fisheries New Zealand                                               Review of sustainability measures October 2019: TAR 1, 2, 3, • 13
significantly shorter timeframe than would be achieved through Option 3, but will take 1 year longer
than the rebuild time proposed under Option 2.
Option 2
Table 6: Summary of Option 2.
Target 40% SB0
Rebuild rate (years) 11 years or 2.1*Tmin
Method of achieving target Catch reductions: 35% reduction in catch; implemented in 2019/20.
Option 2 represents a 35% reduction to the combined TACC for TAR 1, 2, 3 & 7. This option results in
the largest catch reductions to East Coast tarakihi, and therefore the fastest rate of rebuild. This option
is the closest to the guidance in the HSS, which recommends a rebuild timeframe of 10 years for a
target of 40% SB0.
The changes to the TAC and TACC in Option 2 allow for the stock to recover to a management target
of 40% SB0 in 11 years (with a 50% probability).
The difference between this option and Option 1 is that the TACC reductions are evenly shared across
the whole of the East Coast tarakihi stock. In practice this amounts to a 50% reduction to the TACC of
TAR 2 and TAR 3, as well as 50% reductions to the East Coast portion of TAR 1 and the Cook Strait
portion of TAR 7.
The economic impact would be approximately $8.1 million per annum over 11 years (refer Section 9.4
below).
Option 2 aligns with the objectives in the relevant Iwi Fisheries Forum Plans, primarily by ensuring that
the stock will rebuild to a level that supports specific goals, such as ensuring a thriving fishery, within a
shorter timeframe than would be achieved through Option 1 or 3.
Option 3
Table 7: Summary of Option 3.
Target 35% SB0
≤ 27 years or 6.75*Tmin
Note: this is the worst case rebuild timeframe and doesn’t take into
Rebuild rate (years) account any reduction to the rebuild timeframe as a consequence
of the additional management action. The Industry Rebuild Plan
proposes that the management actions outlined in the plan will
accelerate the rate of rebuild, but does not define a timeframe.
No TAC/TACC/Allowance cuts.
Method of achieving target Industry Eastern Tarakihi Management Strategy and Rebuild Plan:
i.e., catch spreading, move on rules, and increased fishing
selectivity (avoid catching unwanted fish).
Option 3 proposes no reductions to catch limits or allowances, and instead proposes to rebuild the
stock through a combination of management measures as outlined in the Industry Rebuild Plan (see
Appendix 1).
14 Review of sustainability measures October 2019: TAR 1, 2, 3, 7 Fisheries New ZealandThe Industry Rebuild Plan supports a management target of 35% SB0. The industry consider that this
target more accurately reflects the HSS requirements when the species specific requirements of
tarakihi are taken into account.
Stock assessment projections show that, based solely on current catch limits, the stock would rebuild
to a target of 35% SB0 over 27 years (6.75*Tmin). This represents the slowest rebuild rate of the three
options. The Industry Rebuild Plan, however, proposes that additional management actions will
accelerate the current rate of rebuild, but the accelerated timeframe is unknown, when taking into
account the package of measures proposed.
Fisheries New Zealand notes there is uncertainty as to whether the Industry Rebuild Plan will deliver
an accelerated rate of rebuild. This is because research is still being undertaken on the effectiveness
of some of the proposals outlined in the Industry Rebuild Plan, including trials on selectivity of fishing
gear.
The economic impact would be approximately $3.1 million per annum until the rebuild is achieved
(refer Section 9.4 below), or over 27 years in the absence of additional controls delivering
sustainability outcomes.
Eastern Tarakihi Management Strategy and Rebuild Pan 2019
The plan, Supporting a Sustainable Fishery: Eastern Tarakihi Management Strategy and Rebuild Plan,
is attached in Appendix 1 and summarised below. The plan has been submitted to the Minister of
Fisheries for consideration by Fisheries Inshore New Zealand, Te Ohu Kaimoana and Southern
Inshore Fisheries.
The Industry Rebuild Plan proposes an alternative to further catch reductions for the rebuild of East
Coast tarakihi.
Objective: Implement an effective strategy to rebuild and maintain a healthy fishery for our future
generations.
Goal: To rebuild and maintain the stock at or above the biomass that achieves maximum sustainable
yield.
Action: Engaged and active management throughout the entire rebuild timeframe and beyond.
Work stream 1: Management Measures:
Industry modelling indicates that improved selectivity from commercial gear could potentially
increase the rate of rebuild.
As part of this strategy industry has committed to selectivity research, move-on rules to avoid
juvenile tarakihi, reduction in targeting of tarakihi, and voluntary closed areas. In addition to
this, industry has committed to catch spreading to reduce the pressure on the East Coast
portion of TAR 1 and TAR 7.
The industry has committed to the development of an East Coast tarakihi management
procedure informed by the 2021 stock assessment.
Initially, it is proposed that all these measures will be implemented on a voluntary basis,
however industry has proposed the use of overfishing thresholds provided for in section 77 of
the Fisheries Act as a method to restrict specific permit holders that do not follow the agreed
management measures.
Work stream 2: Enhancing Science:
Industry has acknowledged that implementing a successful strategy to rebuild and maintain
the East Coast tarakihi fishery requires a long-term research plan that provides the
appropriate information to make informed decisions.
Fisheries New Zealand Review of sustainability measures October 2019: TAR 1, 2, 3, • 15Industry has committed to undertake additional fisheries surveys to assist in verification of
commercial fishing data, additional catch sampling, and management strategy evaluations via
computer modelling scenarios.
35% SB0 as a management target
Fisheries New Zealand is seeking further information on the suitability of the alternative management
target of 35% SB0.
This target was presented to the Southern Inshore Science Working Group in February 2019. It is
acknowledged that both targets (35% SB0 and 40% SB0) meet the risk profiles in the HSS, but the
Working Group was not able to determine if 35% SB0 was a more appropriate target than 40% SB0,
due to the lack of supporting evidence. Furthermore, Fisheries New Zealand is interested in
understanding how a target of 35% SB0 will provide for MSY as required by the Act. We would
encourage industry to provide this evidence, as part of their submission in response to consultation.
Actions to expedite rebuild
The rate at which the package of management actions described in the Industry Rebuild Plan will
deliver a rebuild of East Coast tarakihi remains unclear. Further detail, commitments and certainty
around a target rebuild time would be useful to support Option 3 and Fisheries New Zealand is having
ongoing discussions with industry in this regard.
The Industry Rebuild Plan does provide detail around a specific measure within the plan and how it
will expedite the rebuild time. That is, increasing the average size of fish caught, otherwise interpreted
as the age of the fish caught, by one year, through catch selectivity improvements it is proposed to
reduce the rebuild time by approximately 12 years. Catch selectivity trials conducted by industry are
underway. These are aimed towards determining the types of selectivity measures required to achieve
an increase in size/age of catch. Fisheries New Zealand welcomes these trials and is interested in
receiving further evidence on the success of certain selectivity measures.
9.4 Economic evaluation
The economic assessment compares the TACC reductions to the 2017 pre-rebuild limits, multiplied by
port price. This was done to compare the economic impact of the total rebuild, and not just the
additional cuts proposed in 2019. The relative loss in revenue under the 3 rebuild options is
summarised in Table 8. The expected effect on revenue ranges between $3.115 million and $8.175
million per annum. To put this in perspective the total value of the TAR 1, 2, 3 and 7 fishery in 2017,
prior to the commencement of the rebuild commencing, was approximately $16.7 million.
16 Review of sustainability measures October 2019: TAR 1, 2, 3, 7 Fisheries New ZealandTable 8: Current TACCs for TAR 1, 2, 3, and 7, proposed TACC reductions, and predicted revenue change based on reported port
prices
Option Stock TACC Change from 2017 (t) Predicted revenue change ($ p.a.)
TAR 1 1447
TAR 2 1796
2017 settings
TAR 3 1403
TAR 7 1088
TAR 1 625 822 $2,433,120
TAR 2 1100 696 $2,714,400
Option 1 TAR 3 539 864 $1,978,560
TAR 7 985 103 $209,090
TOTAL 2485 $7,335,170
TAR 1 784 608 $1,799,680
TAR 2 750 1046 $4,079,400
Option 2 TAR 3 520 883 $2,022,070
TAR 7 933 135 $274,050
TOTAL 2672 $8,175,200
TAR 1 1097 350 $1,036,000
TAR 2 1500 296 $1,154,400
Option 3 TAR 3 1040 363 $831,270
TAR 7 1042 46 $93,380
TOTAL 1055 $3,115,050
Fisheries New Zealand notes that while there are significant differences between the options on a per
annum basis, when compared to the total life of the rebuild the financial impact is similar (Option 1:
$88 million for 12 years; Option 2: $90 million for 11 years; Option 3: $84 million for 27 years). This
however assumes the slowest rebuild timeframe for Option 3. If the Industry Rebuild Plan is
successfully implemented, the rebuild may occur at a faster rate and could lead to lower total
economic impacts.
Industry has raised concerns about the risk of tarakihi becoming a choke species; i.e. there may be a
risk that other species caught in association with tarakihi are constrained due to the reduction in
availability of tarakihi Annual Catch Entitlement (ACE), thereby increasing the overall economic impact
on the fishing industry.
The proposed options will have significant impacts on fishers, their livelihoods and the communities in
which they live. We also acknowledge that there is uncertainty surrounding the economic impacts, as
the economic assessment has been based on port price 7 only, therefore this assessment is
considered indicative only.
Fisheries New Zealand has commissioned a more detailed economic analysis of the rebuilding
options. This will include, but not be limited to: the consideration of impacts on ACE packages and
ACE trading for individual operators and companies; impacts on both target, bycatch, and associated
species with specific consideration of tarakihi becoming a choke species for other fisheries; and
7
Port price is the price, per kilogram a fisher receives for fish when sold to a licenced fish receiver.
Fisheries New Zealand Review of sustainability measures October 2019: TAR 1, 2, 3, • 17identification of ports, regions or markets that may be disproportionately impacted by management changes. To assist the Minister in making an informed decision, we encourage submitter’s views on each option and what they consider the socio-economic impacts will be. The results of the detailed economic assessment along with the information that stakeholders provide in submissions, will be provided in the final advice to the Minister. 9.5 Environmental interactions The key environmental interactions with the fishery, which must be taken into account when setting or varying TAC and TACC, are summarised below. Marine mammals There have been instances on the East Coast of the South Island where penguins and the nationally vulnerable Hector’s dolphins have been caught in commercial and non-commercial set nets. To manage this risk, there are extensive areas within TAR 3 that are closed to set netting and trawling. Reductions in fishing effort on tarakihi may result in an overall reduction in trawl effort in some areas, therefore impacts on marine mammals may be reduced. Fish bycatch Tarakihi is taken as a target and bycatch in a number of fisheries. Reductions in TACCs for tarakihi may lead to a shift in fishing effort to other species, such as red cod, barracouta, and flatfish (TAR 3 and 7) or red gurnard, snapper and trevally (TAR 2) for example. However, catch of these species is sustainably managed through the TAC and TACC set for these individual stocks. Reductions in fishing effort on tarakihi may result in an overall reduction in trawl effort in some areas, therefore additional impacts on bycatch species are unlikely. Seabirds The ‘National Plan of Action – 2013 to Reduce the Incidental Catch of Seabirds in New Zealand’ (NPOA Seabirds 2013), which is currently under review, guides actions to reduce the incidental mortality of seabirds from fishing. The species at highest risk in relation to the East Coast tarakihi fishery are the black petrel and flesh- footed shearwater in Fisheries Management Area (FMA) 1 in the bottom longline and trawl fisheries. As part of the review of the NPOA Seabirds, mitigation devices and their guidelines for deployment in both fisheries are being revised to minimise risk of seabird capture. Reductions in fishing effort on tarakihi may result in an overall reduction in trawl effort in some areas, therefore impacts on seabirds may be reduced. Biological diversity Reductions in fishing effort on tarakihi may result in an overall reduction in trawl effort in some areas, therefore impacts on biological diversity may be reduced. Habitats of significance Reductions in fishing effort on tarakihi may result in an overall reduction in trawl effort in some areas, therefore impacts on habitats of significance may be reduced. 18 Review of sustainability measures October 2019: TAR 1, 2, 3, 7 Fisheries New Zealand
10 Questions for submitters on options
Which option is most appropriate for achieving a rebuild of East Coast tarakihi, taking into account
social, cultural and economic factors?
Do you support rebuilding the stock through traditional TAC adjustments (Option 1 and 2) or
alternative measures in collaboration with industry (Option 3) or a combination of the two types of
approaches?
Which option proposes the most appropriate rebuild timeframe and why?
Is there any other evidence that you feel should be considered in this review and why?
Which option sets the most appropriate commercial catch limits and why?
Is the customary allowance for East Coast tarakihi appropriate and why?
Are the recreational allowances for East Coast tarakihi appropriate and why?
Are the allowances for other sources of fishing mortality appropriate and why?
11 Deemed values
The purpose of deemed values are to provide incentives for commercial fishers to balance the catch of
QMS species with Annual Catch Entitlement within each fishing year. The deemed value rates for TAR
1, 2, 3 and 7 were last reviewed for 1 October 2018. Fisheries New Zealand is not proposing a review
tarakihi deemed values as part of the October 2019 sustainability round.
12 Referenced reports
June 2019 Fisheries Assessment Plenary: https://www.fisheries.govt.nz/news-and-resources/science-
and-research/fisheries-research/.
Fisheries New Zealand (2008). Harvest Strategy Standard for New Zealand Fisheries. Fisheries New
Zealand, Wellington, New Zealand: https://fs.fish.govt.nz/Page.aspx?pk=113&dk=16543
2017 National Panel Survey of Marine Recreational Fishers: Pending release – June/July 2019:
https://www.fisheries.govt.nz/dmsdocument/20816/send
Draft Inshore Finfish Fisheries Plan (2011), Ministry of Fisheries, Wellington, New Zealand.
13 How to get more information and have your say
Fisheries New Zealand invites you to make a submission on the proposals set out in this discussion
document. We must receive your submission by 5pm on 26 July 2019. Please see the Fisheries New
Zealand sustainability consultation webpage (https://www.fisheries.govt.nz/news-and-
resources/consultations/review-of-sustainability-measures-for-1-october-2019) for related information,
a helpful submissions template, and information on how to submit your feedback. If you cannot access
the webpage or require hard copies of documents or any other information, please email
FMSubmissions@mpi.govt.nz.
Fisheries New Zealand will be holding public stakeholder meetings in Auckland, Napier and
Christchurch during the consultation period. Refer to the Fisheries New Zealand website for further
information relating to the time, date and location of the meetings: https://www.mpi.govt.nz/fisheriesnz.
Fisheries New Zealand Review of sustainability measures October 2019: TAR 1, 2, 3, • 19Appendix 1 Supporting a Sustainable Fishery – Eastern Tarakihi Management Strategy and Rebuild Plan 2019. Prepared by Fisheries Inshore New Zealand, Southern Inshore Fisheries and Te Ohu Kaimoana. See the Fisheries New Zealand consultation page on the 2019 October Sustainability Measures to down load this appendix. 20 Review of sustainability measures October 2019: TAR 1, 2, 3, 7 Fisheries New Zealand
You can also read