EAGLE ENERGY INC. Eagle Presentation | January 4, 2018 - All Information Contained
←
→
Page content transcription
If your browser does not render page correctly, please read the page content below
All Information Contained
  in this Presentation is
   Confidential and for
 Internal Purposes Only

                       EAGLE ENERGY INC.
                Eagle Presentation | January 4, 2018
Upside in Eagle
Eagle is one of the best positioned companies to benefit from a rebound in oil
prices
Significant liquids production, high netback and a stable asset base with low decline.
Total Proved Net Asset Value Per Share
Potential to unlock significant value in our assets
We have identified 218 potential horizontal drilling opportunities on existing Eagle
lands in North Texas.
We have identified greater than 80 potential horizontal drilling opportunities at
Twining.
Management’s core competencies are directly aligned with maximizing the
probability of success of these opportunities.
2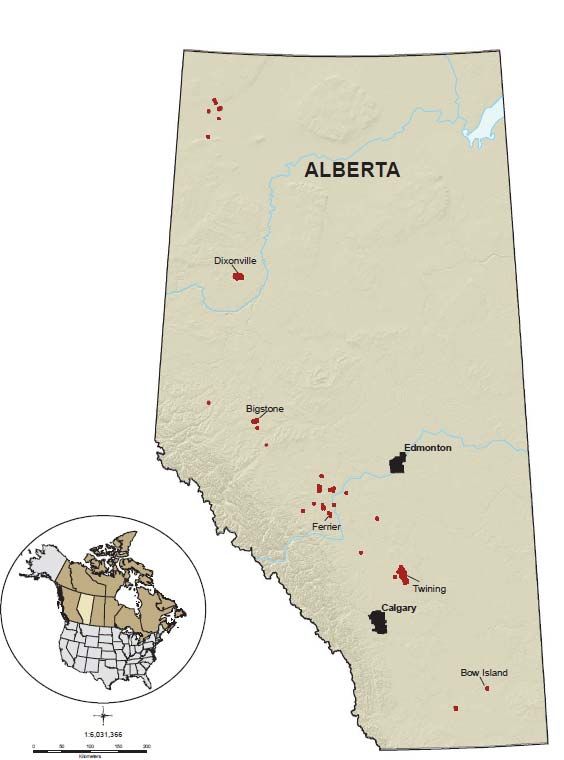
Eagle Summary
Eagle operates 350 active wells (1) in Alberta and Texas
Corporate decline rate of 10%
Total Proved (“1P”) Reserves of 14.2 million boe and Total Proved plus Probable
(“2P”) Reserves of 20.9 million boe (2)
Q3 2017 Field Netback of $17.85/boe
2017 Guidance
Production: 3,700 to 3,900 boe/d
Operating Costs: $2.1 to $2.3 million per month
Capital Budget: $23.0 million
Symbol: TSX:EGL
Long Term Debt: $US 58.2 million
Shares Outstanding (basic): 43.3 million
Market Cap: $15.2 million (3)
Notes:
(1) Includes producing wells and injectors.
(2) Per McDaniel & Associates Consultants Ltd., and Netherland, Sewell & Associates, Inc., Eagle’s independent reserves evaluators, with an effective date of December 31, 2016.
(3) Based on a share price of $0.35/ share at January 2, 2018.
3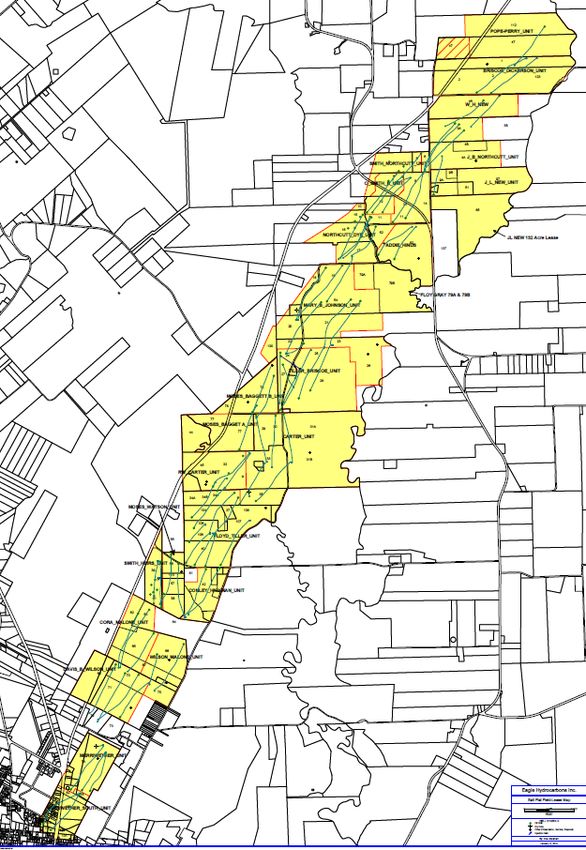
Eagle’s Canadian Assets

                     •     80% liquids
                     •     90% operated
  Concentrated
                     •     Dixonville is a premier Montney light oil waterflood in
  High Quality
                           Western Canada
 Asset Base with
   Operational       •     Twining is a large conventional Pekisko light oil pool with a
     Control               low recovery factor where new Horizontal well technology        Dixonville:
                           has unlocked significant additional reserves                    •   Decline < 10%
                                                                                           •   Large discovered oil initially in place
                                                                                           •   Future waterflood enhancement and drilling

   Low Decline       •     Low decline rate
Production, High     •     PDP reserves 77% of 1P and 52% of 2P
  PDP Reserves
                     •     Greater than 80 potential horizontal drilling
 with Significant
                           opportunities at Twining in addition to the 12 horizontal
     Growth
                           wells that Eagle or its predecessors have drilled
  Development                                                                                   Twining:
                                                                                                •   Decline ~ 5%
 Opportunities                                                                                  •   On‐going Conventional Horizontal Development

                     •     Current LMR is 3.24(1)
Low Near–Term        •     Low inactive well count
 Abandonment
                     •     Low abandonment liability over the next 10 years
   Liability,
   High LMR          •     Our Canadian asset base therefore positions us favourably to
                           changes to the abandonment regulations in Alberta

Notes:
(1) At November 4, 2017.
                                                                    4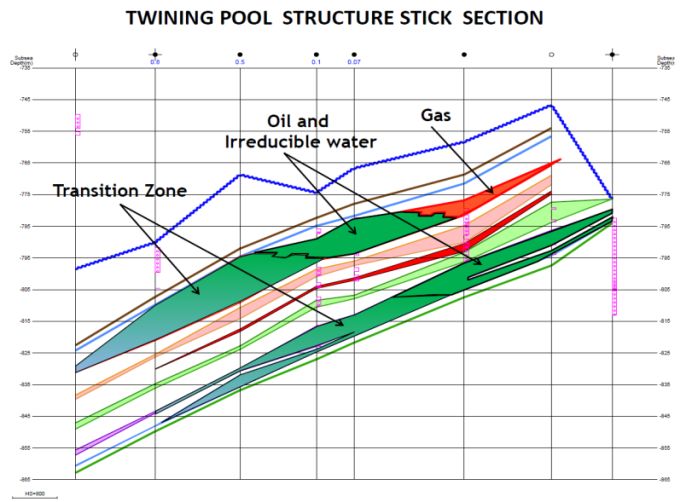
Eagle’s US Assets

                   •   99% liquids
                                                                                                     North Texas :
                   •   100% operated                                                                 •   Substantial core growth area with ~ 24,000 acres
 Concentrated                                                                                        •   218 horizontal drilling opportunities on existing land
                   •   Salt Flat is a large light oil pool from the Edwards limestone.               •   Applying new horizontal well technology in existing
 High Quality                                                                                            conventional reservoir
                       Eagle has drilled over 58 horizontal wells and completed many
Asset Base with
                       production enhancement and operating cost reduction projects
  Operational
    Control        •   North Texas is a light oil asset and is the major growth area of
                       Eagle where existing production, infrastructure and land holdings
                       of over 24,000 net acres give Eagle a strategic advantage

                   •   Decline rate ~20%
                   •   Low differential to WTI and low operating
                        costs, Salt Flat is our highest netback property
                   •   Significant geological and geophysical work over the
High Netback Oil       last two years has resulted in the accumulation of
with Significant       land and opportunities in North Texas                       Salt Flat :
    Growth         •   218 potential horizontal drilling opportunities to be       •   On‐going conventional horizontal development
 Development           developed on existing acreage in North Texas
                                                                                       and production operation enhancements

 Opportunities
                   •   Horizontal wells with capital costs in the $US 2.5
                       million range in North Texas
                   •   Based on the plan and the type well production
                       forecast, production in North Texas could grow to
                       4,000 boe/d in the next 3 years

                                                                 5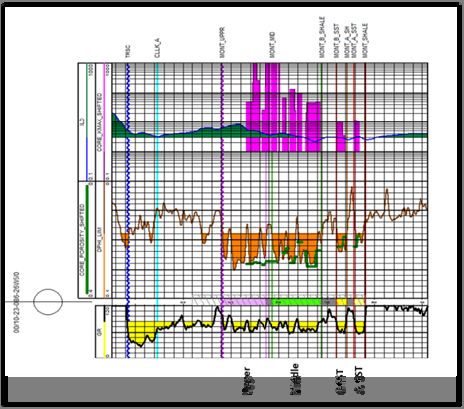
2016 Year‐End Reserves (1)

     Excellent year-over-year reserve performance
         •          Total proved plus probable reserves of approximately 20.9 million boe (68% proved, 52% proved producing)

         •          PV10 value on total proved plus probable reserves of approximately $270 million

         •          Proved plus probable reserve life index of 15 years

                                                                Reserves by Category                                        PV10 Value ($MM)
         McDaniel & Associates
             Price forecast
           (as of Jan 1, 2017)

                                                                    29%                                                       $79
                         WTI Crude Oil
             Year
                             $/bbl
             2017            55.00
                                                                                            52%                                                      $153
             2018            58.70
                                                                                                                             $29
             2019            62.40                                    13%

             2020            69.00
             2021            75.80                                                                                            $10
                                                                          2%

                                                                PDP       PDNP     PUD     Probable                       PDP       PDNP     PUD     Probable

Notes:
1)   Per McDaniel & Associates Consultants Ltd., and Netherland, Sewell & Associates, Inc., Eagle’s independent reserves evaluators, with an effective date of
     December 31, 2016.

                                                                                          6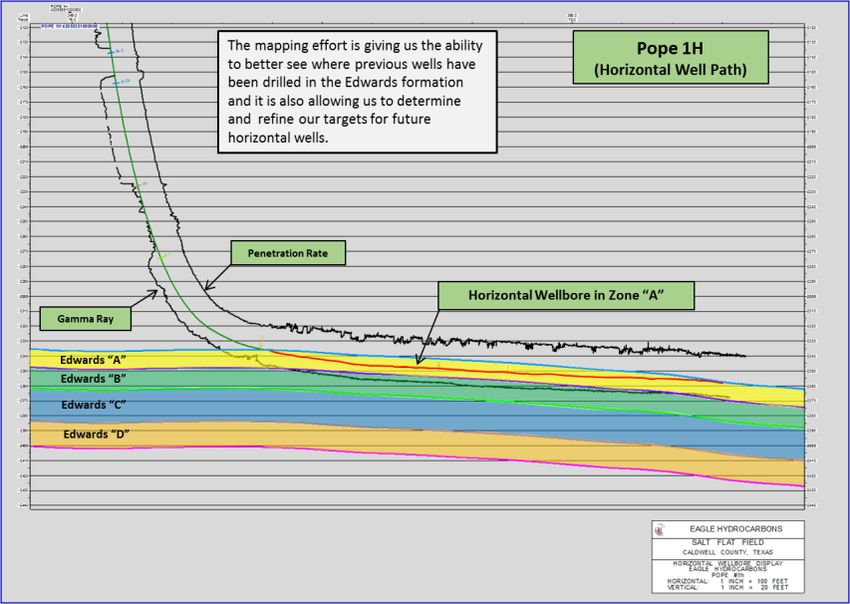
Eagle’s Strategy

 Horizontal Wells in                                    Low Decline
                                                       (Corporate Decline 10%)
 Conventional Plays
  (75% of Eagle Production from                      Liquids Production
        Horizontal Wells)                                   (87% Liquids)

                                          TOTAL
                                       SHAREHOLDER
                                         RETURN

  Build Inventory of
                                                     Focus on Return to
  Low Risk Locations
                                                       Low Leverage
     for Growth
 ( 218 Potential Horizontal Drilling                   Balance Sheet
   Opportunities in North Texas)

                                             7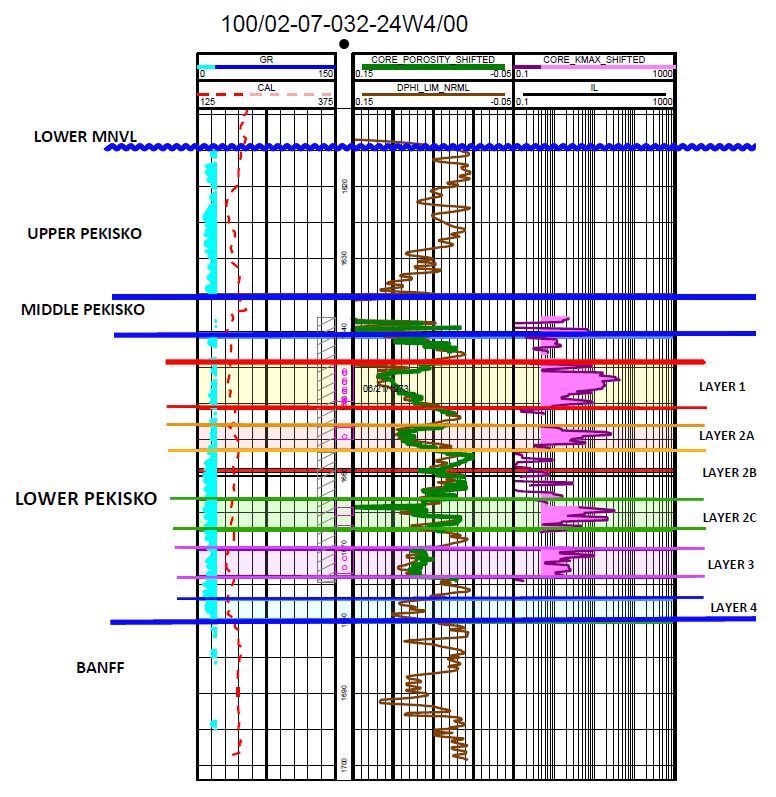
Eagle’s History and the Pivot to Growth
Discovery Growth Sustainability
Twining ‐ Pekisko
Eagle’s Proved
Developed Assets
Decreasing Risk
Dixonville ‐ Montney
Eagle’s
North Texas existing
opportunities
on a risk and
development
continuum
Salt Flat Edwards Benches
Time and Capital
Historically, Eagle’s asset growth was through acquisitions (Salt Flat 2010, North Texas 2014, Dixonville
2014, Twining 2015 and NW Alberta 2016).
Asset growth through acquisitions and sustaining production through capital investment provided for a
dividend paying model.
With the fall in oil prices, access to additional capital for acquisitions became limited for juniors the size
of Eagle.
Eagle looked within its existing asset base and identified organic opportunities that could create
sustainable growth.
8
Eagle’s Operational Core Competencies and Successes
Proven success year‐over‐year in operational efficiency of conventional assets
Water disposal/injection optimization
LOE Improved artificial lift
18%
Operating cost optimization projects
Skilled at operating waterfloods and fields with high water cuts
Top quartile capital efficiency and FD&A
FD&A Proven driller and operator of horizontal wells in conventional fields
53% Highly successful, focused and disciplined operating team
Cap Eff Strong geological and geophysical capability with proven track record
30%
of developing successful plays
Effective and efficient operator in multi‐jurisdiction and regulatory
environments
Strong reservoir management team
RRR Detailed understanding of fields and reserve drivers
272% Excellent reservoir management process and execution
Notes:
(1) LOE: Lease Operating Expenses, FD&A: Finding , Development & Acquisition Costs, Cap Eff: Capital Efficiency, RRR: Reserves replacement ratio 2P
(2) The average decrease in our LOE is before the effects of foreign exchange.
9Eagle Compared Favourably to its Peers in 2016
In 2016, Eagle was the only company in its peer group that
achieved ALL of the following:
Grew average production (+ 18%),
Grew total proved plus probable reserves (+ 13%),
Reduced operating costs per boe (‐ 12%),
Reduced general and administrative costs per boe (‐ 16%), AND
Reduced net debt (‐ 8%).
Eagle accomplished this while exhibiting fiscal discipline by keeping capital
expenditures below its cash flow.
10Peer Analysis
Eagle has one of the lowest decline rates and highest PDP reserves per share of its
peer group which highlights the high quality and stable nature of the asset base.
Notes:
(1) Decline rate based on public data and from published corporate presentations.
(2) Per McDaniel & Associates Consultants Ltd. and Netherland, Sewell & Associates, Inc., Eagle’s independent reserves evaluators, with an effective date of
December 31, 2016.
11Peer Analysis (Cont’d)
Eagle’s LMR is healthy at > 3.0 and trending above the 50 percentile of the peer group,
with a low total inactive well count, which will limit Eagle’s exposure to changing
abandonment regulations from the Alberta Energy Regulator.
Notes:
(1) Liability Management Ratio (LMR) at November 4, 2017 as published by the Alberta Energy Regulator (AER). The LMR is an assets to liabilities comparison
used by the AER to monitor the likelihood an energy company can meet its future abandonment and decommissioning liabilities .
(2) Inactive well list as of November 4, 2017.
12North Texas
24,000 net acres in our core area. Focused and well supported by offset production and
3D seismic.
218 potential horizontal drilling opportunities on our lands.
Not a high risk exploratory play. A development drilling project with solid well control
and production history. Completely within Eagle’s core competency and successful track
record of horizontal well development.
We have completed the technical subsurface and engineering work, giving us a
significant competitive advantage, including over 250 square miles of seismic data, with
processing and interpretation complete and proprietary to Eagle and Eagle‐owned
infrastructure including facilities, pipeline and gathering lines.
Eagle will be the first to exploit this asset with horizontal wells using current completions
techniques.
13North Texas Cont’d
Cleveland*
• Decline 18% North Texas
• Core growth area with > 24,000 net acres and
(TX Panhandle Area)
growing Age of Formation Middle Pennsylvanian Upper Pennsylvanian
• 218 potential horizontal drilling opportunities Depth Range 6800’ – 7700’ MD 7000’ – 9000’ MD
identified on existing land Rock Type Sandstone Sandstone
• Extensive seismic and geological database Matrix Porosity 12 – 14% 14 – 16%
• IRR > 40% at $50/bbl WTI Production Type Light Oil Oil/Higher GOR
Matrix Permeability Low Low
Play Area (Counties) 4+ 6
North Texas development similar to highly successful Cleveland play in the
Texas Panhandle.
Notes:
(1) The type curve was derived from production of offset wells in the existing formation and was prepared by a non-independent reserves evaluator in accordance
with the COGE Handbook as at September 15, 2016.
14North Texas Cont’d
Initial development will include drilling 2 horizontal wells
Subsequent drilling pace is subject to well results, commodity prices and capital availability, but
could target 8 to 12 wells in 2018 and 12 to 18 in 2019:
Potential
Year Capital Phase
Opportunities
2017 1 Well $3 million
Delineation Phase
2018 1 + 8 to 12 Wells $23 to $33 million
2019 12 to 18 Wells $30 to $45 million
Development Phase
2020 + + 24 Wells per Year > $60 million per Year
Assumes $3.0 million capital per well for the first two development wells and $2.5 million per well thereafter
All costs in US Dollars
Based on the plan and the type well production forecast, production in North Texas could grow to
4,000 boe/d in the next 3 years.
Based on a flat commodity forecast of $US 50/bbl WTI, North Texas could become self‐funding by
2020.
15Salt Flat
• Conventional oil pool with production from the
Edwards limestone formation
• Eagle acquired the property in 2010
• Eagle operates at an 80% to 100% working interest Lockhart, TX
• Decline ~ 25%
• Eagle has drilled over 58 horizontal wells and
completed numerous enhancement and operating cost
projects
• Shot a comprehensive 3D Seismic program in 2014
• Inventory of over 12 low risk development locations in
the Edwards A formation
• IRR of drilling locations > 50% at $50/bbl WTI
• Additional potential opportunity in the other Edwards
benches
Luling, TX
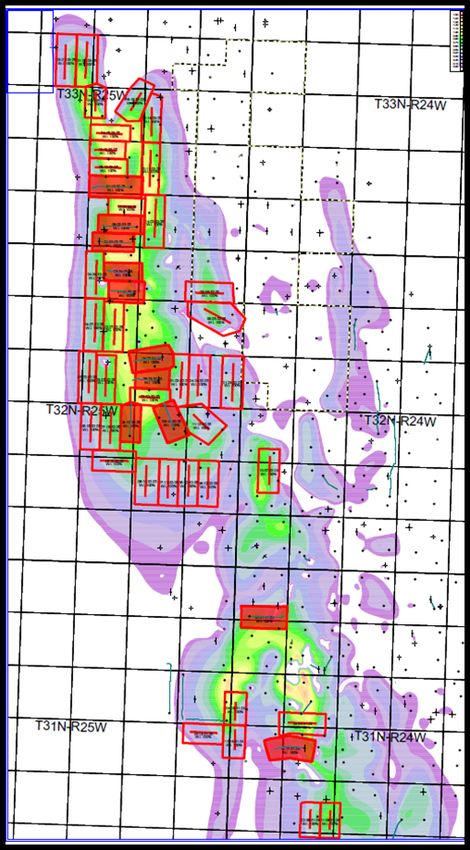
16Twining
• Conventional vertical and horizontal well
production from the largest Pekisko oil pool in
the Western Canadian Sedimentary Basin
• > 900 million barrels of discovered oil initially in
place
• Current pool recovery ~ 5%
• Low decline of 5%
• On‐going conventional horizontal development
• 12 Horizontal wells drilled to date
• Greater than 80 potential horizontal drilling
opportunities
• IRR > 20% at $55/bbl WTI
17Dixonville
• Three operating expense reduction projects
underway
• Horizontal well waterflood on production 2003
• Montney oil zone is a multi‐layered turbidite
deposit with porosity of 18 to 22% and
permeability of 12 to > 100 md
• Eagle operates at 50% working interest
• Decline < 10%
• Discovered oil initially in place of 150 Mmbbls
(6% recovery to date, 16% 1P recovery factor)
• Future waterflood enhancement and drilling
(Ultimate recovery target of 25 to 30% )
18Upside in Eagle
Eagle is one of the best positioned companies to benefit from a rebound in oil
prices
Significant liquids production, high netback and a stable asset base with low decline.
Total Proved Net Asset Value Per Share
Potential to unlock significant value in our assets
We have identified 218 potential horizontal drilling opportunities on existing Eagle
lands in North Texas.
We have identified greater than 80 potential horizontal drilling opportunities at
Twining.
Management’s core competencies are directly aligned with maximizing the
probability of success of these opportunities.
19Appendix
20Third Quarter 2017 Highlights & Operational Update
During the third quarter, Eagle successfully drilled the first horizontal well on its North Texas
property with reservoir quality appearing as good or better than expected along the lateral length.
Year‐to‐date general and administrative charges were 21% lower than the prior year with
expectations of a 23% year over year drop for the full year. Eagle previously announced that
effective September 1, 2017 its aggregate executive compensation (cash and non‐cash on an
annualized basis) had been reduced by 50% from 2016 levels of $2.8 million. Eagle also announced
that it had negotiated a new Houston office lease, which will reduce its 2018 annual rent by 60%, or
$US 170,000, and realize average annual savings of 30% when compared to the terms of its current
office lease.
Eagle announced on December 19, that one month after initial production, the oil, natural gas and
natural gas liquids rates from its first North Texas horizontal well continue to perform at budgeted
levels, with the well producing 450 barrels of oil equivalent per day (350 barrels per day of oil).
Eagle also noted that as of that date the installation of permanent production facilities was
complete and the Company was pleased by the production levels, especially in light of the fact that
only 18 for the 28 planned frack stages were producing.
212017 Guidance
Eagle’s 2017 capital budget is revised, operating cost and production guidance remain unchanged from what Eagle
previously announced on August 10, 2017 and is as follows:
2017 Revised Guidance 2017 Previous Guidance Notes
Capital Budget $23.0 mm $21.0 mm (1)
Average Production 3,700 to 3,900 boe/d 3,700 to 3,900 boe/d (2)
Operating Costs per month $2.1 to $2.3 mm $2.1 to $2.3 mm (3)
As a result of guidance revisions and updated commodity price and foreign exchange assumptions of management,
resulting expected funds flow from operations, ending net debt, and field netback are as follows:
Amount Notes
Funds Flow from Operations $12.2 mm (4)
Ending Net Debt $71.4 mm
Field Netback (excluding hedges) $20.47 / boe (5)
Notes:
1) The revised 2017 capital budget of $23.0 million (previously $21.0 million) consists of $US 11.8 million for Eagle’s operations in the United States and $7.8 million for Eagle’s
operations in Canada.
2) Average production remains in the same range of 3,700 to 3,900 boe/d. The production mix consists of 83% oil, 4% natural gas liquids (“NGLs”) and 13% natural gas. These
numbers include working interest and royalty interest volumes.
3) Operating expense guidance remains the same and is stated on a per month basis rather than per boe basis due to the mostly fixed nature of the costs.
4) 2017 funds flow from operations is expected to be approximately $12.2 million (previously $10.7 million) based on the following assumptions:
a) average production of 3,800 boe/d (the mid‐point of the guidance range);
b) pricing at $US 51.75 (previously $US 50.00) per barrel WTI oil, $US 3.03 (previously $US 3.05) per Mcf NYMEX gas, $CA 2.12 (previously $CA 2.22) per Mcf AECO and
$US 18.11 (previously $US 17.48) per barrel of NGL (NGL price is calculated as 35% of the WTI price);
c) differential to WTI is $US 3.18 discount per barrel in Salt Flat, $US 3.50 discount per barrel in Hardeman in North Texas, $CA 11.50 discount per barrel in Dixonville
and $CA 8.00 discount per barrel in Twining;
d) average operating costs of $2.2 million per month ($US 0.8 million per month for Eagle’s operations in the United States and $1.2 million per month for Eagle’s
operations in Canada), the mid‐point of the guidance range; and
e) a foreign exchange rate of $US 1.00 equal to $CA 1.25 (previously $CA 1.24).
5) This figure assumes average operating costs of $2.2 million per month (the mid‐point of the guidance range) and a $US 51.75 (previously $US 50.00) WTI price. Field netback is
a non‐IFRS financial measure. Refer to the section titled “Advisory Regarding Non‐IFRS Financial Measures” of the “Advisories” slide.
222017 Sensitivities
The following tables show the sensitivity of Eagle’s 2017 funds flow from operations to changes in commodity
prices, production and foreign exchange (“FX”) rates:
Sensitivity to Commodity Price
Funds Flow from Operations 2017 Average Production (3,800 boe/d)
FX 1.20 FX 1.25 FX 1.30
$US 46.75 WTI $11.5 mm $11.8 mm $12.1 mm
$US 51.75 WTI $11.9 mm $12.2 mm $12.5 mm
$US 56.75 WTI $12.3 mm $12.6 mm $13.0 mm
Sensitivity to Production
2017 Average Production
(WTI $US 51.75, FX 1.25)
3,700 3,800 3,900
Funds Flow from Operations ($CA) $11.5 mm $12.2 mm $13.0 mm
Assumptions:
1) Operating costs are assumed to be $2.2 million per month (mid-point of guidance range)
2) Differential to WTI is held constant
3) The foreign exchange rate is assumed to be $US 1.00 equals to $CA 1.25, unless otherwise indicated in the table
23Hedging Program
For the first half of 2018, hedges are in place covering 1,000 barrels of oil per day at
a WTI price of $US 57.50.
24Management
Wayne Wisniewski, P.E., President, Chief Executive Officer and Director
Mr. Wisniewski has over 30 years of experience in the oil and gas industry, starting as a drilling and completion
engineer, and holding various engineering and senior management positions in multiple companies. Prior to
joining Eagle US, Mr. Wisniewski spent the preceding 13 years with a major international energy company,
where he was responsible for production operations exceeding 100,000 boe/d. Mr. Wisniewski holds a
Bachelor of Petroleum Engineering from Texas &M University, where he earned the Harold J Vance Award for
academic achievement, and a Master of Business Administration from Southern Methodist University in
Dallas, Texas. He is a professional engineer registered in Texas and Oklahoma.
Kelly Tomyn, CA, Chief Financial Officer
Ms. Tomyn is a Chartered Accountant with over 25 years of experience in the oil and gas industry developing
and executing financial strategies primarily for publicly traded companies. From December 2007 to September
2010, Ms. Tomyn was Vice President, Finance and Chief Financial Officer with Aduro Resources Ltd. From
October 2004 to October 2007, Ms. Tomyn was Vice President, Finance and Chief Financial Officer with
Diamond Tree Energy Ltd., including its predecessor company. Ms. Tomyn has also served as Vice President,
Finance and Chief Financial Officer of Ranchgate Energy Inc. (an oil and gas company), Saddle Resources Inc.
(an oil and gas company) and WestPoint Energy Inc. (an oil and gas company). Ms. Tomyn graduated from the
University of Saskatchewan with a Bachelor of Commerce degree in 1987 and is a member of the Institute of
the Chartered Professional Accountants (Alberta).
25Management Cont.
Glen Glass, Vice President, Operations, Canada
Mr. Glass is currently the Vice President, Operations, Canada for Eagle Energy Inc. Prior to that he spent 12
years as Vice President Operations for Coda Petroleum Inc., Rondo Petroleum Inc. and Grand Petroleum
Inc. Mr. Glass has over 38 years of engineering and operational experience in the petroleum industry. He
began his oil and gas career with Suncor Energy in 1979 where he worked in various roles with increasing
responsibility until 1994. For the last 23 years, he has held a variety of positions with 6 junior oil and gas
companies including Paragon Petroleum Corporation, Northrock Resources Ltd. and Grey Wolf Exploration. He
is experienced in drilling & completions, production operations, facility design and the management of
construction operations. Mr. Glass received his Bachelor of Science in Mechanical Engineering from the
University of Saskatchewan and is currently registered as a Professional Engineer with the Association of
Professional Engineers and Geoscientists of Alberta.
Jo‐Anne Bund, B.A., LLB, General Counsel and Corporate Secretary
Ms. Bund has over 20 years of experience as a corporate securities lawyer. Ms. Bund has practiced in the areas
of corporate finance, securities, and mergers and acquisitions, primarily for clients who were public oil and gas
companies. Ms. Bund has served as senior legal counsel with the Alberta Securities Commission for three
years and as in‐house/general counsel for ten. Ms. Bund holds a Bachelor of Arts degree from the University
of Toronto and a Bachelor of Laws degree from the University of Calgary.
26Board of Directors
Richard Clark, B.A. (Econ), LLB, Executive Chairman
Over 27 years in the energy sector, including 19 years as a legal advisor to energy sector CEOs. Mr. Clark
specialized in corporate governance, finance, securities, mergers and acquisitions and venture capital and has
extensive experience in developing innovative financing structures, leading initial public offerings and other
debt and equity financings, completing multiple corporate mergers and asset transactions, and advising on U.S.
expansion initiatives in the energy sector. Mr. Clark’s board experience began in 1991 and since then he has
served on numerous boards predominantly in the oil and gas sector. Mr. Clark founded Eagle in 2010.
Warren Steckley, MBA, P.Eng., Lead Independent Director, Chair of Reserves and
Governance Committee and Chair of Compensation Committee
Over 38 years of oil and gas industry experience with technical, financial and investment expertise. An
engineer by profession, Mr. Steckley was formerly the President, Chief Operating Officer and a director of
Barnwell of Canada, Limited, an oil and gas company and wholly‐owned subsidiary of Barnwell Industries Inc., a
public company listed on the American Stock Exchange. Mr. Steckley has been a director of a number of private
companies and public oil and gas companies.
Bruce Gibson, CA, Chair of Audit Committee
Over 35 years of financial experience in the oil and gas industry. Mr. Gibson is a Chartered Accountant by
profession and was formerly the Chief Financial Officer of Shiningbank Energy Income Fund. Mr. Gibson has
been a director of other public oil and gas companies.
27Board of Directors
F. Wayne McWhorter, Director
Mr. McWhorter, a resident of Texas and former certified public accountant and County Judge in Harrison
County, Texas, brings over 40 years of experience in the oil and gas, banking, public accounting , and real estate
industries. Mr. McWhorter has served as Chief Executive Officer of MarTex Bancshares, Inc., Chairman and
Chief Executive Officer of First Service Bank of Gladewater, Texas, and Vice President of Finance and Accounting
of Carlile & Howell/Marshall Exploration Inc., a private company based in Texas engaged in oil and gas
exploration and production, well drilling and oil field services operations. Mr. McWhorter was also a partner in
the public accounting firm Fitts, Feille & McWhorter and a senior accountant with the accounting firm Arthur
Young (now Ernst & Young). Mr. McWhorter currently sits on the board of directors of Hemotek, LLC and is a
trustee of East Texas Baptist University. He obtained both a Bachelor of Science degree and a Masters in
Business Administration degree from Baylor University, Texas.
Wayne Wisniewski, P.E., President, Chief Executive Officer and Director
Mr. Wisniewski has over 30 years of experience in the oil and gas industry, starting as a drilling and completion
engineer, and holding various engineering and senior management positions in multiple companies. Prior to
joining Eagle US, Mr. Wisniewski spent the preceding 13 years with a major international energy company,
where he was responsible for production operations exceeding 100,000 boe/d. Mr. Wisniewski holds a Bachelor
of Petroleum Engineering from Texas &M University, where he earned the Harold J Vance Award for academic
achievement, and a Master of Business Administration from Southern Methodist University in Dallas, Texas. He
is a professional engineer registered in Texas and Oklahoma.
28Advisories
Advisory Regarding Forward Looking Statements:
This presentation includes statements that contain forward looking information (“forward‐looking statements”) in respect of Eagle Energy Inc.’s (“Eagle”)
expectations regarding its assets and future operations, including Eagle’s business strategy and plan, forecast estimates for Eagle’s 2017 capital budget, production
and operating costs, drilling opportunities, statements pertaining to production from the first well drilled by Eagle in North Texas continuing to perform at budgeted
levels, general and administrative expenses, funds flow from operations, 2017 year‐end net debt levels, commodity split, field netback, hedging, reserves, corporate
decline rate, LMR and IRR. These forward looking statements involve estimates and assumptions including those relating to timing to drill and bring wells on
production, production rates, operating and capital costs, marketability of crude oil, natural gas and natural gas liquids, future commodity prices, future currency
exchange rates, anticipated cash flow based on estimated production, size of reserves and reservoir performance, among other things. These estimates and
assumptions necessarily involve known and unknown risks, delays, challenges and other uncertainties inherent in the oil and gas industry including those relating to
geology, production, drilling, technology, operations, human error, mechanical failures, transportation, processing problems and poor reservoir performance, among
others things, as well as the business risks discussed in Eagle Energy Inc.’s annual information form (“AIF”) dated March 16, 2017 under the headings “Risk Factors”
and “Advisory‐Forward‐Looking Statements and Risk Factors”.
The forward‐looking statements included in this presentation should not be unduly relied upon. Actual results may differ from the forward‐looking information in this
presentation, and the difference may be material and adverse to Eagle and its shareholders. No assurance is given that Eagle’s expectations or assumptions will
prove to be correct. Accordingly, all such statements are qualified in their entirety by reference to, and are accompanied by, the information and factors discussed
throughout this presentation. These statements speak only as of the date of this presentation and may not be appropriate for other purposes. Eagle does not
undertake any obligation, except as required by applicable securities legislation to update publicly or to revise any of the included forward‐looking statements,
whether as a result of new information, future events or otherwise. Eagle’s AIF contains important detailed information about Eagle. Copies of the AIF may be
viewed at www.sedar.com and on Eagle’s website at www.eagleenergy.com .
Advisory Regarding Non‐IFRS Financial Measures:
Statements throughout this presentation make reference to the term “field netbacks”, which is a non‐IFRS financial measure that does not have any standardized
meaning prescribed by IFRS and therefore may not be comparable to similar measures presented by other issuers. Investors should be cautioned that this measure
should not be construed as an alternative to earnings (loss) calculated in accordance with IFRS. Management believes that this measure provides useful information
to investors and management since it reflects the quality of production and the level of profitability.
“Field netback” is calculated by subtracting royalties, operating expense and transportation and marketing expenses from revenues, which are from Eagle’s
Consolidated Statement of Earnings (Loss) and Comprehensive Earnings (Loss).
29Advisories (continued)
Advisory Regarding Oil and Gas Measures and Estimates:
Barrel of Oil Equivalency
This presentation contains disclosure expressed as barrel of oil equivalency (“boe”) or boe per day (“boe/d”). All oil and natural gas equivalency volumes have been
derived using the conversion ratio of 6Mcf of natural gas: 1 bbl of oil. Equivalency measures may be misleading, particularly if used in isolation. A conversion ratio of
6 Mcf: 1 bbl is based on an energy equivalency conversion method primarily applicable at the burner tip and does not represent a value equivalency at the wellhead.
In addition, given that the value ratio based on the current price of oil as compared to natural gas is significantly different from the energy equivalent of six to one,
utilizing a boe conversion ratio of 6 Mcf: 1 bbl would be misleading as an indication of value.
Reserves’ Future Net Revenue Values
The estimated future net revenue value of the reserves disclosed in this presentation do not represent the market value of such reserves. There is no assurance that
such price and cost assumptions will be attained and variances could be material. The recovery and estimates of reserves provided in this presentation are estimates
only and there is no guarantee that the estimated reserves will be recovered. Actual reserves may be greater than or less than the estimates provided.
Oil and Gas Metrics
This presentation makes reference to the following oil and gas metrics: “reserve life index”, “capital efficiency", “reserve replacement ratio”, “IRR”, and "finding,
development and acquisition costs" ("FD&A costs"). These metrics have been prepared by management and may not be comparable to similarly‐named metrics used
by others because such metrics do not have standard calculations. Management uses these metrics to measure the success of replacing reserves and to compare
operating performance to previous periods on a comparable basis. The calculation of reserve life index, reserve replacement ratio and FD&A costs can be found
under “Reserves Performance Ratios” in Eagle’s 2016 Management’s Discussion and Analysis for the year ended December 31, 2016. Capital efficiency is a measure
that management uses to measure the cost to add an incremental barrel of flowing production in units of $/boe per day. Specifically, for the average capital
efficiencies of our plays, we use the total actual/projected capital to drill, complete and tie‐in new wells and workover existing wells divided by the average twelve
month production rate (or average increased production rate for twelve months in the case of worked‐over wells). IRR is a measure that management uses to
calculate the rate of return on wells. It is based on management’s current estimate of the average capital for the well and the average production forecasts per
Eagle’s reserve reports.
30Advisories (continued)
Advisory Regarding Oil and Gas Measures and Estimates (continued)
Discovered Oil Initially‐in‐Place
This presentation contains references to estimates of oil classified as Discovered Oil Initially‐In‐Place (“DOIIP”) which are not, and should not be confused with, oil
reserves. DOIIP is defined in the Canadian Oil and Gas Evaluation Handbook (“COGEH”) as the quantity of oil that is estimated to be in place within a known
accumulation prior to production. DOIIP is divided into recoverable and unrecoverable portions, with the estimated future recoverable portion classified as
“reserves” and “contingent resources” and the remainder classified as at the evaluation date as “unrecoverable”. The accuracy of resource estimates is, in part, a
function of the quality and quantity of available data and of engineering and geological interpretation and judgment. The size of the resource estimate could be
positively impacted, potentially in a material amount, if additional delineation wells determine that the aerial extent, reservoir quality and/or the thickness of the
reservoir is larger than what is currently estimated based on the interpretation of seismic and well control. The size of the resource estimate could be negatively
impacted, potentially in a material amount if additional delineation wells determine that the aerial extent, reservoir quality and/or the thickness of the reservoir are
less than what is currently estimated based on the interpretation of the seismic and well control.
Estimates of DOIIP described in this presentation are estimates only; the actual resources may be higher or lower than those calculated in the independent
evaluation. There is no certainty that it will be economically viable to produce any portion of the resources.
The estimates of DOIIP have been prepared by McDaniel & Associates Consultants Ltd. in accordance with NI 51‐101 and the COGEH and are effective as of January
1, 2017. The estimates of Reserves presented in this presentation have been prepared by McDaniel & Associates Consultants Ltd. for Eagle’s Canadian properties and
Netherland, Sewell & Associates, Inc. for Eagle’s U.S. properties, Eagle’s independent qualified reserves evaluators.
31You can also read