Strategic Combination: Eclipse Resources and Blue Ridge Mountain Resources - Transformative Transaction in the Appalachian Basin
←
→
Page content transcription
If your browser does not render page correctly, please read the page content below
Strategic Combination: Eclipse Resources
         and Blue Ridge Mountain Resources
           Transformative Transaction in the Appalachian Basin

August xx, 2018

                                                                 August 2018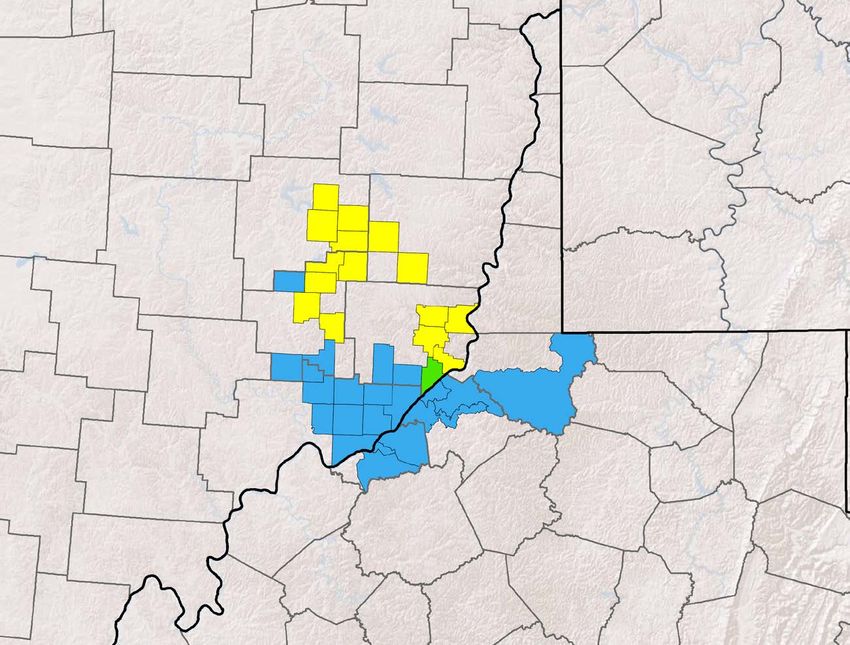
Forward-Looking Statements, Cautionary Statements,
and Other Disclosures
No Offer or Solicitation

This communication relates to a proposed business combination transaction (the “Transaction”) between the Company and Blue Ridge. This communication is for informational purposes only and does not constitute an offer to sell or the solicitation of an offer to buy any securities or a
solicitation of any vote or approval, in any jurisdiction, pursuant to the Transaction or otherwise, nor shall there be any sale, issuance, exchange or transfer of the securities referred to in this document in any jurisdiction in contravention of applicable law. No offer of securities shall be made
except by means of a prospectus meeting the requirements of Section 10 of the Securities Act of 1933, as amended.

Additional Information and Where to Find It

In connection with the Transaction, the Company will file with the SEC a registration statement on Form S-4 that will include a consent solicitation statement of Blue Ridge and an information statement of the Company and that also constitutes a prospectus of the Company. The Company may
also file other documents with the SEC regarding the Transaction. The definitive consent solicitation statement/information statement/prospectus will be sent to the stockholders of the Company and Blue Ridge. This document is not a substitute for the registration statement and consent
solicitation statement/information statement/prospectus that will be filed with the SEC or any other documents that the Company may file with the SEC or that the Company or Blue Ridge may send to stockholders of the Company or Blue Ridge in connection with the Transaction. INVESTORS
AND SECURITY HOLDERS OF THE COMPANY AND BLUE RIDGE ARE URGED TO READ THE REGISTRATION STATEMENT, THE CONSENT SOLICITATION STATEMENT/INFORMATION STATEMENT/PROSPECTUS AND ALL OTHER RELEVANT DOCUMENTS THAT ARE FILED
OR WILL BE FILED WITH THE SEC, AS WELL AS ANY AMENDMENTS OR SUPPLEMENTS TO THESE DOCUMENTS, CAREFULLY AND IN THEIR ENTIRETY BECAUSE THEY CONTAIN OR WILL CONTAIN IMPORTANT INFORMATION ABOUT THE TRANSACTION AND RELATED
MATTERS.

Investors and security holders will be able to obtain free copies of the registration statement and the consent solicitation statement/information statement/prospectus (when available) and all other documents filed or that will be filed with the SEC by the Company through the website maintained
by the SEC at www.sec.gov. Copies of documents filed with the SEC by the Company will be made available free of charge on the Company’s website at www.eclipseresources.com or by contacting the Company’s Investor Relations Department by phone at 814-325-2059.

Participants in Solicitation

The Company, Blue Ridge and certain of their respective directors, executive officers and members of management and employees may be deemed to be participants in the solicitation of consents from the holders of Blue Ridge’s common stock in respect to the Transaction.

Information regarding the Company’s directors and executive officers is contained in the Company’s Annual Reports on Form 10-K, Quarterly Reports on Form 10-Q and Current Reports on Form 8-K. Information regarding Blue Ridge’s directors and executive officers will be contained in the
consent solicitation statement/information statement/prospectus and other relevant materials filed with the SEC. You can obtain a free copy of these documents at the SEC’s website at www.sec.gov or by accessing the Company’s website at www.eclipseresources.com.

Investors may obtain additional information regarding the interests of those persons who may be deemed participants in the Transaction by reading the consent solicitation statement/information statement/prospectus and other relevant documents filed with the SEC regarding the Transaction
when they become available. You may obtain free copies of these documents as described above.

Forward-Looking Statements and Cautionary Statements

The foregoing contains “forward-looking statements” within the meaning of Section 27A of the Securities Act and Section 21E of the Securities Exchange Act of 1934, as amended. All statements, other than statements of historical fact, included in this communication that address activities,
events or developments that the Company or Blue Ridge expects, believes or anticipates will or may occur in the future are forward-looking statements. Words such as “estimate,” “project,” “predict,” “believe,” “expect,” “anticipate,” “potential,” “create,” “intend,” “could,” “may,” “foresee,” “plan,”
“will,” “guidance,” “look,” “outlook,” “goal,” “future,” “assume,” “forecast,” “build,” “focus,” “work,” “continue” or the negative of such terms or other variations thereof and words and terms of similar substance used in connection with any discussion of future plans, actions, or events identify
forward-looking statements. However, the absence of these words does not mean that the statements are not forward-looking. These forward-looking statements include, but are not limited to, statements regarding the Transaction, pro forma descriptions of the combined company and its
operations, integration and transition plans, synergies, opportunities and anticipated future performance. There are a number of risks and uncertainties that could cause actual results to differ materially from the forward-looking statements included in this communication. These include the
expected timing and likelihood of completion of the Transaction, including the timing, receipt and terms and conditions of any required governmental and regulatory approvals of the Transaction that could reduce anticipated benefits or cause the parties to abandon the Transaction, the ability to
successfully integrate the businesses, the occurrence of any event, change or other circumstances that could give rise to the termination of the Merger Agreement, the possibility that stockholders of Blue Ridge may not approve the adoption of the Merger Agreement, the risk that the parties
may not be able to satisfy the conditions to the Transaction in a timely manner or at all, risks related to disruption of management time from ongoing business operations due to the Transaction, the risk that any announcements relating to the Transaction could have adverse effects on the
market price of the Company’s common stock, the risk that the Transaction and its announcement could have an adverse effect on the ability of the Company and Blue Ridge to retain customers and retain and hire key personnel and maintain relationships with their suppliers and customers
and on their operating results and businesses generally, the risk that problems may arise in successfully integrating the businesses of the companies, which may result in the combined company not operating as effectively and efficiently as expected, the risk that the combined company may
be unable to achieve synergies or it may take longer than expected to achieve those synergies and other important factors that could cause actual results to differ materially from those projected. All such factors are difficult to predict and are beyond the Company’s or Blue Ridge’s control,
including those factors and risks detailed in the Company’s Annual Reports on Form 10-K, Quarterly Reports on Form 10-Q and Current Reports on Form 8-K that are available on its website at www.eclipseresources.com and on the SEC’s website at www.sec.gov. All forward-looking
statements are based on assumptions that the Company or Blue Ridge believe to be reasonable but that may not prove to be accurate. Any forward-looking statement speaks only as of the date on which such statement is made, and the Company and Blue Ridge undertake no obligation to
correct or update any forward-looking statement, whether as a result of new information, future events or otherwise, except as required by applicable law. Readers are cautioned not to place undue reliance on these forward-looking statements that speak only as of the date hereof.

Cautionary Note Regarding Hydrocarbon Quantities

The SEC permits oil and gas companies to disclose in their filings with the SEC only proved, probable and possible reserve estimates. Eclipse has provided proved reserve estimates that were independently engineered by Netherland Sewell & Associates, Inc. Unless otherwise noted, proved
reserves are as of December 31, 2017. Actual quantities that may be ultimately recovered from Eclipse’s interests may differ substantially from the estimates in this presentation. The Company may use the terms “resource potential,” “EUR,” “upside potential” and similar phrases to describe
estimates of potentially recoverable hydrocarbons that the SEC rules prohibit from being included in filings with the SEC. These are based on analogy to the Company’s existing models applied to additional acres, additional zones and tighter spacing and are the Company’s internal estimates of
hydrocarbon quantities that may be potentially discovered through exploratory drilling or recovered with additional drilling or recovery techniques. These quantities may not constitute “reserves” within the meaning of the Society of Petroleum Engineer’s Petroleum Resource Management
System or SEC rules. EUR estimates, resource potential and identified drilling locations have not been fully risked by Company management and are inherently more speculative than proved reserves estimates. Actual locations drilled and quantities that may be ultimately recovered from the
Company’s interests could differ substantially. There is no commitment by the Company to drill all of the drilling locations, which have been attributed to these quantities.

Factors affecting ultimate recovery include the scope of the Company’s ongoing drilling program, which will be directly affected by the availability of capital, drilling and production costs, availability of drilling services and equipment, drilling results, lease expirations, transportation constraints,
regulatory approvals, actual drilling results, including geological and mechanical factors affecting recovery rates, and other factors. Resource potential and EUR may change significantly as development of the Company’s oil and natural gas assets provide additional data. The Company’s
production forecasts and expectations for future periods are dependent upon many assumptions, including estimates of production decline rates from existing wells and the undertaking and outcome of future drilling activity, which may be affected by significant commodity price declines or
drilling cost increases.

The type curve areas included in this presentation are based upon our analysis of available Utica Shale well data, including, but not limited to, information regarding initial production rates, Btu content, natural gas yields and condensate yields, all of which may change over time. As a result, the
well data with respect to the type curve areas presented herein may not be indicative of the actual hydrocarbon composition for the type curve areas, and the performance, Btu content and natural gas and/or condensate yields of our wells may be substantially less than we anticipate or
substantially less than performance and yields of other operators in our area of operation.

Cautionary Note Regarding Non-GAAP Financial Measure

This presentation includes financial measures that are not in accordance with generally accepted accounting principles (“GAAP”), including Adjusted EBITDAX. While management believes such measures are useful for investors, they should not be used as a replacement for financial
measures that are in accordance with GAAP. For a reconciliation of Adjusted EBITDAX to the nearest comparable measure in accordance with GAAP, please see the Appendix of this presentation.

                                                                                                                                                                                                                                                                                                                    2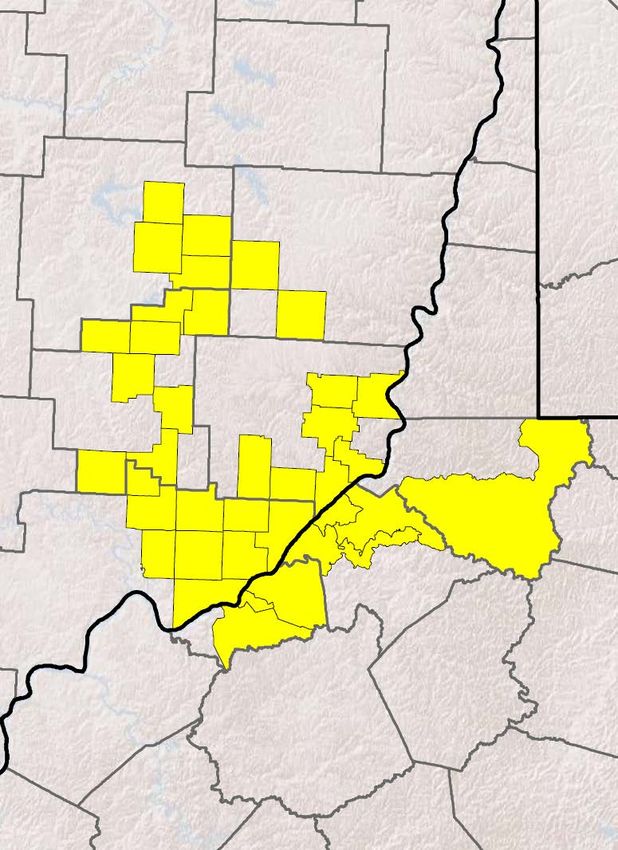
Transaction Summary
100% stock combination of Eclipse Resources (“Eclipse”) and Blue Ridge Mountain Resources (“Blue
Ridge” or “BRMR”)
Transaction ~230 million shares to be issued to Blue Ridge shareholders (~540 million total shares)
Terms 15-to-1 reverse stock split at close
Post-stock split pro forma shares of ~36 million
Pro forma equity value of $908 million and enterprise value of $1,426 million as of August 24, 2018
4.4259 Exchange Ratio
Eclipse: 57.5%, Blue Ridge: 42.5%
Pro Forma Blue Ridge CEO John Reinhart will become President & CEO of the combined company
Ownership &
Governance 10 Board members
5 named by Eclipse
5 named by Blue Ridge, including John Reinhart
Unanimously approved by board of directors of Eclipse and Blue Ridge and approved by Eclipse
shareholders
Approvals & Subject to Blue Ridge shareholder approval
Closing Voting agreement in place from 60% of Blue Ridge shareholders
Subject to customary regulatory approvals and other customary closing conditions
Expected closing in Q4 2018
3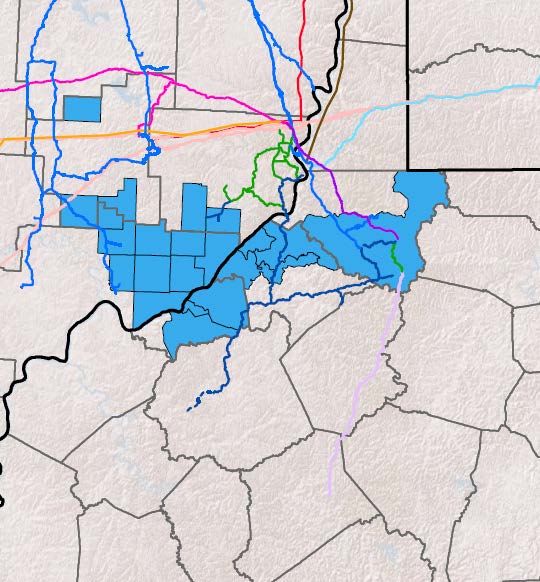
Transaction Rationale
Improved balance sheet & liquidity drives increased Materially expands operating footprint
production growth at low leverage levels
Significant operating & corporate level synergies
Significant operating & corporate level synergies
Enhances optionality for future consolidation and
Furthers ability to optimize netbacks, as well as growth
midstream & marketing commitments
Diversifies asset portfolio to include Flat Castle
Increases inventory of core Utica locations and North Central PA development opportunities
adds substantial Marcellus development
opportunity Improves stock market trading liquidity
Substantial increase to public float and anticipated Scale and growth provide pathway to free cash flow
improvement in stock market liquidity and additional value to shareholders1
Scale and growth provide pathway to free cash flow
and additional value to shareholders1
1. Free cash flow defined as EBITDAX less CAPEX.
4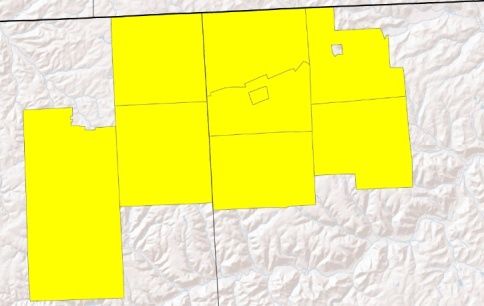
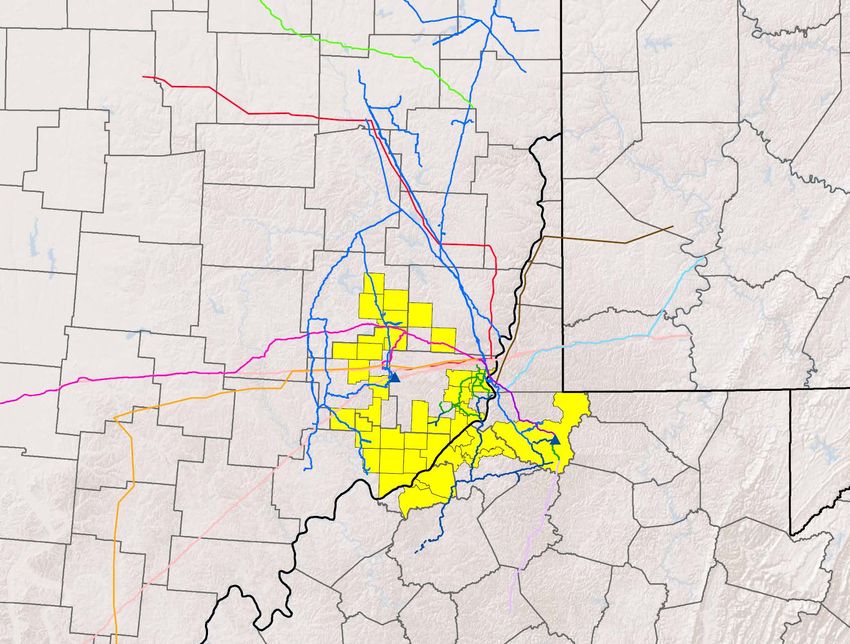
Top Tier Appalachian Energy Company
Attractive Scale and Asset Base Pro Forma Acreage Footprint6
~227,000 net effective undeveloped core acres across Utica and
Marcellus footprint1 Flat Castle (PA)
Liquids rich / dry gas optionality in core footprint with added Harrison
“stacked pay” development opportunities Potter
Pro forma production: Q2 2018 of 427 MMcfe/d and Q4 2018
expected production of 500-560 MMcfe/d Guernsey Belmont
Disciplined, Sector Leading Growth OH Tioga
Self-funded 2-3 rig business plan focused in low risk, high quality PA
core acreage with proximity to midstream Greene
Monroe Marshall
Targets attractive 20%+ per year production growth Noble
Wetzel Monongalia
Capital allocation ~85-90% focused on growth oriented D&C
activities
Balanced midstream / marketing portfolio provides optionality and Marion
improves netbacks
Washington
Synergies provide competitive per unit operating costs and Tyler
approximately $15 million in annual G&A savings
Harrison
Doddridge
Strong Balance Sheet and Liquidity Wood
Ritchie WV Eclipse
Pro forma leverage ratio of ~2.1x2, line of sight to 1.5-1.7x in Q4 20183
BRMR
Substantial pro forma liquidity estimated at $312 million4 Wirt
Positive cash flow generating anticipated by 20205 Gilmer Both
Substantial upside from further delineation
Positioned for accretive acquisitions to add scale and cash flow
1. Acreage as of Q2 2018.
2. Based on pro forma debt to Last Quarter Annualized (“LQA”) EBITDAX as of Q2 2018.
3. Estimated Last Quarter Annualized (“LQA”) EBITDAX for Q4 2018. Based on combined company initial estimates at current strip pricing.
4. Based on initial estimated combined corporate borrowing base of $375 MM, subject to bank approval and syndication process. Net of outstanding letters of credit.
5. Based on combined company initial estimates at current strip pricing subject to revision upon closing; free cash flow neutrality defined as EBITDAX less CAPEX.
6. Shading represents townships with more than 2,000 gross acres.
5Merger Creates a Solid Company of Scale
Strategic combination accelerates achievement of cash flow neutrality to 20201
Pro Forma
Net Effective Undeveloped Core Acres2 128,000 99,000 227,000
% HBP 54% 81% 66%
Net Remaining Locations 379 356 7353
Q2 2018 Production (MMcfe/d) 306 122 427
% Natural Gas 72% 81% 74%
YE 2017 Proved Reserves (Bcfe)4 1,459 357 1,816
Net Debt ($ million) $558 ($40) $519
Q2 2018 EBITDAX ($ million) $51 $18 $69
Unit Cash Production Costs ($ / Mcfe)5 $1.47 $1.42 $1.46
Leverage Ratio6 2.8x 0.3x 2.1x
1. Based on combined company initial estimates subject to revision. Free cash flow neutrality defined as EBITDAX less CAPEX.
2. Acreage as of Q2 2018.
3. Net locations based on type curve lateral lengths and Utica Dry Gas, Utica Dry Gas South and Utica Rich Gas based on 1,000' well spacing, Utica Condensate and Marcellus based on 750' well spacing and Flat
Castle based on 1,200' well spacing. 10% risked factor is utilized. Acreage as of Q2 2018.
4. Eclipse proved reserves based on YE2017 audited reserve report. BRMR proved reserves based on YE2017 audited reserve report adjusted for sold properties and include OH and WV assets only.
5.
6.
As of Q2 2018. Includes lease operating, transportation, gathering, processing, and compression and ad valorem taxes.
Based on Last Quarter Annualized (“LQA”) EBITDAX as of Q2 2018 (non-GAAP financial measure, see appendix for details).
6Pro Forma Asset Portfolio
Combined company has 735 net locations, an 94% increase for Eclipse and a 106% increase
for BRMR
Flat Castle (PA)
Pro Forma Single Well IRR1 Core Acreage5
Utica Type Curve Outlines Potter Tioga
187
79% Harrison Belmont
Marcellus Type Curve Outlines
Pro Forma Net Locations
71%
68% Utica Rich
Gas
126 125 Guernsey
50%108 52%
49%
39% 85
OH Belmont
74 Utica Dry
Gas
30 Marshall
PA
Green
Monroe
Noble
Utica Utica Rich Utica Dry Utica Dry Marcellus Marcellus Flat Castle 2
Condensate Gas Gas Gas South Condensate Retro West
Wetzel
Utica Utica Rich Utica Dry Utica Dry Marcellus Marcellus
Type Curve Flat Castle Total
Condensate Gas Gas Gas South Condensate Retro West
Tyler
Eclipse Lateral Length 13,000 13,000 13,000 - 12,000 - 16,000 -
Washington
Eclipse Net Undeveloped Core Acres3 25,800 6,800 38,000 - 14,100 - 43,300 128,000
Marcellus
Eclipse Net Locations4 102 20 112 - 60 - 85 379 Pleasants
Condensate
Harrison
BRMR Lateral Length 13,000 13,000 13,000 13,000 12,000 12,000 - - Doddridge
Wood
BRMR Net Undeveloped Acres3 21,600 3,300 4,850 36,500 3,250 29,500 - 99,000
Marcellus
BRMR Net Locations4 85 10 14 108 14 125 - 356 Retro West
Wirt Ritchie
Pro Forma Net Undeveloped Core Acres 47,400 10,100 42,850 36,500 17,350 29,500 43,300 227,000
Lewis
Utica Utica Dry Gas
Pro Forma Net Locations 187 30 126 108 74 125 85 735
Condensate South Gilmer
WV
1. BTIRRs assume $3.00/MMBtu gas, $60.00/Bbl oil and 40% WTI NGL pricing, based on management estimates.
2. Flat Castle base case assumed.
3. Acreage as of Q2 2018.
4. Net locations based on type curve lateral lengths and Utica Dry Gas, Utica Dry Gas South and Utica Rich Gas based on 1,000' well spacing, Utica Condensate and Marcellus based on 750' well spacing and Flat
Castle based on 1,200' well spacing. 10% risked factor is utilized. Acreage as of Q2 2018.
5. Shading represents townships with more than 2,000 gross acres.
7Experienced Appalachian Basin Leadership Team
Experience
Prior Companies
(years)
John Reinhart
25
President & CEO
Oleg Tolmachev 19
EVP & COO
Matthew DeNezza
18
EVP & CFO (interim)
Paul Johnston
38
EVP & General Counsel
Matthew Rucker
SVP, Resource Development 11
& Planning
8Strong Financial Positioning
Balance Sheet and Liquidity Pro Forma Capitalization (6/30/18)
$ in millions
Blue Ridge $25 million term loan to be retired at transaction
Capitalization Pro Forma
close
Cash & Cash Equivalents2 $52
Pro forma borrowing base expected to be $375 million1
Revolving Credit Facility $60
ECR senior unsecured notes to remain outstanding
8.875% Senior Unsecured Notes Due 2023 511
No near term debt maturities Total Debt $571
ECR does not intend to proceed with third tranche of its Market Value of Equity4 $908
current Drilling JV assuming close of merger Enterprise Value4 $1,426
Debt / LQA EBITDAX Peer Benchmarking3 Credit Statistics
Total Debt / LQA EBITDAX5 2.1x
4.5x
Total Debt / YE 2017 Proved Reserves ($ / Mcf)6 $0.31
3.6x Total Debt / Q2 2018 Production ($ / MMcfe/d) $1,337
3.3x
2.8x
2.6x 2.5x Liquidity
2.1x 2.1x
Borrowing Base1 $375
Plus: Cash2 52
Less: Borrowings (60)
Less: Letters of Credit (55)
Peer 1 Peer 2 Peer 3 Peer 4 Peer 5 Peer 6 Peer 7 Pro Liquidity $312
Forma
1. Based on initial estimated combined corporate borrowing base of $375 MM, subject to bank approval and syndication process. Net of outstanding letters of credit.
2. Pro forma cash balance assumes $25mm of BRMR term loan is paid down at transaction close.
3. Peers include AR, CHK, CNX, EQT, GPOR, RRC and SWN. From public filings and press releases. Last Quarter Annualized (“LQA”) EBITDAX as of 2Q 2018 (non-GAAP financial measure, see appendix for details).
4. As of August 24, 2018.
5. Based on Last Quarter Annualized (“LQA”) EBITDAX as of Q2 2018 (non-GAAP financial measure, see appendix for details).
6. Eclipse proved reserves based on YE2017 audited reserve report. BRMR proved reserves based on YE2017 audited reserve report adjusted for sold properties and include OH and WV assets only. 9Midstream and Marketing Portfolio Allowing for
Operational Synergies
Midstream & Marketing Portfolio Combined Marketing Overview
Core Acreage1 Contiguous acreage position facilitates
Wayne Stark ET Rover Pipeline
Blue Racer Pipeline midstream efficiencies
Sunoco Mariner East Pipeline
TETCO Pipeline Limited minimum volume commitments for
Holmes Dominion Transmission Pipeline
TCO Pipeline gathering and processing covered by pro
Rockies Express Pipeline
OH Tuscarawas
Equitrans (EQT) forma production
Nexus
Coshocton Leach XPress Allows combined entity to leverage acreage
Harrison Midstream Facilities
Eureka Hunter Pipeline – Proposed position to improve costs
Eureka Hunter Pipeline – Wet Gas
Belmont
Guernsey Eureka Hunter Pipeline – Dry Gas
Manageable firm transportation commitments
Muskingum
Natrium
PA with multiple points of access to numerous
Noble
Marshall Greene marketing hubs
Berne Monroe
Perry Wetzel Monongalia
Firm capacity held by BRMR provides access to
Morgan
Mobley
premium Midwest markets with attractive pricing
Washington Tyler Marion
Athens
Taylor
Harrison
Doddridge
Wood Ritchie WV Barbour
Meigs
Wirt Lewis
Calhoun
1. Shading represents townships with more than 2,000 gross acres.
10Provides the Basis for a Growth-Oriented Strategy
Development Strategy Production Growth (MMcfe/d)2
1,200
2 to 3 rig development program concentrated on highest
returning, low risk, Marcellus and Utica core acreage 1,000
Targeting 20% annual production growth and positive 2020 800
cash flow1
600
Proven, low risk, high deliverability program
400
Enhanced cycle times and optimized well pad capital 2018 2019 2020 2021
spend
Attractive pad-level and program return on investment
Delivers attractive growth, optimizes predictable well EBITDAX Growth ($ million)2
returns, and maintains balance sheet strength
$800
Continue delineating Southeast OH Marcellus, North
Central PA Utica and WV Utica to enhance shareholder $600
value.
$400
Land strategy discipline that further consolidates and
extends / renews high value core acreage that is scheduled $200
for near-term development
$0
2018 2019 2020 2021
1. Positive free cash flow defined as EBITDAX less CAPEX greater than zero.
2. Assumes range of growth rate beginning with Q2 2018 production and Q2 annualized EBITDAX (non-GAAP financial measure, see appendix for details).
11Compelling Appalachia Story
Combined Highly experienced team with a history of success in Appalachia
Management
Team 111 years of combined Oil and Gas Experience
Highly Ability to high grade development plan
Complementary
Asset Fit Maximize efficiency and cash generation
Healthy Balance Credit accretive transaction supports improved growth profile at low leverage levels
Sheet Strong liquidity position
Optimized Incremental access to new markets
Midstream
Solution Flexibility for future growth and contract negotiation
Accelerates cash flow neutrality – expected by 20201
Additional
Ability to generate attractive growth through the drillbit while “living within means”
Growth
Opportunities Creates a platform to assess and act upon inorganic growth opportunities across
the basin
1. Based on combined company initial estimates subject to revision. Free cash flow neutrality defined as EBITDAX less CAPEX.
12Appendices
Overview of Blue Ridge
High
Strong asset baseQuality Asset Base Asset Overview
~99,000 net effective undeveloped core acres in
Ohio and West Virginia1 Guernsey
OH Belmont
PA
357 Bcfe of YE 2017 proved reserves (22% liquids)2
Marshall
~4,888 Bcfe of total resource potential1
Greene
Natrium
Active
Disciplined, Development
sector leading, growthProgram
Noble
Monroe
Wetzel Monongalia
1-2 operated rigs running
Mobley
Q2 2018 daily production of 122 MMcfe/d (19% liquids)
Marion
Tyler
Washington
Strong Financial Position Doddridge Harrison
BRMR Core Acreage4
Strong balance sheet with minimal debt Wood
BRMR Rig
obligations WV ET Rover Pipeline
Blue Racer Pipeline
Sunoco Mariner East Pipeline
Q2 2018 net cash position of $40 million3 Ritchie TETCO Pipeline
Dominion Transmission Pipeline
Wirt TCO Pipeline
Rockies Express Pipeline
Balanced Midstream & Marketing Gilmer Equitrans (EQT)
Leach XPress
Jackson Calhoun Midstream Facilities
Infrastructure and/or agreements in place to Eureka Hunter Pipeline – Proposed
Roane Eureka Hunter Pipeline – Wet Gas
support future development Eureka Hunter Pipeline – Dry Gas
1. As of Q2 2018.
2. Proved reserves based on YE2017 audited reserve report adjusted for sold properties and include OH and WV assets only.
3. Pro forma cash balance assumes $25mm of BRMR term loan is paid down at transaction close.
4. Shading represents townships with more than 2,000 gross acres.
14Risk Management: Pro Forma Hedging
Pro forma hedging portfolio is ~77% hedged for natural gas and ~67% hedged for condensate production in
2018 and will continue adding incremental hedges in 2019 to further enhance cash flow stability
Summary of Pro Forma Hedges Natural Gas (MMBtu/d)
2018 Commodity Hedges $s indicate Average Floor Price
400,000
Approximately 77% of PF natural gas
production hedged(1) 350,000 $2.89
Average floor price of $2.93/MMBtu $2.90
300,000 $2.91
Average ceiling price of $3.25/MMBtu
$2.72
250,000 $3.00 $2.93 $2.71
201,000
Approximately 67% of oil production hedged(1) 156,500
200,000 160,000 $2.79
Average floor price of $46.78/Bbl 117,500 77,500
Average ceiling price of $54.22/Bbl 150,000 160,000
190,000 20,000 30,000 77,500
60,000
2019 Commodity Hedges 100,000 15,000 35,000
50,000 15,000 98,000 118,000 120,000
90,000 90,000 90,000
236,000 MMBtu/d of natural gas production 50,000
30,000
hedged -
Average floor price of $2.77/MMBtu Q1 2018 Q2 2018 Q3 2018 Q4 2018 Q1 2019 Q2 2019 Q3 2019 Q4 2019
Average ceiling price of $2.98/MMBtu
2,250 Bbl/d of oil production hedged
Average floor price of $51.22/Bbl
Average ceiling price of $60.61/Bbl
Oil (Bbl/d)
$s indicate Average Floor Price
Basis Hedges
7,000
Dom South exposure hedges
60,000 MMBtu/d of Jan 18 – Mar 18 at ($0.44) 6,000
12,500 MMBtu/d of Apr 19 – Oct 19 at ($0.52) $48.20 $48.20
12,500 MMBtu/d of Apr 20 – Oct 20 at ($0.52) 5,000
$45.00 $45.00
17,500 MMBtu/d of Jan 19 – Dec 19 at ($0.50)
4,000
NGL Hedges $53.67
3,000 4,000 4,000
$50.00 $50.00 $50.00
Propane exposure hedges 2,000 4,000 4,000 2,000
21,000 gal/d of Jan 18 – Dec 18 at $0.84
14,700 gal/d of Jul 18 – Dec 18 at $0.72 1,000 2,000 2,000 2,000
33,600 gal/d of Jan 19 – Mar 19 at $0.71 1,000 1,000 1,000
-
12,600 gal/d of Jun 18 – Mar 19 at $0.82 Q1 2018 Q2 2018 Q3 2018 Q4 2018 Q1 2019 Q2 2019 Q3 2019 Q4 2019
1. Hedge % based on midpoint of pro forma guidance.
15Non-GAAP Reconciliation
Eclipse Adjusted EBITDAX
Three Months Ended Six Months Ended
June 30, June 30,
$ thousands 2018 2017 2018 2017
Net income (loss) $ (19,036) $ 11,494 $ (21,660) $ 38,341
Depreciation, depletion and amortization 32,760 25,152 63,916 51,341
Exploration expense 9,620 8,997 24,898 20,577
Stock-based compensation 1,979 2,348 3,960 4,429
Accretion of asset retirement obligations 162 128 317 252
(Gain) loss on sale of assets (1,553) 6 (1,820) 1
(Gain) loss on derivative instruments 16,577 (18,177) 20,792 (43,274)
Net cash receipts (payments) on settled derivatives (2,488) (2,644) (2,347) (6,633)
Interest expense, net 13,092 12,285 26,043 24,747
Other (income) expense — — — 19
Adjusted EBITDAX $ 51,113 $ 39,589 $ 114,099 $ 89,800
BRMR Adjusted EBITDAX
Three Months Ended Six Months Ended
June 30, June 30,
$ thousands 2018 2017 2018 2017
Net income (loss) $ 2,378 $ (875) $ 273 $ (9,054)
Depletion, depreciation, and amortization 9,811 3,017 14,257 7,963
Exploration expense 1,876 3,020 4,812 15,404
Impairment of oil and gas properties 330 - 330 6
Impairment of other assets 673 - 673 -
Stock-based compensation 592 672 1,055 1,354
Bad debt expense 4 (35) 216 476
(Gain) loss on sale of assets (3,653) 430 (4,289) (3,658)
(Gain) loss on derivative instruments 4,171 (2,687) 3,521 (5,902)
Interest expense, net 776 2,394 1,479 4,856
Tax expense (benefit) - (5,457) - (5,573)
Reorganization items 861 278 1,285 509
Other (income) expense (36) (587) (39) (2,015)
Adjusted EBITDAX $ 17,783 $ 170 $ 23,573 $ 4,366
16You can also read