BofAML Global Metals & Mining Conference May 14-16, 2019 - Yamana Gold Inc.
←
→
Page content transcription
If your browser does not render page correctly, please read the page content below
BofAML Global Metals & Mining Conference May 14-16, 2019
CAUTIONARY NOTE
REGARDING FORWARD-LOOKING STATEMENTS

CAUTIONARY NOTE REGARDING FORWARD-LOOKING STATEMENTS: This presentation contains or incorporates by reference “forward-looking statements” and “forward-looking information” under applicable
Canadian securities legislation within the meaning of the United States Private Securities Litigation Reform Act of 1995. Forward-looking information includes, but is not limited to the Chapada Sale Transaction
and anticipated timing of the closing of the Chapada Sale Transaction and the expected impact on the Company’s operations as a result of the Chapada Sale Transaction, the timing of the development of the
pyrite roaster, the dividend increases, the repayment of debt, leverage ratios, expected benefits of the integration agreement information with respect to the Company’s strategy, plans or future financial or
operating performance, continued advancements at Jacobina, Canadian Malartic, Cerro Moro, El Peñón, Minera Florida and Agua Rica, expected production and costs, future work and drilling programs,
anticipated timing for the pre-feasibility and feasibility studies for the Agua Rica / Alumbrera integrated project and the potential for future additions to mineral resources and mineral reserves. Forward-
looking statements are characterized by words such as “plan,” “expect”, “budget”, “target”, “project”, “intend”, “believe”, “anticipate”, “estimate” and other similar words, or statements that certain
events or conditions “may” or “will” occur. Forward-looking statements are based on the opinions, assumptions and estimates of management considered reasonable at the date the statements are made, and
are inherently subject to a variety of risks and uncertainties and other known and unknown factors that could cause actual events or results to differ materially from those projected in the forward-looking
statements. These factors include the receipt of certain regulatory approvals and consent in connection with the completion of the Sale Transaction, the satisfaction of closing conditions, the Company’s
expectations in connection with the production and exploration, development and expansion plans at the Company's projects discussed herein being met, the impact of proposed optimizations at the Company's
projects, changes in national and local government legislation, taxation, controls or regulations and/or changes in the administration or laws, policies and practices, and the impact of general business and
economic conditions, global liquidity and credit availability on the timing of cash flows and the values of assets and liabilities based on projected future conditions, fluctuating metal prices (such as gold,
copper, silver and zinc), currency exchange rates (such as the Brazilian real, the Chilean peso, and the Argentine peso versus the United States dollar), the impact of inflation, possible variations in ore grade or
recovery rates, changes in the Company’s hedging program, changes in accounting policies, changes in mineral resources and mineral reserves, risks related to asset disposition, risks related to metal purchase
agreements, risks related to acquisitions, changes in project parameters as plans continue to be refined, changes in project development, construction, production and commissioning time frames,
unanticipated costs and expenses, higher prices for fuel, steel, power, labour and other consumables contributing to higher costs and general risks of the mining industry, failure of plant, equipment or
processes to operate as anticipated, unexpected changes in mine life, final pricing for concentrate sales, unanticipated results of future studies, seasonality and unanticipated weather changes, costs and
timing of the development of new deposits, success of exploration activities, permitting timelines, government regulation and the risk of government expropriation or nationalization of mining operations, risks
related to relying on local advisors and consultants in foreign jurisdictions, environmental risks, unanticipated reclamation expenses, risks relating to joint venture operations, title disputes or claims,
limitations on insurance coverage and timing and possible outcome of pending and outstanding litigation and labour disputes, risks related to enforcing legal rights in foreign jurisdictions, as well as those risk
factors discussed or referred to herein and in the Company's Annual Information Form filed with the securities regulatory authorities in all provinces of Canada and available at www.sedar.com, and the
Company’s Annual Report on Form 40-F filed with the United States Securities and Exchange Commission. Although the Company has attempted to identify important factors that could cause actual actions,
events or results to differ materially from those described in forward-looking statements, there may be other factors that cause actions, events or results not to be anticipated, estimated or intended. There
can be no assurance that forward-looking statements will prove to be accurate, as actual results and future events could differ materially from those anticipated in such statements. The Company undertakes
no obligation to update forward-looking statements if circumstances or management’s estimates, assumptions or opinions should change, except as required by applicable law. The reader is cautioned not to
place undue reliance on forward-looking statements. The forward-looking information contained herein is presented for the purpose of assisting investors in understanding the Company’s expected financial and
operational performance and results as at and for the periods ended on the dates presented in the Company’s plans and objectives and may not be appropriate for other purposes.
The Company has included certain non-GAAP financial measures and additional line items or subtotals, which the Company believes that together with measures determined in accordance with IFRS, provide
investors with an improved ability to evaluate the underlying performance of the Company. Non-GAAP financial measures do not have any standardized meaning prescribed under IFRS, and therefore they may
not be comparable to similar measures employed by other companies. The data is intended to provide additional information and should not be considered in isolation or as a substitute for measures of
performance prepared in accordance with IFRS. The non-GAAP financial measures included in this presentation include: Free cash flow, net debt to EBITDA, co-product cash costs per ounce of gold and silver
produced, co-product cash costs per pound of copper produced, all-in sustaining co-product costs per ounce of gold and silver produced, all-in sustaining by-product costs per ounce of gold and silver produced
and all-in sustaining co-product costs per pound of copper produced. Please refer to section 11 of the Company’s current annual Management’s Discussion and Analysis, which is filed on SEDAR and includes a
detailed discussion of the usefulness of the non-GAAP measures. The Company believes that in addition to conventional measures prepared in accordance with IFRS, the Company and certain investors and
analysts use this information to evaluate the Company’s performance. In particular, management uses these measures for internal valuation for the period and to assist with planning and forecasting of future
operations.

Qualified Persons

Scientific and technical information contained in this presentation has been reviewed and approved by Sébastien Bernier (Senior Director, Geology and Mineral Resources). Sébastien Bernier is an employee of
Yamana Gold Inc. and a "Qualified Person" as defined by Canadian Securities Administrators' National Instrument 43-101 - Standards of Disclosure for Mineral Projects. Data verification related to certain
scientific and technical information disclosed herein in connection with Yamana’s material properties can be found in the Company’s Annual Information Form dated March 28, 2019, available under the
Company’s profile on SEDAR at www.sedar.com and on the Company’s website.
The information presented herein was approved by management of Yamana Gold on May 9, 2019.

All amounts are expressed in United States dollars unless otherwise indicated.

BofAML Global Metals & Mining Conference                                                                                                                                                                            2
DOMINANT INTERMEDIATE PRODUCER
PORTFOLIO FOR THE CURRENT AND NEXT CYCLE

                                                                                                            Production platform of 1 million gold-
   High Quality Portfolio with Long                                                                            equivalent ounces(1) and growing
             Life Assets
                                                                                                                                                                                     Canada

                                                                                                                                                                                   Canadian
       Track Record of Consistency                                                                                                                                                  Malartic

                                                                                                            23%                         15%

                                                                                                                                                     Brazil
     Diversified by Jurisdiction and                                                                                Revenue
                                                                                                                   by Country(2)
                                                                                                                                                     Canada
                                                                                                                                                     Chile
                  Metal                                                                                                                              Argentina
                                                                                                                                                                                               Brazil
                                                                                                           28%                             34%                                                 Jacobina

          Strong Balance Sheet and                                                                            15%
                                                                                                                                                                       El Peñón
                                                                                                                                                                                                Chapada

             Financial Flexibility                                                                                                                                Minera Florida
                                                                                                                      Revenue                       Gold
                                                                                                                                                                   Chile
                                                                                                                      by Metal(2)                   Silver                             Argentina
                                                                                                                                                                                     Cerro Moro

     Increased Shareholder Returns                                                                                                      85%

BofAML Global Metals & Mining Conference   1.   Gold equivalent ounces (“GEO”) include gold plus silver at a ratio of 82.5:1 for the 2019-2021 guidance period.                                           3
                                           2.   Estimated 2020 run rate for revenue contribution by metal and by country.
                                           3.   See Cautionary Note Regarding Forward Looking Information.
PATHWAY TO IMPROVEMENTS
MULTI-YEAR EFFORT, BENEFITS MATERIALIZING
Enhancements to Organizational Construct
Centralized senior management at head office.
Direct reporting from mine sites to senior management.
Process enhancements, including for life-of-mine planning and project execution.
Changes to the Board and Management
Board –added diversification, independence and expertise.
Management – improved bench strength and completed successional changes.
Portfolio Upgraded and Right-Sized
Core mines contributing more to overall performance, divested non-core
assets.
Canadian Malartic (50%) added as a long-life asset in Canada. Turnaround
strategy completed at Jacobina and El Peñón right sized.
Optimizing project development plans, including for Agua Rica.
Success on Project Delivery
Built Cerro Moro on time and on budget.
Exceeded guidance in its first year.
BofAML Global Metals & Mining Conference 4
CHAPADA SALE TRANSACTION
CONSIDERATION OF OVER $1 BILLION

      “Yamana has elected to sell the Chapada copper-gold mine for total
     consideration of over $1 billion, which fully values the asset including
                     the planned expansion opportunities.”

BofAML Global Metals & Mining Conference                                        5
PATHWAY TO IMPROVEMENTS
CHAPADA SALE TRANSACTION

                             Rebalanced Precious            Enhanced
                               Metals Portfolio        Shareholder Returns

                                            IMPROVED FINANCIAL
                                                FLEXIBILITY

                                                      Enhanced Outlook for
                                   Debt Reduction
                                                         Free Cash Flow

                 ROBUST BALANCE SHEET, HIGH QUALITY PORTFOLIO, INCREASED DIVIDEND

BofAML Global Metals & Mining Conference                                            6
PRECIOUS METALS PORTFOLIO
PRODUCTION AND OPERATING COSTS

                                                                        Planned Production Profile, GEO(1)

                                                                                              +15k oz
                                                            1.02M oz                     1.02M oz                                                                                Additionally, opportunities
                     1.0M oz         1.0M oz                                                                                                                                      at existing operations to
     892K oz                                                                                                                                                                    increase production by 150k
                                                                                                                                                                                     GEO(1)/year (+15%)

      2017A            2018A               2019E                  2020E                        2021E                                      Targeted Production

                                                                                                         Potential to add 15k oz at Jacobina

                                                                     Original 2019 Cost Guidance, $/GEO(1,2)

                                                                 1,060
                                                                                                                                                                                                       960
                                     1,028                       1,020
                                                                                                                                    680                              931                               920

                                                                                                   656                              640

                                           Cost of Sales                                               Cash Costs(3)                                                   AISC(3)

                                                                             2018 Results                                                    2019 Guidance

                                            1.   Gold equivalent ounces (“GEO”) include gold plus silver at a ratio of 79.6:1 and 82.5:1 for the full year 2018 and the 2019-2021 guidance period, respectively. Excluding the Gualcamayo mine which was sold in
                                                 2018, includes pre-commercial production of 8,625 gold ounces from Cerro Moro. Includes pre-commercial production of 333,878 silver ounces from Cerro Moro. See Cautionary Note Regarding Forward Looking
                                                 Information.
BofAML Global Metals & Mining Conference    2.   2018 Actuals have been adjusted to reflect the updated cost reporting methodology. Reconciliations for all non-GAAP financial measures are available at www.yamana.com/Q42018.                                    7
                                            3.   A non-GAAP measure, additional line item or subtotal. A reconciliation of the IFRS measure to the non-GAAP measure can be found at www.yamana.com/Q12019.
PRECIOUS METALS PORTFOLIO
JACOBINA (100%)
Year-on-year production records
Record production in 2018 of 144.7k GEO at
AISC(1) of $891/oz. Track Record of Production Increases
Momentum carried into 2019 with record
225
quarterly production in Q1 of 38.6k GEO.
170 to 165
Mineral reserves increased by 11% in 2018 with
gold grades trending higher. 145 145
136
GEO in 000’s
120
97
76
Strategic opportunities
Two-phase plan is being evaluated to increase
production over 150k oz/year. 2014 2015 2016 2017 2018 2019E Phase 1Phase 2
Phase 1 mill optimization to sustain 6,500 tpd
to deliver 165k to 170k GEO/year. Capex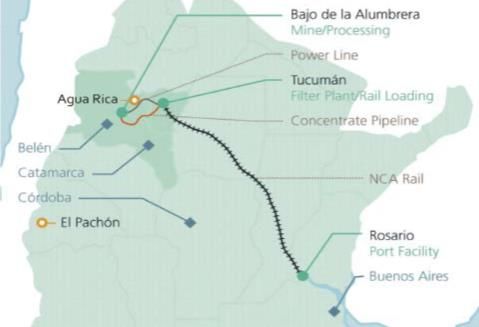
PRECIOUS METALS PORTFOLIO
CANADIAN MALARTIC (50%)
Track record of consistency
Record production in 2018 of 348.6k GEO at
AISC(1) of $732/oz.
Annual Increases to Production Opportunity for
Barnat extension project is in progress. First Since Acquisition (50% Basis)
Future
Contribution from
ore is expected in late 2019 with more Underground
meaningful contributions in 2020/21. 349 330 Production
317 325
Exploration programs are ongoing to evaluate 293 300
280 286 285
GEO in 000’s
several deposits to the east of Canadian
Malartic, including Odyssey, East Malartic,
Sladen, and Sheehan zones. 75
Strategic opportunities 2015 2016 2017 2018 2019E Target
East Malartic and Odyssey zones are being Guidance Results
evaluated as underground mining
opportunities.
Studies show the potential to increase
production by 75k GEO/year (50%).
SIGNIFICANT PRODUCTION AND CASH FLOWS
1. A non-GAAP measure, additional line item or subtotal. A reconciliation of the IFRS measure to the non-GAAP measure can be found at
BofAML Global Metals & Mining Conference www.yamana.com/Q12019. 9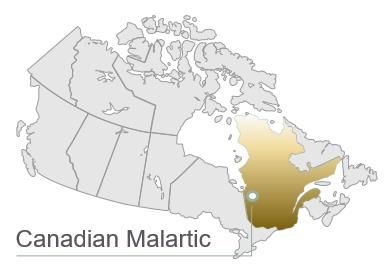
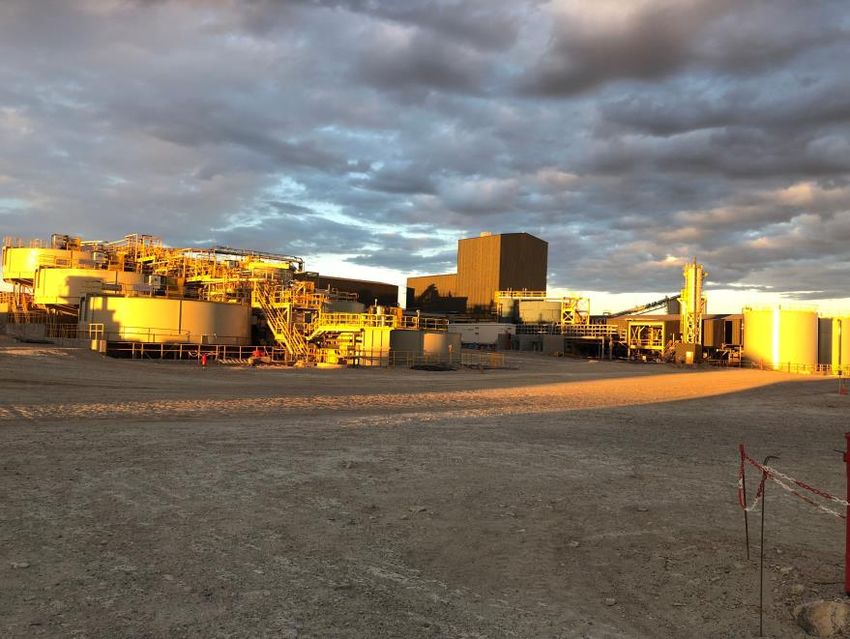
PRECIOUS METALS PORTFOLIO
CERRO MORO (100%)
Cerro Moro
On time and on budget development followed
by a successful ramp up in 2018.
Exceeded production guidance in its first year
with production of 92.8k oz of gold(3) and 4.1M
oz of silver(3) at AISC(1) of $848/GEO(2).
An aggressive drill program is planned for
2019. $15 million is earmarked to test major
structures with potential to host a significant
new mineralized zone.
Strategic opportunities(4)
Targeting increases to mineral reserve and
mineral resources.
Increases would unlock opportunities for
production growth through a plant expansion
and cost benefits from the transition to grid
power.
TARGETING THE ADDITION OF 1 MILLION GEO OF MINERAL RESOURCES OVER THE NEXT 3 YEARS(4)
1. A non-GAAP measure, additional line item or subtotal. A reconciliation of the IFRS measure to the non-GAAP measure can be found at www.yamana.com/Q42018.
2. Gold equivalent ounces (“GEO”) include gold plus silver at a ratio of 79.6:1 and 82.5:1 for 2018 and the forecast for 2019 guidance, respectively.
BofAML Global Metals & Mining Conference 3. Includes pre-commercial production at Cerro Moro of 8,625 gold ounces and 333,878 silver ounces. 10
4. See Cautionary Note Regarding Forward Looking Information.Debt Reduction
PRECIOUS METALS PORTFOLIO
EL PEÑÓN (100%) AND MINERA FLORIDA (100%)
El Peñón
In August 2018, El Peñón hit the 5 million ounces mark for
gold produced - a prolific geologic setting, which bodes
well for further mine life additions.
In 2018, mineral reserves increased 5% for gold and 6% for
silver, after depletion.
2019 production guidance of ~200k GEO(1).
Minera Florida
With the completion in 2018 of raise boring activity in the
new PVS and Pataguas zones development and mining rates
are expected to trend higher in these zones.
For 2019, the mine plans call for a 4% increase in
production and a 25% decline in AISC(1).
Strategic opportunities
Targeting further increases to mineral reserve and
resources.
FOCUS ON INCREASING MINERAL INVENTORY
1. Gold equivalent ounces (“GEO”) include gold plus silver at a ratio of 82.5:1 for 2019 guidance.
BofAML Global Metals & Mining Conference 11LONG LIFE MINES
EXPECTED UPSIDE FROM INCREASED EXPLORATION
2018 Year End Mineral Reserves and Mineral Resources(1) and 2019 Production Guidance
4,000 20,000
GEO (in 000's)
3,000 15,000
GEO (in 000's)
2,000 10,000
1,000 5,000
0 0
EL PEÑÓN CANADIAN JACOBINA CERRO MORO MINERA FLORIDA COMPANY WIDE
MALARTIC
Proven and Probable Mineral Reserves Inferred Mineral Resources(3)
Measured and Indicated Mineral Resources(2,3) 2019 GEO Guidance
1. As of December 31, 2018, further details including tonnes and grade are presented in the Company’s press release issued on February 14, 2019.
BofAML Global Metals & Mining Conference 2. Measured and Indicated mineral resources are exclusive of Proven and Probable mineral reserves. 12
3. Mineral resources that are not mineral reserves do not have demonstrated economic viability.LOOKING FORWARD
STRATEGIC ASSETS
Equity Interest in Leagold Mining
9,128
Gold Equivalent Ounces(1,2)
$200
11,503
Copper Pounds(1) (millions)
$150
(millions, C$)(5)
(in 000’s)
4,853
$100
3,112
2,335 1,787 1,781
1,221 $50
282 646 543 Agua Rica
161
Measured & Indicated Mineral Resource $0
Agua Rica Suyai Monument Jeronimo Arco Sul Lavra Velha Estimate (3) Leagold
Bay (57%) (4)
(3) Inferred Mineral Resource Estimate Yamana's ownership (20.5%)
Measured & Indicated Mineral Resource Estimate Inferred Mineral Resource Estimate
Agua Rica - Integration Agreement
Recently signed agreement to develop and operate Agua
Rica using the existing infrastructure and facilities of the
nearby Alumbrera copper mine.
Mine life expected to exceed 25 years.
Production in the first 10 years forecast to average 520
million lbs/year of copper-equivalent metal(6).
A pre-feasibility study is imminent and a feasibility study is
expected to be completed in 2020.
1. As of December 31, 2018, further details including tonnes, grade and assumptions are presented in the Company’s press release issued on February 14, 2019.
2. Gold equivalent ounces include gold plus silver at a ratio of 72:1.
3. Measured and Indicated mineral resources are inclusive of Proven and Probable mineral reserves.
BofAML Global Metals & Mining Conference 4.
5.
6.
Mineral resources that are not mineral reserves do not have demonstrated economic viability.
FactSet market data as of May 1, 2019.
Copper equivalent metal includes copper with gold, molybdenum, and silver converted to copper-equivalent metal based on the following metal price assumptions: US$6,614/tonne for copper, US$1,250/oz for gold,
13
US$24,250/tonne for molybdenum, and US$18/oz for silver.
7. See Cautionary Note Regarding Forward Looking Information.ENHANCED SHAREHOLDER RETURNS
DIVIDEND INCREASES
Immediate doubling of the annual dividend to $0.04/share from the current $0.02/share,
subject to completion of the Chapada Sale Transaction.
Progressive dividend increases are anticipated as debt is repaid from cash flows and through
asset monetizations(1).
Pro forma dividend yield of 1.9% - the highest among the intermediate peers, in line with the
Company’s objective.
Dividend Yield (%)(2)
2.2%
1.9% 1.9%
1.2%
0.9% 0.9%
0.4%
0.0% 0.0% 0.0% 0.0% 0.0%
Barrick Yamana - Newmont Agnico Yamana - Alamos Kirkland Kinross B2Gold IAMGOLD New Gold Eldorado
Pro forma Eagle Previous Lake
1. See Cautionary Note Regarding Forward Looking Information.
BofAML Global Metals & Mining Conference 2. FactSet market data as of May 1, 2019. 14DEBT REDUCTION
DELEVERAGING BENEFITS
Deleveraging benefits highlighted by a decline in Net Debt/EBITDA(1) to 1.5x from 2.5x at year-
end 2018.
Contingent payments expected to provide opportunities for further reductions.
Enhanced free cash flow of the precious metals portfolio to deliver further improvements to
the balance sheet. Net Debt to EBITDA(1,2) expected to contract to 1.0x by 2021.
Net Debt / Adj EBITDA FORECAST(1,2)
2.8x
2.6x
2.8x Net Debt/EBITDA
2.5x
2.3x Target of 1.0X
1.5x
1.0x
$2,060 $1,774 $1,592 $1,858 $1,759
2014 2015 2016 2017 2018 On Close of the Target
Chapada
Transaction
Total Debt (millions of USD) Net Debt / Adj. EBITDA
1. A non-GAAP measure, additional line item or subtotal. A reconciliation of the IFRS measure to the non-GAAP measure can be found at
www.yamana.com/Q12019. Net debt to trailing 12-months EBITDA. EBIITDA forecasts assume current metal prices and exchange rates.
BofAML Global Metals & Mining Conference 2. See Cautionary Note Regarding Forward-Looking Information. 15DEBT REDUCTION
IMMEDIATE DEBT REDUCTION, LONGER-TERM MATURITY
$800 million of upfront cash consideration on closing of the Chapada Sale Transaction to be
allocated to debt repayment.
Early retirement of debt expected to deliver annualized interest savings >$35 million per year.
CURRENT DEBT MATURITY ILLUSTRATIVE DEBT MATURITY
PROFILE PROFILE(1)
$600
PRIORITY TO RETIRE NEARER-
TERM MATURITIES
$400
CASH FLOWS, CONTINGENCIES
AND MONETIZATIONS
Millions
AVAILABLE FOR FURTHER
REDUCTIONS
$200
$0
2019 2020 2021 2022 2023 2024 2025 2026 2027 2028
Illustrative Maturities
BofAML Global Metals & Mining Conference 1. See Cautionary Note Regarding Forward Looking Information. 16ENHANCED OUTLOOK FOR FREE CASH FLOW
IN THE NEAR AND MEDIUM TERM
With Chapada and its capital intensity removed, the outlook for FCF is enhanced, both in
magnitude and duration.
Company FCF is now available to deliver further balance sheet improvements…
… and to maximize opportunities that are already in the portfolio.
2019 – 2021 FCF(2,3)/MARKET CAPITALIZATION(1)
21%
20%
18% 18%
15%
13% 12%
5%
Kinross Yamana Newmont Kirkland Barrick Gold Alamos Gold Agnico Eagle IAMGOLD
Goldcorp Lake
GREATER EXPECTED FREE CASH FLOW GENERATION FOR MARKET CAPITALIZATION
1. Based on company estimates and FactSet market data as of April 22, 2019.
BofAML Global Metals & Mining Conference 2. A non-GAAP measure, additional line item or subtotal. A reconciliation of the IFRS measure to the non-GAAP measure can be found at www.yamana.com/Q12019. 17
3. See Cautionary Note Regarding Forward Looking Information.DELIVERING VALUE WITH DISCIPLINED
CAPITAL ALLOCATION
Free Cash Flow
Further Portfolio Optimization
Opportunities
• Asset monetizations of non-
producing assets with the
objective of maximizing returns
Managing Leverage
Returning Capital to
Internal Investments
Shareholders
M&A
Financial flexibility is a core value and of strategic importance
BofAML Global Metals & Mining Conference 18“A dominant intermediate sized company with a portfolio
of high quality assets providing stable and increasing
cash flows, optionality, growth and prospects for
additional monetizations. With an America’s focus, we
operate in the best mining jurisdictions in the world.”
“A dominant intermediate sized company with a portfolio of high quality assets providing stable and
BofAML Global Metals & Mining Conference increasing cash flows, optionality, growth and prospects for additional monetizations. With an 19
America’s focus, we operate in the best mining jurisdictions in the world.”APPENDIX
TABLE OF CONTENTS
Slide
Health, Safety, Environment & Community – 2018 Highlights 21
Mine by Mine Overview 22
First Quarter in Review 28
New AISC Cost Metric 30
Copper Advanced Sales Program 33
Currency Hedging 34
Mineral Reserve and Mineral Resource Estimates 36
BofAML Global Metals & Mining Conference 20HEALTH, SAFETY, ENVIRONMENT & COMMUNITY
2018 HIGHLIGHTS
20% 99%
Workforce from
94%
Host Country
Reduction in TRIR
Host Countries Procurement Rate
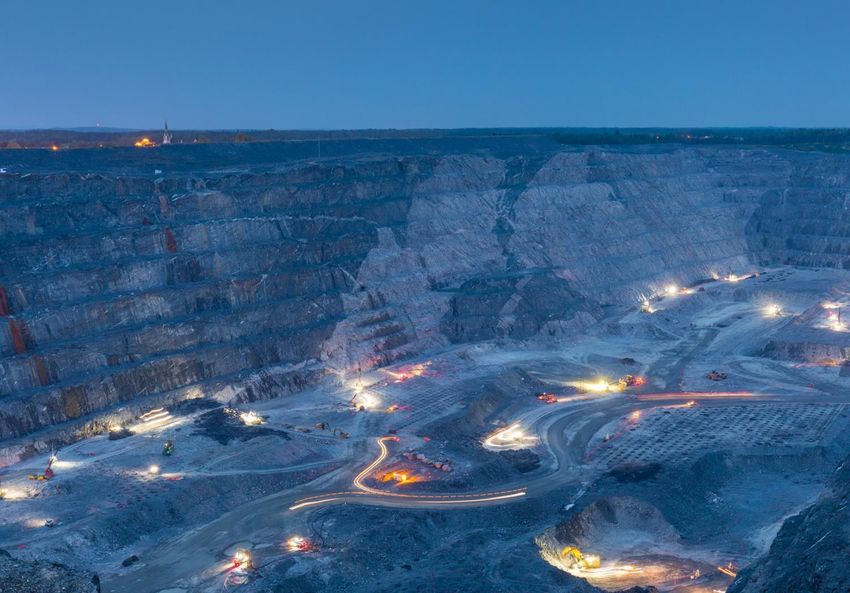
BofAML Global Metals & Mining Conference 21CANADIAN MALARTIC
SIGNIFICANT PRODUCTION AND CASH FLOWS
CANADIAN MALARTIC CANADA
Gold
50% Yamana Owned Open Pit Mine
Tonnes Grade Contained Ounces
50% Basis
(000’s) (g/t) (000’s)
Total Proven and Probable Mineral Reserves(2)
Gold 78,829 1.10 2,780
Total Measured and Indicated Mineral Resources(2,3,4)
Gold 15,500 1.74 869
Inferred Mineral Resources(2,3,4)
Gold 36,210 1.99 2,319
2019E
Q2 2018 Q3 2018 Q4 2018 Q1 2019 2018
50% Basis Guidance(7)
Gold Production (oz) 91,863 88,603 84,732 83,670 348,600 330,000
Cost of Sales per GEO
- - - 1,036 967 965
Sold ($/GEO) (6)
Cash Cost per GEO Sold
(1,5,6) - - - 602 573 560
($/GEO)
AISC per GEO Sold
(1,5,6) - - - 716 732 730
($/GEO)
Sustaining Capital ($M) 10.2 10.9 11.4 7.4 46.4 47.0
Exploration Capital ($M) 0.6 0.9 0.4 0.3 4.3 2.0
Expansion Capital ($M) 8.5 8.7 8.9 7.7 31.4 37.0
1. A non-GAAP measure, additional line item or subtotal. A reconciliation of the IFRS measure to the non-GAAP measure can be found at www.yamana.com/Q42018.
2. As of December 31, 2018, further details including tonnes, grade and assumptions are presented in the Company’s press release issued on February 14, 2019. Please refer to the mineral reserves and mineral resources estimates commencing on slide 40.
3. Measured and Indicated mineral resources are exclusive of Proven and Probable mineral reserves, please refer to the mineral reserves and mineral resources Estimates on slide 41.
BofAML Global Metals & Mining Conference 4.
5.
Mineral resources that are not mineral reserves do not have demonstrated economic viability.
2018 Actuals have been adjusted to reflect the updated methodology. Reconciliations for all non-GAAP financial measures are available at www.yamana.com/Q42018 see section 11 of the Company’s annual 2018 Management’s Discussion & Analysis, which has been filed on SEDAR.
22
6. Gold equivalent ounces (“GEO”) include gold plus silver at a ratio of 79.6:1 and 82.5:1 for 2018 and the forecast for 2019 guidance, respectively.
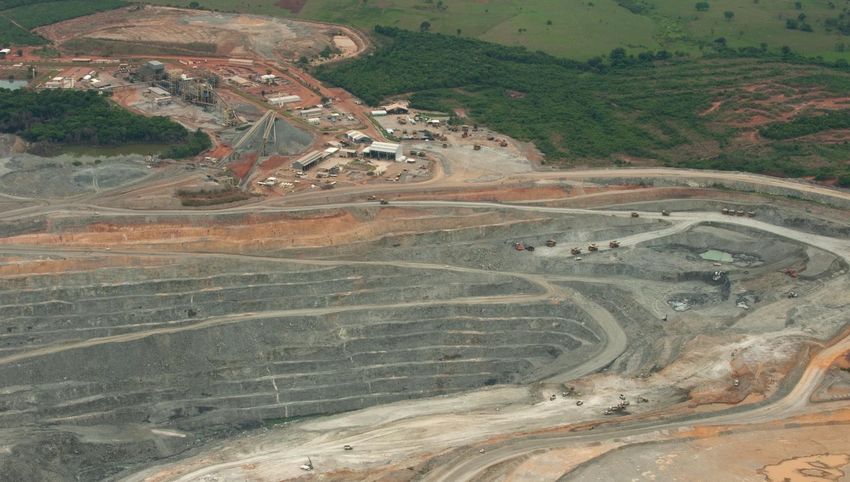
7. See Cautionary Note Regarding Forward Looking Information.CHAPADA
TEMPLATE FOR CREATING VALUE
CHAPADA BRAZIL Gold-Copper
100% Yamana Owned Open Pit Mine
Tonnes (000’s) Grade Contained (000’s)
Total Proven and Probable Mineral Reserves(2)
Gold 729,824 0.19 g/t 4,546 oz
Copper 664,629 0.25 % 3,707,000 lbs
Total Measured and Indicated Mineral Resources(2,3,4)
Gold 505,137 0.21 g/t 3,364 oz
Copper 422,814 0.22 % 2,026,000 lbs
Inferred Mineral Resources(2,3,4)
Gold 168,646 0.11 g/t 616 oz
Copper 156,081 0.23 % 781,000 lbs
Q2 2018 Q3 2018 Q4 2018 Q1 2019 2018 2019E Guidance(7)
Gold (oz) 30,329 27,080 40,841 21,520 121,003 100,000
Production
Copper (M lbs) 31.1 28.6 39.0 28.1 129.2 120.0
(6)
GEO ($/oz) - - - 467 420 490
Cost of Sales
Copper ($/lb) - - - 1.77 1.78 1.75-1.95
(1,5) GEO ($/oz)(6) - - - 413 388 430
Cash Cost
Copper ($/lb) - - - 1.65 1.74 1.60 - 1.80
(6)
(1,5) GEO ($/oz) - - - 574 473 525
AISC
Copper ($/lb) - - - 2.19 2.06 1.90-2.10
Sustaining Capital ($M) 8.6 12.8 9.4 13.3 35.2 35.0
Exploration Capital ($M) 1.6 1.1 1.3 0.5 4.8 4.0
Expansion Capital ($M) 0.7 0.6 2.4 4.8 4.1 13.0
1. A non-GAAP measure, additional line item or subtotal. A reconciliation of the IFRS measure to the non-GAAP measure can be found at www.yamana.com/Q42018.
2. As of December 31, 2018, further details including tonnes, grade and assumptions are presented in the Company’s press release issued on February 14, 2019. Please refer to the mineral reserves and mineral resources estimates commencing on slide 40.
3. Measured and Indicated mineral resources are exclusive of Proven and Probable mineral reserves, please refer to the mineral reserves and mineral resources Estimates on slide 41.
BofAML Global Metals & Mining Conference 4.
5.
Mineral resources that are not mineral reserves do not have demonstrated economic viability.
2018 Actuals have been adjusted to reflect the updated methodology. Reconciliations for all non-GAAP financial measures are available at www.yamana.com/Q42018 see section 11 of the Company’s annual 2018 Management’s Discussion & Analysis, which has been filed on SEDAR.
23
6. Gold equivalent ounces (“GEO”) include gold plus silver at a ratio of 79.6:1 and 82.5:1 for 2018 and the forecast for 2019 guidance, respectively.
7. See Cautionary Note Regarding Forward Looking Information.JACOBINA
LONGER TERM SUSTAINABLE PRODUCTION
JACOBINA BRAZIL
Gold
100% Yamana Owned Complex of Underground Mines
Tonnes Grade Contained Ounces
(000’s) (g/t) (000’s)
Total Proven and Probable Mineral Reserves(2)
Gold 27,855 2.34 2,099
Total Measured and Indicated Mineral Resources(2,3,4)
Gold 40,710 2.47 3,232
Inferred Mineral Resources(2,3,4)
Gold 12,145 2.58 1,008
Q2 2018 Q3 2018 Q4 2018 Q1 2019 2018 2019E Guidance(7)
Gold Production (oz) 37,730 35,368 37,071 38,617 144,695 145,000
Cost of Sales per GEO Sold 1,005
- - - 1,077 967
($/GEO)(6)
Cash Cost per GEO Sold 700
- - - 637 675
($/GEO)(1,5,6)
AISC per GEO Sold 890
- - - 831 891
($/GEO)(1,5,6)
Sustaining Capital ($M) 4.6 8.2 5.1 3.4 21.0 21.0
Exploration Capital ($M) 1.9 1.3 1.7 1.0 5.9 5.0
Expansion Capital ($M) 5.2 3.3 9.4 10.4 20.6 28.0
1. A non-GAAP measure, additional line item or subtotal. A reconciliation of the IFRS measure to the non-GAAP measure can be found at www.yamana.com/Q42018.
2. As of December 31, 2018, further details including tonnes, grade and assumptions are presented in the Company’s press release issued on February 14, 2019. Please refer to the mineral reserves and mineral resources estimates commencing on slide 40.
3. Measured and Indicated mineral resources are exclusive of Proven and Probable mineral reserves, please refer to the mineral reserves and mineral resources Estimates on slide 41.
BofAML Global Metals & Mining Conference 4.
5.
Mineral resources that are not mineral reserves do not have demonstrated economic viability.
2018 Actuals have been adjusted to reflect the updated methodology. Reconciliations for all non-GAAP financial measures are available at www.yamana.com/Q42018 see section 11 of the Company’s annual 2018 Management’s Discussion & Analysis, which has been filed on SEDAR.
24
6. Gold equivalent ounces (“GEO”) include gold plus silver at a ratio of 79.6:1 and 82.5:1 for 2018 and the forecast for 2019 guidance, respectively.
7. See Cautionary Note Regarding Forward Looking Information.CERRO MORO
CONTRIBUTING TO A STEP CHANGE IN CASH FLOWS
CERRO MORO ARGENTINA Gold-Silver
100% Yamana Owned Open Pit and Underground
Tonnes (000’s) Grade (g/t) Contained Ounces (000’s)
Total Proven and Probable Mineral Reserves(2)
Gold 1,809 11.61 675
Silver 1,809 652.6 37,959
Total Measured and Indicated Mineral Resources(2,3,4)
Gold 1,241 5.22 208
Silver 1,241 393.5 15,704
Inferred Mineral Resources(2,3,4)
Gold 1,706 3.84 211
Silver 1,706 257.8 14,139
Q2 2018 Q3 2018 Q4 2018 Q1 2019 2018 2019E Guidance(7)
Production Gold 9,644 38,083 45,066 38,471 92,793 130,000
(oz)
Silver 384,629 1,656,550 2,077,906 2,021,489 4,119,085 6,000,000
(6)
Cost of Sales per GEO sold ($/GEO) - - - 1,215 1,096 1,240
(1,5,6)
Cash Cost per GEO sold ($/GEO) - - - 701 629 690
(1,5,6)
AISC per GEO sold ($/GEO) - - - 841 848 890
Sustaining Capital ($M) - 5.6 9.4 2.2 15.0 28.0
Exploration Capital ($M) 3.4 3.5 3.0 1.7 11.3 15.0
Expansion Capital ($M) 11.4 - 2.7 0.5 61.3 2.0
1. A non-GAAP measure, additional line item or subtotal. A reconciliation of the IFRS measure to the non-GAAP measure can be found at www.yamana.com/Q42018.
2. As of December 31, 2018, further details including tonnes, grade and assumptions are presented in the Company’s press release issued on February 14, 2019. Please refer to the mineral reserves and mineral resources estimates commencing on slide 40.
3. Measured and Indicated mineral resources are exclusive of Proven and Probable mineral reserves, please refer to the mineral reserves and mineral resources Estimates on slide 41.
BofAML Global Metals & Mining Conference 4.
5.
Mineral resources that are not mineral reserves do not have demonstrated economic viability.
2018 Actuals have been adjusted to reflect the updated methodology. Reconciliations for all non-GAAP financial measures are available at www.yamana.com/Q42018 see section 11 of the Company’s annual 2018 Management’s Discussion & Analysis, which has been filed on SEDAR.
25
6. Gold equivalent ounces (“GEO”) include gold plus silver at a ratio of 79.6:1 and 82.5:1 for 2018 and the forecast for 2019 guidance, respectively.
7. See Cautionary Note Regarding Forward Looking Information.EL PEÑÓN
DELIVERING QUALITY PRODUCTION
EL PEÑÓN CHILE Gold-Silver
100% Yamana Owned Underground Mine
Tonnes (000’s) Grade (g/t) Contained Ounces (000’s)
Total Proven and Probable Mineral Reserves(2)
Gold 5,478 4.55 800
Silver 5,478 141.3 24,893
Total Measured and Indicated Mineral Resources(2,3,4)
Gold 2,830 4.35 396
Silver 2,830 141.8 12,904
Inferred Mineral Resources(2,3,4)
Gold 16,719 1.74 933
Silver 16,719 60.6 32,570
Q2 2018 Q3 2018 Q4 2018 Q1 2019 2018 2019E Guidance(7)
Production Gold 37,800 35,746 37,956 34,025 151,893 150,000
(oz)
Silver 925,450 892,461 1,186,789 994,809 3,903,961 4,000,000
(6)
Cost of Sales per GEO sold ($/GEO) - - - 1,328 1,314 1,100
(1,5,6)
Cash Cost per GEO sold ($/GEO) - - - 816 851 800
(1,5,6)
AISC per GEO sold ($/GEO) - - - 1,081 1,117 1,050
Sustaining Capital ($M) 9.5 7.3 7.4 6.8 31.8 27.0
Exploration Capital ($M) 4.5 5.5 4.7 3.9 17.9 17.0
Expansion Capital ($M) - - 1.0 - 1.1 2.0
1. A non-GAAP measure, additional line item or subtotal. A reconciliation of the IFRS measure to the non-GAAP measure can be found at www.yamana.com/Q42018.
2. As of December 31, 2018, further details including tonnes, grade and assumptions are presented in the Company’s press release issued on February 15, 2019.
3. Measured and Indicated mineral resources are exclusive of Proven and Probable mineral reserves, please refer to the mineral reserves and mineral resources estimates commencing on slide 40.
BofAML Global Metals & Mining Conference 4.
5.
Mineral resources that are not mineral reserves do not have demonstrated economic viability.
2018 Actuals have been adjusted to reflect the updated methodology. Reconciliations for all non-GAAP financial measures are available at www.yamana.com/Q42018 see section 11 of the Company’s annual 2018 Management’s Discussion & Analysis, which has been filed on SEDAR.
26
6. Gold equivalent ounces (“GEO”) include gold plus silver at a ratio of 79.6:1 and 82.5:1 for 2018 and the forecast for 2019 guidance, respectively.
7. See Cautionary Note Regarding Forward Looking Information.MINERA FLORIDA
TRANSITIONING TO HIGHER GRADE ZONES
MINERA FLORIDA CHILE
Gold-Silver
100% Yamana Owned Underground Mine
Tonnes Grade Contained Ounces
(000’s) (g/t) (000’s)
Total Proven and Probable Mineral Reserves(2)
Gold 4,449 2.82 404
Total Measured and Indicated Mineral Resources(2,3,4)
Gold 5,036 5.05 817
Inferred Mineral Resources(2,3,4)
Gold 6,445 5.01 1,038
Q2 2018 Q3 2018 Q4 2018 Q1 2019 2018 2019E Guidance(7)
Gold Production (oz) 16,717 21,909 24,526 19,654 81,635 85,000
Cost of Sales per GEO Sold 1,398 1,225
- - - 1,206
($/GEO)(6)
(1,5,6)
Cash Cost per GEO Sold 917 760
- - - 832
($/GEO)
AISC per GEO Sold ($/GEO)(1,5,6) - - - 1,208 1,327 990
Sustaining Capital ($M) 3.5 3.6 4.4 3.0 14.5 14.0
Exploration Capital ($M) 2.9 3.3 3.9 2.9 14.0 5.0
Expansion Capital ($M) 3.5 15.6 10.5 2.6 32.2 10.0
1. A non-GAAP measure, additional line item or subtotal. A reconciliation of the IFRS measure to the non-GAAP measure can be found at www.yamana.com/Q42018.
2. As of December 31, 2018, further details including tonnes, grade and assumptions are presented in the Company’s press release issued on February 14, 2019. Please refer to the mineral reserves and mineral resources estimates commencing on slide 40.
3. Measured and Indicated mineral resources are exclusive of Proven and Probable mineral reserves, please refer to the mineral reserves and mineral resources Estimates on slide 41.
BofAML Global Metals & Mining Conference 4.
5.
6.
Mineral resources that are not mineral reserves do not have demonstrated economic viability.
2018 Actuals have been adjusted to reflect the updated methodology. Reconciliations for all non-GAAP financial measures are available at www.yamana.com/Q42018 see section 11 of the Company’s annual 2018 Management’s Discussion & Analysis, which has been filed on SEDAR.
Gold equivalent ounces (“GEO”) include gold plus silver at a ratio of 79.6:1 and 82.5:1 for 2018 and the forecast for 2019 guidance, respectively.
27
7. See Cautionary Note Regarding Forward Looking Information.FIRST QUARTER 2019
FINANCIAL AND OPERATIONAL HIGHLIGHTS
Financial Highlights Q1 2019
(In millions of US Dollars; except per share amounts)
Net loss per share – basic and diluted $0.00
Adjusted earnings per share(1) $0.02
Cash flows from operating activities, before net change in working capital and $103.2
adjustments(1,2)
Adjustment for deferred revenue relating to the copper advanced sales program $25.1
Operational Highlights Q1 2019
Total Gold Equivalent Production, in thousands of ounces(3) 272
Cost of Sales per GEO sold $1,098
By-product cash costs per GEO sold(1) $526
By-product AISC per GEO sold(1) $865
Gold Production, in thousands of ounces 236
Silver Production, in millions of ounces 3,016
Copper Production, in millions of pounds 28.1
1. A non-GAAP measure, additional line item or subtotal. A reconciliation of the IFRS measure to the non-GAAP measure can be found at www.yamana.com/Q12019.
2. Cash flows from operating activities for the three months ended March 31, 2019 include the impact of $36.0 million in non-cash deferred revenue recognized in respect of metal
BofAML Global Metals & Mining Conference sales agreements, including $25.1 million associated with the copper advanced sales program. 28
3. Gold equivalent ounces include gold plus silver at a ratio of 83.8:1 for Q1 2019.FIRST QUARTER 2019
FINANCIAL SUMMARY
(In millions except per share figures) Q1 2019 Q1 2018 Change
Revenue $407.1 $454.7 $(47.6)
Gross margin excluding DD&A $201.3 $190.5 $10.80
DD&A $117.7 $104.1 $13.60
G&A expense $21.5 $26.2 $(4.7)
Net loss(2) $(4.1) $(160.1) $156.0
Net loss per share(2) $0.00 $(0.17) $0.17
Adjusted earnings per share(2,3) $0.03 $0.02 $0.01
Sustaining capital $37.9 $39.8 $(1.9)
Expansionary capital $26.9 $75.2 $(48.3)
Exploration capitalized/expensed $12.1/$2.5 $16.8/$3.8 $(4.7)/$(1.3)
Cash flows from operating activities $12.4 $122.4 $(110.0)
Cash flows from operating activities before net change in working
$103.2 $206.4 $(103.2)
capital(1)
Cash flows from operating activities before net change in working capital
and adjusted deferred revenue relating to the copper advanced sales $128.3 $81.4 $46.9
program(1)
1. A non-GAAP measure, additional line item or subtotal. A reconciliation of the IFRS measure to the non-GAAP measure can be found at www.yamana.com/Q12019.
BofAML Global Metals & Mining Conference 2. Attributable to Yamana equity holders. 29
3. Certain non-cash and other items that may not be reflective of current and ongoing operations were $28.1 million or $0.03 per share for Q1 2019.NEW COST METRICS
BRIDGING OUR OLD AND NEW REPORTING
With our 2019 Guidance, we have introduced a number of changes to the reporting of our
non-GAAP financial measures for periods after January 1, 2019:
• Production
• Silver ounces will now be treated as gold equivalent ounces (“GEO”)
• GEO will be based on an average realized gold-to-silver price ratio for the quarter. Guidance
uses an assumed ratio of 82.5:1
• Cash Costs(1)
• Now calculated on a per GEO sold basis
• New metric more closely aligns with GAAP financial measures. Equal to Cost of Sales excluding
Depletion, depreciation, and amortization (“DD&A”), net of treatment and refining charges
• All-in Sustaining Costs (“AISC”) (1)
• Now calculated on a per GEO sold basis
• Changes to metric result from the adoption of the recently updated Guidance Note from the
World Gold Council. Notable additions include capitalized exploration spending, closure related
expenses, and stock-based compensation
1. A non-GAAP measure, additional line item or subtotal. A reconciliation of the IFRS measure to the non-GAAP measure can be found at
BofAML Global Metals & Mining Conference www.yamana.com/Q42018. 30NEW AISC COST METRIC
CERRO MORO AS AN EXAMPLE
$1,000 Change in Accounting Treatment/Reclassification Items
+$130
$900
$800 +$74 -$4
$700 +$40
$600
Cerro Moro
$500 $760/GEO
$890/GEO
$400
$650/oz
$300 Gold
$200
$100
$0
Prior 2019 Co- Historical Exploration Others New New 2019
Product Bocamina CAPEX Argentina AISC/GEO
AISC/Oz Sales Tax Export Tax Sold(2)
Produced
Guidance(1,2)
Export tax of ~$30M per year is manageable,
Change in Accounting Treatment items do ends in 2020, and greater than our fiscal
not affect cash flow and FCF of the asset stability agreement which is being discussed
with Argentinean government
1. See Press Release from February 15, 2018, entitled “Yamana Gold Provides 2018-2020 Outlook” for prior guidance.
BofAML Global Metals & Mining Conference 2. A non-GAAP measure, additional line item or subtotal. A reconciliation of the IFRS measure to the non-GAAP measure can be found at www.yamana.com/Q42018. 31
3. See Cautionary Note Regarding Forward Looking Information.NEW CASH COST METRIC
MORE CLOSELY ALIGNS WITH GAAP REPORTING
$1,400
$1,200
$1,000 +$550/GEO
$1,240/GEO
Sold
Cerro Moro
$800
$600
$400
$690/GEO Sold
$200
$0
2019 Cash Costs(1) per GEO DDA per GEO sold 2019 Cost of Sales per GEO sold
sold Cerro Moro Guidance Cerro Moro Guidance
Non-cash DDA does not impact cash flow or FCF of
the mine; strategic target of adding 1M GEO to
mineral inventory will reduce DDA/GEO
1. A non-GAAP measure, additional line item or subtotal. A reconciliation of the IFRS measure to the non-GAAP measure can be found at
BofAML Global Metals & Mining Conference www.yamana.com/Q42018. 32
2. See Cautionary Note Regarding Forward Looking Information.COPPER ADVANCED SALES PROGRAM
ILLUSTRATIVE IMPACT FROM ADVANCED COPPER SALES(3)
Cumulative
March 31, June 30, September 30, December 31, March 31, June 30,
(In millions) Expected
2018 2018 2018 2018 2019E(2) 2019E(2)
Impact
Copper pounds to be
delivered per contract 13.2 10.7 8.2 8.2 40.3
(millions)
Cash flows from
operating activities
$206.4 $157.5 $86.6 $115.8
before net change in
working capital(1)
Impact due to copper
(125.0) - 41.7 33.3 25.1 24.9
advanced sales program
Cash flows from
operating activities
before net change in
working capital, $81.4 $157.5 $128.3 $149.1 - -
normalized for the
copper advanced sales
program(1)
1. A non-GAAP measure, additional line item or subtotal. A reconciliation of the IFRS measure to the non-GAAP measure can be found at www.yamana.com/Q42018.
BofAML Global Metals & Mining Conference 2. For illustration purposes only; the Company intends to provide information each subsequent period reflecting the impact due to copper advanced sales program over its term. 33
3. See Cautionary Note Regarding Forward Looking Information.34
CURRENCY TAILWINDS
FOREIGN EXCHANGE BENEFITS
Currencies vs USD indexed through 2018
10%
0%
CAD
-10% CLP
BRL
-20%
-30%
-40%
-50% ARS
-60%
Jan-18 Apr-18 Jul-18 Oct-18 Jan-19
Zero Cost Collar Contracts:
April - June 2019, Brazilian Real to USD average call and put strike prices of R$3.15 and
R$3.47 per USD, respectively, totalling R$90M evenly split by month.
April - December 2019, Brazilian Real to USD average call and put strike prices of R$3.75
BRL and R$4.74 per USD, respectively, totalling R$261M evenly split by month.
April - December 2019, Brazilian Real to USD average call and put strike prices of R$3.75
and R$4.87 per USD, respectively, totalling R$135M evenly split by month.
Forward Contracts:
April – December 2019, CLP 46.44B evenly split by month at a weighted average forward
CLP
rate of CLP 652.42 per USD, expected to cover ~50% of CLP denominated operating costs.
BofAML Global Metals & Mining ConferenceYEAR END MINERAL RESERVES AND MINERAL RESOURCES(1,2,3,4)
SIGNIFICANT INCREASES IN GOLD RESOURCES AND COPPER
Proven and Probable Mineral Reserves Measured and Indicated Mineral Resources Inferred Mineral Resources
5.4%
6.7%
Gold
oz in 000’s
5.8%
55%
Copper
210%
lbs in M
1. As of December 31, 2018, further details including tonnes and grade are presented in the Company’s press release issued on February 14, 2019. Please refer to the mineral reserves and mineral
resources estimates commencing on slide 40.
2. Includes Mineral Reserves and Mineral Resources for Yamana’s operating mines.
BofAML Global Metals & Mining Conference 3. As of December 31, 2018, further details including tonnes and grade are presented in the Company’s press release issued on February 14, 2019. 2P gold (866Mt @ 0.45 g/t), 2P silver (12Mt @
174.5 g/t), 2P copper (673Mt @ 0.25%), M&I gold (771Mt @ 0.64 g/t), M&I silver (14Mt & 84.1 g/t), M&I copper (431Mt @ 0.22%), inferred gold (334Mt @ 0.95 g/t), inferred silver (26Mt @ 64 g/t),
35
inferred copper (157Mt @ 0.23%).
4. Gold mineral reserves and mineral resources exclude the Gualcamayo mine which was sold in 2018.MINERAL RESERVES AND MINERAL RESOURCES ESTIMATES
SUMMARY(1)
Proven and Probable Mineral Reserves
Tonnes (000s) Grade (g/t) Contained oz. (000s)
Gold 86,653 0.45 12,496
Silver 11,736 174.5 65,828
Tonnes (000s) Grade (%) Contained lbs (M )
Copper 673,357 0.25 3,784
Measured and Indicated Mineral Resources
Tonnes (000s) Grade (g/t) Contained oz. (000s)
Gold 771,033 0.64 15,941
Silver 13,807 84.1 37,317
Tonnes (000s) Grade (%) Contained lbs (M )
Copper 277,649 0.22 2,090
Inferred Mineral Resources
Tonnes (000s) Grade (g/t) Contained oz. (000s)
Gold 333,516 0.95 10,162
Silver 25,770 64.4 53,377
Tonnes (000s) Grade (%) Contained lbs (M )
Copper 156,928 0.23 785
BofAML Global Metals & Mining Conference 36
1. As of December 31, 2018.PROVEN AND PROBABLE MINERAL RESERVES
AS OF DECEMBER 31, 2018
P ro v e n M ine ra l R e s e rv e s P ro ba ble M ine ra l R e s e rv e s T o t a l P ro v e n & P ro ba ble
To nnes Grade Co ntained To nnes Grade Co ntained To nnes Grade Co ntained
G o ld (000's) (g/t) o z. (000's) (000's) (g/t) o z. (000's) (000's) (g/t) o z. (000's)
A lumbrera (12.5%) 8,435 0.39 106 294 0.37 4 8,728 0.39 109
Canadian M alartic (50%) 23,029 0.89 658 55,799 1.18 2,122 78,829 1.10 2,780
Cerro M o ro 43 10.57 15 1,766 11.64 661 1,809 11.61 675
Chapada Zo nes 388,701 0.17 2,103 275,928 0.16 1,381 664,629 0.16 3,484
Suruca Zo nes 11,454 0.42 153 53,741 0.53 908 65,195 0.51 1,062
To tal Chapada 400,155 0.18 2,256 329,669 0.22 2,289 729,824 0.19 4,546
El P eñó n Ore 693 5.11 114 3,738 5.38 646 4,431 5.33 760
El P eñó n Sto ckpiles 17 2.41 1 1,029 1.18 39 1,047 1.20 40
To tal El P eñó n 710 5.04 115 4,768 4.47 685 5,478 4.55 800
Jaco bina 18,565 2.32 1,385 9,290 2.39 714 27,855 2.34 2,099
Jero nimo (57%) 6,350 3.91 798 2,331 3.79 284 8,681 3.88 1,082
M inera Flo rida Ore 690 3.61 80 2,512 3.54 286 3,202 3.56 366
M inera Flo rida Tailings 0 0.00 0 1,248 0.94 38 1,248 0.94 38
To tal M inera Flo rida 690 3.61 80 3,760 2.68 324 4,449 2.82 404
T o t a l G o ld M ine ra l R e s e rv e s 4 5 7 ,9 7 7 0 .3 7 5 ,4 13 4 0 7 ,6 7 7 0 .5 4 7 ,0 8 3 8 6 5 ,6 5 3 0 .4 5 12 ,4 9 6
A gua Rica 384,871 0.25 3,080 524,055 0.21 3,479 908,926 0.22 6,559
To nnes Grade Co ntained To nnes Grade Co ntained To nnes Grade Co ntained
S ilv e r (000's) (g/t) o z. (000's) (000's) (g/t) o z. (000's) (000's) (g/t) o z. (000's)
Cerro M o ro 43 620.7 857 1,766 653.3 37,102 1,809 652.6 37,959
El P eñó n Ore 693 166.1 3,700 3,738 171.7 20,630 4,431 170.8 24,330
El P eñó n Sto ckpiles 17 107.2 60 1,029 15.2 502 1,046 16.7 562
To tal El P eñó n 710 164.7 3,760 4,768 137.9 21,133 5,478 141.3 24,893
M inera Flo rida Ore 690 28.1 623 2,512 21.9 1,770 3,202 23.2 2,393
M inera Flo rida Tailings 0 0.0 0 1,248 14.6 584 1,248 14.6 584
To tal M inera Flo rida 690 28.1 623 3,760 19.5 2,353 4,449 20.8 2,976
T o t a l S ilv e r M ine ra l R e s e rv e s 1,4 4 3 112 .9 5 ,2 4 0 10 ,2 9 4 18 3 .1 6 0 ,5 8 8 11,7 3 6 17 4 .5 6 5 ,8 2 8
A gua Rica 384,871 3.7 46,176 524,055 3.3 56,070 908,926 3.5 102,246
To nnes Grade Co ntained To nnes Grade Co ntained To nnes Grade Co ntained
C o ppe r (000's) (%) lbs (mm) (000's) (%) lbs (mm) (000's) (%) lbs (mm)
A lumbrera (12.5%) 8,435 0.40 74 294 0.39 3 8,728 0.40 77
Chapada Zo nes 388,701 0.25 2,138 275,928 0.26 1,568 664,629 0.25 3,707
Suruca Zo nes 0 0.00 0 0 0.00 0 0 0.00 0
To tal Chapada 388,701 0.25 2,138 275,928 0.26 1,568 664,629 0.25 3,707
T o t a l C o ppe r M ine ra l R e s e rv e s 3 9 7 ,13 6 0 .2 5 2 ,2 12 2 7 6 ,2 2 2 0 .2 6 1,5 7 1 6 7 3 ,3 5 7 0 .2 5 3 ,7 8 4
A gua Rica 384,871 0.56 4,779 524,055 0.43 5,011 908,926 0.49 9,790
To nnes Grade Co ntained To nnes Grade Co ntained To nnes Grade Co ntained
Z inc (000's) (%) lbs (mm) (000's) (%) lbs (mm) (000's) (%) lbs (mm)
M inera Flo rida Ore 690 1.53 23 2,512 1.13 62 3,202 1.21 85
M inera Flo rida Tailings 0 0.00 0 1,248 0.58 16 1,248 0.58 16
T o t a l Z inc M ine ra l R e s e rv e s 690 1.5 3 23 3 ,7 6 0 0 .9 4 78 4 ,4 4 9 1.0 4 10 2
To nnes Grade Co ntained To nnes Grade Co ntained To nnes Grade Co ntained
M o lybde num (000's) (%) lbs (mm) (000's) (%) lbs (mm) (000's) (%) lbs (mm)
A lumbrera (12.5%) 8,435 0.013 2.45 294 0.014 0.09 8,728 0.013 2.54
T o t a l M o ly M ine ra l R e s e rv e s 8 ,4 3 5 0 .0 13 2 .4 5 294 0 .0 14 0 .0 9 8 ,7 2 8 0 .0 13 2 .5 4
A gua Rica 384,871 0.033 279 524,055 0.030 350 908,926 0.031 629
BofAML Global Metals & Mining Conference 37MEASURED, INDICATED AND INFERRED MINERAL RESOURCES
AS OF DECEMBER 31, 2018
M e a s ure d M ine ra l R e s o urc e s Indic a t e d M ine ra l R e s o urc e s T o t a l M e a s ure d & Indic a t e d Inf e rre d M ine ra l R e s o urc e s
To nnes Grade Co ntained To nnes Grade Co ntained To nnes Grade Co ntained To nnes Grade Co ntained
G o ld (000's) (g/t) o z. (000's) (000's) (g/t) o z. (000's) (000's) (g/t) o z. (000's) (000's) (g/t) o z. (000's)
A lumbrera (12.5%) 6,792 0.39 85 1,917 0.54 33 8,709 0.42 118 848 0.46 13
A rco Sul 0 0.00 0 0 0.00 0 0 0.00 0 5,000 4.02 646
Canadian M alartic (50%) 1,885 1.36 83 13,615 1.80 786 15,500 1.74 869 36,210 1.99 2,319
Cerro M o ro 18 10.83 6 1,224 5.14 202 1,241 5.22 208 1,706 3.84 211
Chapada Zo nes 58,885 0.12 222 363,929 0.14 1,676 422,814 0.14 1,898 156,081 0.08 422
Suruca Zo nes 1,284 0.39 16 81,039 0.54 1,416 82,323 0.54 1,432 12,565 0.48 194
To tal Chapada 60,169 0.12 238 444,968 0.22 3,092 505,137 0.21 3,330 168,646 0.11 616
El P eñó n M ine 232 8.02 60 1,579 5.88 298 1,811 6.15 358 2,953 7.25 689
El P eñó n Tailings 0 0.00 0 0 0.00 0 0 0.00 0 13,767 0.55 245
El P eñó n Sto ckpiles 0 0.00 0 1,019 1.13 37 1,019 1.13 37 0 0.00 0
El P eñó n To tal 232 8.04 60 2,598 4.02 336 2,830 4.35 396 16,719 1.74 933
Jaco bina 24,999 2.48 1,994 15,711 2.45 1,238 40,710 2.47 3,232 12,145 2.58 1,008
Jero nimo (57%) 772 3.77 94 385 3.69 46 1,157 3.74 139 1,118 4.49 161
La P epa 15,750 0.61 308 133,682 0.57 2,452 149,432 0.57 2,760 37,900 0.50 620
Lavra Velha 0 0.00 0 0 0.00 0 0 0.00 0 3,934 4.29 543
M inera Flo rida 1,207 5.87 228 3,829 4.79 590 5,036 5.05 817 6,445 5.01 1,038
M o nument B ay 0 0.00 0 36,581 1.52 1,787 36,581 1.52 1,787 41,946 1.32 1,781
Suyai 0 0.00 0 4,700 15.00 2,286 4,700 15.00 2,286 900 9.90 274
T o t a l G o ld M ine ra l R e s o urc e s 111,8 2 3 0 .8 6 3 ,0 9 5 6 5 9 ,2 10 0 .6 1 12 ,8 4 9 7 7 1,0 3 3 0 .6 4 15 ,9 4 1 3 3 3 ,5 16 0 .9 5 10 ,16 2
A gua Rica 27,081 0.14 120 173,917 0.14 776 200,998 0.14 896 642,110 0.12 2,444
To nnes Grade Co ntained To nnes Grade Co ntained To nnes Grade Co ntained To nnes Grade Co ntained
S ilv e r (000's) (g/t) o z. (000's) (000's) (g/t) o z. (000's) (000's) (g/t) o z. (000's) (000's) (g/t) o z. (000's)
Cerro M o ro 18 1,253.0 707 1,224 381.2 14,997 1,241 393.5 15,704 1,706 257.8 14,139
El P eñó n M ine 232 194.6 1,450 1,579 207.1 10,512 1,811 205.4 11,962 2,953 254.8 24,190
El P eñó n Tailings 0 0.0 0 0 0.0 0 0 0.0 0 13,767 18.9 8,380
El P eñó n Sto ckpiles 0 0.0 0 1,019 28.8 942 1,019 28.8 942 0 0.0 0
El P eñó n To tal 232 194.6 1,450 2,598 137.1 11,454 2,830 141.8 12,904 16,719 60.6 32,570
M inera Flo rida 1,207 41.0 1,592 3,829 29.2 3,594 5,036 32.0 5,186 6,445 29.4 6,093
Suyai 0 0.0 0 4,700 23.0 3,523 4,700 23.0 3,523 900 21.0 575
T o t a l S ilv e r M ine ra l R e s o urc e s 1,4 5 7 8 0 .1 3 ,7 4 9 12 ,3 5 1 8 4 .5 3 3 ,5 6 8 13 ,8 0 7 8 4 .1 3 7 ,3 17 2 5 ,7 7 0 6 4 .4 5 3 ,3 7 7
A gua Rica 27,081 2.4 2,042 173,917 2.9 16,158 200,998 2.8 18,200 642,110 2.3 48,124
To nnes Grade Co ntained To nnes Grade Co ntained To nnes Grade Co ntained To nnes Grade Co ntained
C o ppe r (000's) (%) lbs (mm) (000's) (%) lbs (mm) (000's) (%) lbs (mm) (000's) (%) lbs (mm)
A lumbrera (12.5%) 6,792 0.37 55 1,917 0.24 10 8,709 0.34 65 848 0.21 4
Chapada Zo nes 58,885 0.20 261 363,929 0.22 1,765 422,814 0.22 2,025 156,081 0.23 781
Suruca Zo nes 0 0.00 0 0 0.00 0 0 0.00 0 0 0.00 0
To tal Chapada 58,885 0.20 261 363,929 0.22 1,765 422,814 0.22 2,025 156,081 0.23 781
T o t a l C o ppe r M ine ra l R e s o urc e s 6 5 ,6 7 6 0 .2 2 3 16 3 6 5 ,8 4 6 0 .2 2 1,7 7 5 4 3 1,5 2 2 0 .2 2 2 ,0 9 0 15 6 ,9 2 8 0 .2 3 785
A gua Rica 27,081 0.45 266 173,917 0.38 1,447 200,998 0.39 1,714 642,110 0.34 4,853
To nnes Grade Co ntained To nnes Grade Co ntained To nnes Grade Co ntained To nnes Grade Co ntained
Z inc (000's) (%) lbs (mm) (000's) (%) lbs (mm) (000's) (%) lbs (mm) (000's) (%) lbs (mm)
M inera Flo rida 1,207 2.22 62 3,829 1.63 138 5,036 1.77 197 6,445 1.32 187
T o t a l Z inc M ine ra l R e s o urc e s 1,2 0 7 2 .2 2 62 3 ,8 2 9 1.6 3 13 8 5 ,0 3 6 1.7 7 19 7 6 ,4 4 5 1.3 2 18 7
To nnes Grade Co ntained To nnes Grade Co ntained To nnes Grade Co ntained To nnes Grade Co ntained
M o lybde num (000's) (%) lbs (mm) (000's) (%) lbs (mm) (000's) (%) lbs (mm) (000's) (%) lbs (mm)
A lumbrera (12.5%) 6,192 0.014 1.94 462 0.013 0.13 6,654 0.014 2.07 85 0.014 0.03
T o t a l M o ly M ine ra l R e s o urc e s 6 ,19 2 0 .0 14 1.9 4 462 0 .0 13 0 .13 6 ,6 5 4 0 .0 14 2 .0 7 85 0 .0 14 0 .0 3
A gua Rica 27,081 0.049 29 173,917 0.037 142 200,998 0.039 172 642,110 0.034 480
BofAML Global Metals & Mining Conference 38Yamana Gold Inc. Mineral Reserve and Mineral Resource Reporting Notes:
1. Metal Price, Cut-off Grade, Metallurgical Recovery Jacobina Price assumptions: $1,250 gold. Price assumptions: $1500 gold.
Underground cut-off grade is 1.0 g/t gold
Mine Mineral Reserves Mineral Resources Underground cut-off grade is 1.20 g/t gold.
with a minimum mining width of 1.5 meters.
Metallurigical recovery is 96%. Metallurigical recovery is 96%.
Alumbrera Projects
(12.5%)
Jeronimo (57%) Price Assumption:$900 gold.
Price assumption: $1,250 gold, $2.91 Price assumption: $1,250 gold, $2.95 Cut-off grade at 2.0 g/t gold. Cut-off grade at 2.0 g/t gold.
Alumbrera Deposit
copper. copper. Metallurgical recovery for gold is 86%.
Underground cut-off at 0.5% copper Underground cut-off at 0.43% copper
equivalent. equivalent.
La Pepa N/A Price Assumption: $780 gold.
Metallurgical recoveries average 87.85% for
cut-off grade at 0.30 g/t gold.
copper and 72.31% for gold.
Bajo El Durazno Price assumption: $1,250 gold, $2.95 Lavra Velha N/A Price assumption: $1,300 gold and $3.50
N/A copper.
cut-off grade at 0.2g/t gold and 0.1%
Deposit copper.
0.74 g/t Aueq cutoff within underground copper.
economic envelope.
Minera Florida Price assumption: $1,250/oz gold, Price assumption: $1,250/oz gold,
Arco Sul N/A Price assumption: $1,500 gold. $18.00/oz silver and $1.25/lb zinc. $18.00/oz silver and $1.25/lb zinc.
2.5 g/t Au cutoff. Underground cut-offs for Las Petaguas Zone Underground cut-off grade is 2.50 g/t
USD90.75/t and for the Core Mine Zones gold.
Canadian Malartic USD94.79/t.
Price assumption: $1,200 gold. Price assumption: $1,200 gold. Metallurgical recoveries are 90.16% for Metallurgical recoveries are 90.16% for
(50%)
Cut-off grades range from 0.37 g/t Au gold, 52.31% for silver and 68.80% for gold, 52.31% for silver and 68.80% for
Open pit cut-off grades range from 0.374 to
inside pit to 1.0 g/t Au outside or below zinc. zinc.
0.384 g/t Au.
pit.
Underground Cut-off grade at Odyssey is Monument Bay N/A Price Assumption: $1,200 gold.
Metallurgical recoveries for gold range 1.15 g/t Au (stope optimized) and at East Cut-off grades are 0.4 g/t gold and 0.7
from 87% to 96.7% depending on zone. Malartic Underground is 1.25 g/t Au (stope
g/t gold for the open pits and 4.0 g/t gold
optimized).
for underground.
Price assumption: $1,250 gold and $18.00 Price assumption: $1,600 gold and $24.00
Cerro Moro Suyai N/A 5.0 g/t Au cut-off inside mineralized
silver. silver.
Open pit cut-off at 3.27 g/t gold and wireframe modeling.
3.0 g/t Aueq cut-off.
Underground cut-off at 5.71 g/t gold.
Metallurgical recoveries average 95% for Agua Rica Price assumption: $1,000/oz gold, $2.25/lb Cut-off grade at 0.2% Copper.
gold and 93% for silver. copper, $17.00/oz silver and $12.00/lb
molybdenum.
Metallurgical recoveries are 84.9% for
Chapada copper, 52.7% for gold, 67.6% for silver,
65.9% for zinc and 68.0% for molybdenum.
Price assumption: $1,250 gold, $3.00 Price assumption: $1,600 gold , $4.00
Chapada Zone
copper. copper.
Open pit cut-off at $4.06/t (Main Pit, Open pit cut-off at $4.06/t (Chapada pits 2. All Mineral Reserves and Mineral Resources have been calculated in accordance with the standards of the
Corpo Sul, Cava Norte and Sucupira). and Suruca SW). Canadian Institute of Mining, Metallurgy and Petroleum and NI 43-101, other than the estimates for the
Metallurgical recoveries at Chapada are Metallurgical recoveries at Chapada are Alumbrera mine which have been calculated in accordance with the JORC Code which is accepted under NI 43-101.
dependent on zone and average 83.11% for dependent on zone and average 83.11% for
copper and 56.94% for gold. copper and 56.94% for gold. 3. All Mineral Resources are reported exclusive of Mineral Reserves.
Suruca Zone Price assumption: $1,300 gold. Price assumption: $1,600 gold.
4. Mineral Resources which are not Mineral Reserves do not have demonstrated economic viability.
Cut-off grade 0.19 g/t gold for Suruca Cut-off grade 0.16 g/t gold for Suruca
oxide. oxide.
Cut-off grade 0.3 g/t gold for Suruca Cut-off grade 0.23 g/t gold for Suruca 5. Mineral Reserves and Mineral Resources are reported as of December 31, 2018.
sulfide. sulphide.
Metallurgical recoveries for Suruca oxide Metallurgical recoveries for Suruca oxide 6. For the qualified persons responsible for the Mineral Reserve and Mineral Resource estimates for Yamana's
average 85% for gold. average 85% for gold. material properties, see the qualified persons list below.
Metallurgical recoveries for Suruca Metallurgical recoveries for Suruca
sulphide average 88% for gold. sulphide average 88% for gold.
Property Qualified Persons for Mineral Reserves Qualified Persons for Mineral Resources
Price Assumption:$1,250 gold, $18.00 Price Assumption:$1,600 gold, $24.00
El Peñón
silver. silver. Sylvie Lampron, Canadian Malartic Pascal Lehouiller, P. Geo, OGQ, Canadian
Underground cut-off at 2.78 g/t gold Canadian Malartic
Corporation Malartic Corporation
Open Pit cut-off at 1.75 g/t gold equivalent except for Pampa Agusta Victoria
equivalent. (2.88 g/t), Chiquilla Chica (2.87 g/t),
Laguna (2.85 g/t ).
Underground cut-off ranging from 3.57 g/t and Fortuna-Dominador zones (2.84 g/t). Chapada Luiz Pignatari, EDEM Engenharia Felipe Machado de Araújo, Yamana Gold Inc.
gold equivelent to 3.70 g/t gold Mill recoveries of 95% and 86.5% used for
equevalent. Mineral Resource Estimation.
Mineral Resources contained in tailings and
Low grade stockpiles cut-off 0.95 g/t gold
stockpiles reported at cut-offs of 05.0 g/t El Peñón Sergio Castro, Yamana Gold Inc. Jorge Camacho, Yamana Gold Inc.
equivalent.
and 0.79 g/t gold equivalent respectively.
Metallurgical recoveries for open pit ores Metallurgical recoveries range from 87.2%
range from 89.0% to 95.6% for gold and to 99.0% for gold and from 59.8% to 92.6%
from 80.7% to 97.7% for silver. for silver.
Metallurgical recoveries for underground Metallurgical recoveries for tailings
ores range from 87.2% to 99.0% for gold estimated to be 60% for gold and 30% for
and from 59.8% to 92.6% for silver. silver.
Metallurgical recoveries for low grade Metallurgical recoveries forstockpiles
stockpiles are 95.2% for gold and83.0% estimated to be 88.0% for gold and 80.8%
for silver. for silver.
BofAML Global Metals & Mining Conference 1. As of December 31, 2018. 39You can also read