DTLA Preferred Shareholder Market Update Presentation
←
→
Page content transcription
If your browser does not render page correctly, please read the page content below

DTLA Preferred Shareholder
Market Update Presentation
DO W NTO W N LO S ANG E LE S
MAY 2 0 1 8
Disclosure

Forward-Looking Statements
This presentation contains “forward-looking statements” within the meaning of “safe harbor” provisions of the U.S. Private Securities Litigation Reform Act of 1995 (as set forth in
Section 27A of the U.S. Securities Act of 1933, as amended, and Section 21E of the Exchange Act). Forward-looking statements include statements that are predictive in nature,
depend upon or refer to future events or conditions, include statements regarding our operations, business, financial condition, expected financial results, performance, prospects,
opportunities, priorities, targets, goals, ongoing objectives, strategies and outlook, as well as the outlook for the Los Angeles market for the current fiscal year and subsequent
periods, and include words such as “expects,” “anticipates,” “plans,” “believes,” “estimates,” “seeks,” “intends,” “targets,” “projects,” “forecasts,” “likely,” or negative versions thereof
and other similar expressions, or future or conditional verbs such as “may,” “will,” “should,” “would,” and “could.”
Although Brookfield DTLA believes that its anticipated future results, performance or achievements expressed or implied by the forward-looking statements and information are
based upon reasonable assumptions and expectations, an investor should not place undue reliance on forward-looking statements and information because they involve known
and unknown risks, uncertainties and other factors, many of which are beyond its control, which may cause Brookfield DTLA’s actual results, performance or achievements to differ
materially from anticipated future results, performance or achievement expressed or implied by such forward-looking statements and information.
Factors that could cause actual results to differ materially from those contemplated or implied by forward-looking statements include, but are not limited to: risks generally incident to
the ownership of real property, including the ability to retain tenants and rent space upon lease expirations, the financial condition and solvency of our tenants, the relative illiquidity
of real estate and changes in real estate taxes, regulatory compliance costs and other operating expenses; risks associated with the Downtown Los Angeles market, which is
characterized by challenging leasing conditions, including limited numbers of new tenants coming into the market and the downsizing of large tenants in the market such as
accounting firms, banks and law firms; risks related to increased competition for tenants in the Downtown Los Angeles market, including aggressive attempts by competing
landlords to fill large vacancies by providing tenants with lower rental rates, increasing amounts of free rent and providing larger allowances for tenant improvements; the impact or
unanticipated impact of general economic, political and market factors in the regions in which Brookfield DTLA or any of its subsidiaries does business; the use of debt to finance
Brookfield DTLA’s business or that of its subsidiaries; the behavior of financial markets, including fluctuations in interest rates; uncertainties of real estate development or
redevelopment; global equity and capital markets and the availability of equity and debt financing and refinancing within these markets; risks relating to Brookfield DTLA’s insurance
coverage; the possible impact of international conflicts and other developments, including terrorist acts; potential environmental liabilities; dependence on management personnel;
the ability to complete and effectively integrate acquisitions into existing operations and the ability to attain expected benefits therefrom; operational and reputational risks;
catastrophic events, such as earthquakes and hurricanes; and the impact of legislative, regulatory and competitive changes and other risk factors relating to the real estate industry,
as detailed from time to time in the reports of Brookfield DTLA filed with the Securities and Exchange Commission (“SEC”).
Brookfield DTLA cautions that the foregoing list of important factors that may affect future results is not exhaustive. When relying on Brookfield DTLA’s forward-looking statements
or information, investors and others should carefully consider the foregoing factors and other uncertainties and potential events. Except as required by law, Brookfield DTLA
undertakes no obligation to publicly update or revise any forward-looking statements or information, whether written or oral, that may be as a result of new information, future events
or otherwise.
Further information regarding the important factors that could cause actual results to differ materially from forward-looking statements can be found in the risk factors that
Brookfield DTLA’s management believes are material to Brookfield DTLA that are set forth in Brookfield DTLA’s Annual Report on Form 10-K for the year ended December 31,
2017 and other reports that Brookfield DTLA has filed with the SEC. These risks and uncertainties are not the only ones facing Brookfield DTLA and there may be additional matters
that Brookfield DTLA is unaware of or that Brookfield DTLA currently considers immaterial. If any of those risks occur, Brookfield DTLA’s business, financial condition and operating
results could be harmed, the market value of the Series A preferred stock could decline and stockholders could lose part or all of their investment.

Market and Industry Data
This presentation includes estimates regarding market and industry data that Brookfield DTLA prepared based on its management's knowledge and experience in the markets in
which it operates, together with information obtained from various sources, including publicly available information and industry reports and publications. While Brookfield DTLA
believes such information is reliable, it cannot guarantee the accuracy or completeness of this information, Brookfield DTLA has not independently verified any third-party
information.
All information in this presentation is as of December 31, 2017 unless otherwise indicated.

                                                                                                                                                                                                2
Los Angeles Office Market Overview

                                     3
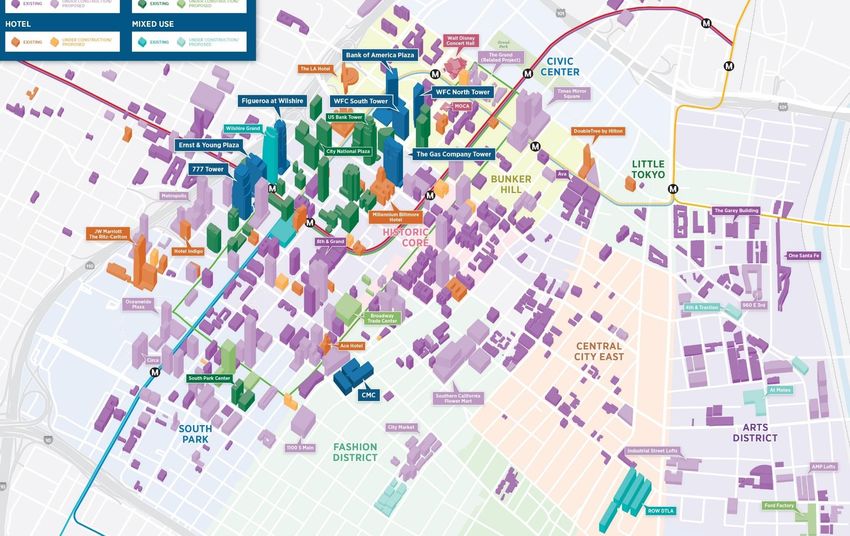
Greater Los Angeles Market Overview

          DOWNTOWN LA

                                      4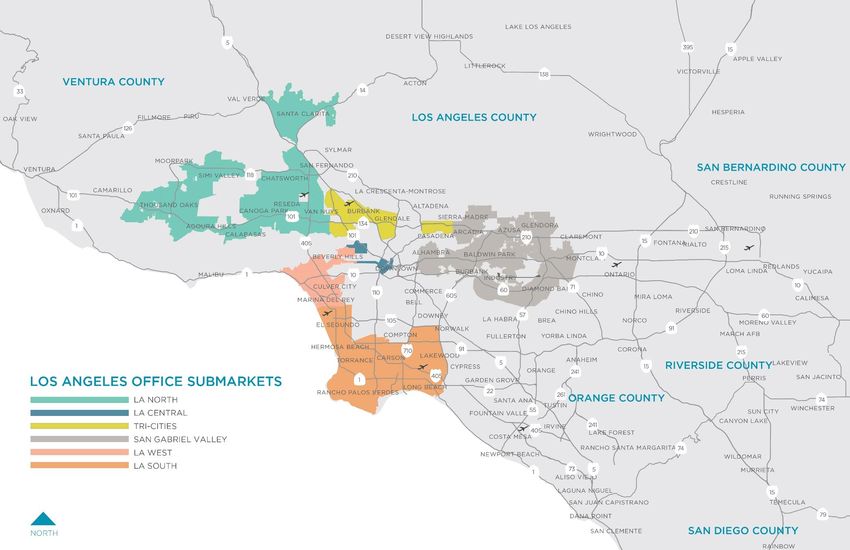
Greater Los Angeles Market Fundamentals

LOS ANGELES OFFICE MARKET STATISTICS – Q1 2018

                                                                                        CURRENT QTR YTD OVERALL     YTD                         OVERALL      OVERALL
                                                     SUBLET      DIRECT       OVERALL                                            UNDER
                                      INVENTORY                                         OVERALL NET     NET       LEASING                       AVERAGE      AVERAGE
SUBMARKET                                            VACANT      VACANT       VACANCY                                         CONSTRUCTION
                                         (SF)                                           ABSORPTION ABSORPTION     ACTIVITY                    ASKING RENT ASKING RENT
                                                       (SF)        (SF)         RATE                                              (SF)
                                                                                            (SF)        (SF)        (SF)                     (ALL CLASSES)* (CLASS A)*

Los Angeles Downtown CBD               27,574,918     208,761    5,639,317     21.2%      102,470     102,470     450,870          0             $3.52        $3.61

Los Angeles Downtown (Non-CBD)         8,639,116      18,106     1,882,009     22.0%       9,999       9,999      169,183        103,596         $3.68        $4.33

Mid-Wilshire                           11,634,043     24,233     1,692,774     14.8%      130,702     130,702     120,828        320,500         $2.65        $2.92

Los Angeles West                       53,176,527     525,732    6,209,992     12.7%      284,070     284,070     731,434       1,074,317        $4.64        $4.74

Los Angeles North                      31,418,737     85,306     3,886,870     12.6%      (206,235)   (206,235)   579,606        255,000         $2.48        $2.58

Los Angeles South                      31,114,917     421,331    5,134,084     17.9%      (114,592)   (114,592)   648,805        130,998         $2.66        $2.93

Tri-Cities                             24,303,894     567,658    2,769,163     13.7%      (181,644)   (181,644)   298,437        218,267         $2.98        $3.07

San Gabriel Valley                     12,535,067     16,423     1,841,151     14.8%       (3,674)     (3,674)    298,700          0             $2.18        $2.36

GREATER LOS ANGELES TOTALS 200,397,219               1,867,550   29,055,360    15.4%       21,096      21,096     3,297,863     2,102,678        $3.32        $3.60

*Rental rates reflect overall average gross asking $PSF/MO

 Source of Data: Cushman & Wakefield                                                                                                                            5
Downtown Los Angeles Market Overview

                                       6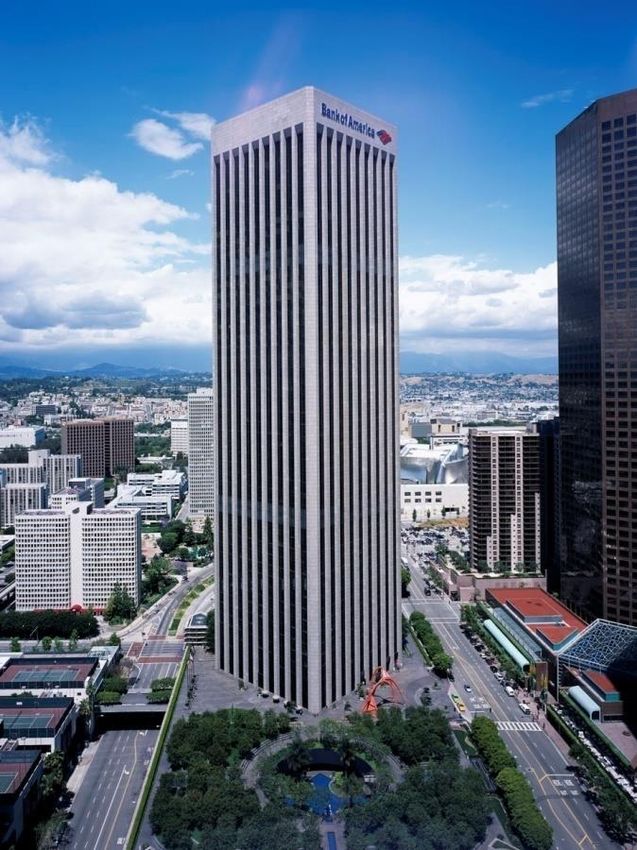
Downtown Los Angeles

                       7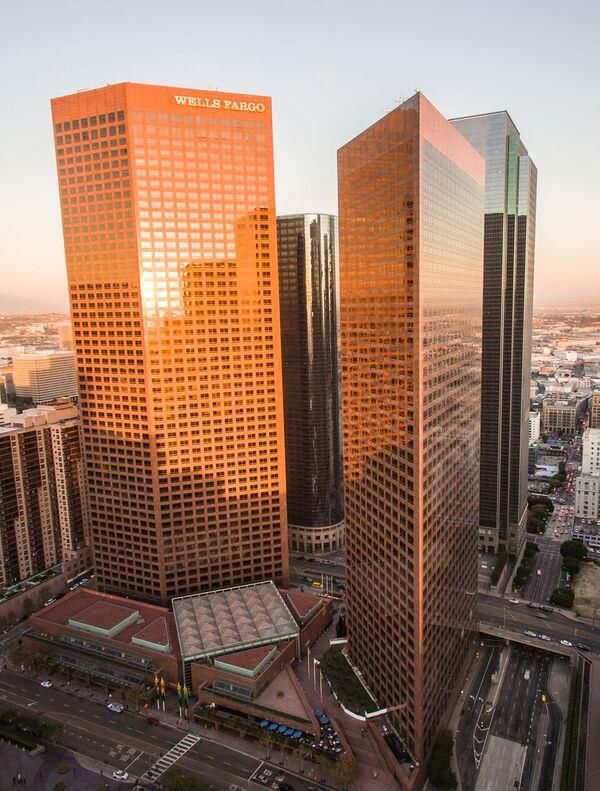
LA CBD Office Market Overview – Q1 2018

     Size:                 Total Market Size: 27.6 MM sq. ft.; Class "A" Market: 24.0 MM sq. ft.
                           The Class “A” market size decreased by approximately 650,000 sq. ft. due to the reclassification from Class “A” to Class “B” of
                           several smaller buildings.
     Vacancy:              Current Market Vacancy: 21.2% (Direct Vacancy 20.5%); Class "A" Market Vacancy: 21.7% (Direct Vacancy 20.9%)
                           The overall vacancy rate remained flat at 21.2%, while the Class “A” vacancy rate increased by 10 bps to 21.7% quarter-over-
                           quarter. The increase in Class “A” vacancy is primarily attributable to a correction in statistics over last quarter to account for the
                           move out of online retailer NastyGal; had it been accounted for last quarter when the move out occurred, Class “A” vacancy would
                           have also remained flat quarter-over-quarter.
     Leasing               Total Activity (current quarter): 450,870 sq. ft.; Year-to-Date Total: 450,870 sq. ft.
     Activity:             Leasing activity during the first quarter totaled 450,000 sq. ft., 8.5% stronger than the five-year historical quarterly average.
                           Notable leases executed during the first quarter include Dentons’ renewal of 62,000 sq. ft. at Figueroa at Wilshire (601 S.
                           Figueroa), Kirkland and Ellis’ new lease of 53,000 sq. ft. at City National Plaza (515 S. Flower), and Preferred Bank’s renewal and
                           expansion totaling 38,000 sq. ft. at Figueroa at Wilshire (601 S. Figueroa).
     Asking                Current Asking Rent: $42.23/sq. ft.; Class “A” Asking Rent: $43.32/sq. ft.
     Rents:                Overall gross asking rents finished the first quarter at $42.23 psf, a 2.9% year-over-year increase, with Class “A” asking rents
                           growing 4.4% over the same time period, closing the first quarter at $43.32 psf. While asking rents have increased, growth in
                           taking rents remains mild as competitive projects continue to be aggressive in order to improve their occupancy profiles.
     Economic              The Bureau of Labor Statistics reported the Los Angeles Metro unemployment rate as 4.5% as of February 2018, a year-over-
     Indicators:           year decline of 50 bps. Job growth is beginning to slow as the Greater LA economy is now operating very close to full
                           employment. Employment is expected to grow at an average annual rate of 0.7% over the next five years.
     12-Month Forward Outlook:                                Economy                                        Rent                                              Vacancy

           Market Vacancy (Direct)                                                                           Major Sales Transactions (1)
                                                                    10-Yr. Avg. Vacancy: 18.2%
          25.0%
                                                                                                                   •   Wedbush Building – 1000 Wilshire (476,491 sq. ft.): Acquired
          20.0%                                                                                                        by Cerberus Capital Management from Lincoln Property Co. for
          15.0%                                                                                                        $196.0MM, or $412/sq. ft.
                                                                                                     20.5%
                                                                     21.2%

                                                                             20.7%
                                                            19.9%

                                                                                             19.5%
                                                                                     19.5%
                                                    18.1%

          10.0%
                                            16.0%
                                    14.7%
                   12.7%

                            12.1%

           5.0%
           0.0%

                                                                                                             (1)   All sales transactions reflect 100% valuation

Source of Data: Cushman & Wakefield (real estate metrics); Bureau of Labor Statistics                                                                                                 8
LA CBD Office Market Statistics – Q1 2018

                                         LA CBD │ Office Market Statistics │ Q1 2018

                                             Current Qtr           YE 2017             YE 2016   YE 2015

     Size of Market (‘000 sq. ft.)

        Overall                                  27,575             27,575              27,105    27,077

        Class A                                  24,003             24,653              24,073    24,288

     Vacancy

        Overall                                   21.2%              21.2%              20.4%     19.6%
        Class A                                   21.7%              21.6%              20.7%     20.3%

     Net Absorption (YTD)

        Overall                                 102,470            176,730              91,556   238,987
        Class A                                 124,359            178,316             115,792   180,614

     Asking Rates (Gross)

        Overall                                  $42.24             $42.36              $40.50    $38.64

        Class A                                  $43.32             $42.96              $40.87    $39.37

   Source of Data: Cushman & Wakefield

                                                                                                           9
Greater LA – Major Sales Transactions

  SALE                              YEAR       %                    SALE         PRICE    CAP
          PROPERTY                                      RSF                                    BUYER                             SELLER
  DATE                              BUILT    LEASED                 PRICE         PSF     RATE

Downtown (LA CBD)
 Q1 2018 Wedbush Building           1987      86%     476,491     $196,000,000   $411     4.8%   Cerberus Capital Management     Lincoln Property Company
         1000 Wilshire

Q2 2017 One Cal Plaza               1985      87%     1,039,449   $459,000,000   $442     5.3%   Rising Realty / Colony Northstar Beacon Capital Partners
        300 S. Grand

Q2 2016 CBRE Tower                  1982      89%     701,535     $313,636,000   $447     4.9%   PNC Financial Services Group    CBRE Global Investors Ltd
        400 S. Hope

Q4 2016 Citigroup Center            1981      75%     891,056     $336,000,000   $377     4.6%   Coretrust Capital Partners      Hines
        444 S. Flower

Mid-City / Wilshire
Q4 2017 5670 Wilshire Blvd          1965      96%     445,004     $210,063,000   $472     5.5%   Rockpoint Group                 Blackstone
West LA
Q3 2017 Arboretum Courtyard         1999      88%     139,103     $140,625,000   $1,011   4.0%   Tishman Speyer                  Blackstone
        2120 Colorado Ave

Q2 2017 1999 Avenue of the Stars    1990      84%     825,200     $860,000,000   $1,042   4.0%   JMB Finanical                   Blackstone

South Bay
 Q4 2017 Pacific Corporate Towers   1982 /    88%     1,588,089   $605,454,000   $381     5.1%   Starwood Capital Group          BlackRock
         222 N Sepulveda Blvd        1996

Source of Data: JLL

                                                                                                                                                             10
DTLA Portfolio Overview
• BANK OF AMERICA PLAZA
• WELLS FARGO CENTER – NORTH TOWER
• WELLS FARGO CENTER – SOUTH TOWER
• GAS COMPANY TOWER
• 777 TOWER
• EY PLAZA
• FIGat7th
11Bank of America Plaza
Property Overview
Property Address: 333 S. Hope Street
Stories: 55
Total SF: 1.41 million sq. ft.
Parking Spaces: 2,242
Occupancy (as of Q4 2017): 93.5%
Availability (as of Q4 2017): 91,764 sq. ft.
Year Built: 1974
Major Tenants: The Capital Group Companies,
Sheppard Mullin, Bank of America,
Alston + Bird
Bank of America Plaza, located on Bunker Hill, is situated on a 4.21-acre site that features a unique formal garden, public art,
and two 24-foot waterfalls. The 2017 TOBY award-winning building is the only building with direct access to the Harbor
Freeway (I-110) via 4th Street, and there is a nine-level parking garage beneath the building’s concourse. Unique tenant
amenities include a 196-seat auditorium and bike storage area with shower facilities for tenant use. The Capital Group is the
largest tenant, leasing 324,000 sq. ft. through February 2033.
12Wells Fargo Center – North Tower
Property Overview
Property Address: 333 S. Grand Avenue
Stories: 54
Total SF: 1.40 million sq. ft.
Parking Spaces: 1,388
Occupancy (as of Q4 2017): 85.0%
Availability (as of Q4 2017): 210,144 sq. ft.
Year Built: 1982
Major Tenants: Gibson Dunn, Wells Fargo Bank,
Oaktree Capital, Winston & Strawn
The North Tower is part of Wells Fargo Center, which includes the South Tower and a retail atrium with restaurant and sundry
amenities. The building offers efficient 25,500 sq. ft. floor plates. An extensive lobby and common corridor renovation was
completed in Q2 2017, and a $61.3 million renovation of the retail atrium and plaza is underway with completion scheduled in
mid 2019. Gibson Dunn has leased 269,000 sq. ft. through November 2022, and Wells Fargo Bank has leased 270,000 sq. ft.
through June 2023.
13Wells Fargo Center – South Tower
Property Overview
Property Address: 355 S. Grand Avenue
Stories: 45
Total SF: 1.12 million sq. ft.
Parking Spaces: 1,607
Occupancy (as of Q4 2017): 76.8%
Availability (as of Q4 2017): 261,283 sq. ft.
Year Built: 1983
Major Tenants: Latham & Watkins, Morgan Lewis &
Bockius LLP, Reed Smith, State of
California
The South Tower is part of Wells Fargo Center, which includes the North Tower and a retail atrium that provides sundry and
restaurant amenities. A $61.3 million renovation of the retail atrium and plaza is underway with completion scheduled in mid
2019. Latham & Watkins is the largest tenant, leasing 265,000 sq. ft. through August 2025.
14The Gas Company Tower
Property Overview
Property Address: 555 W. Fifth Street
Stories: 50
Total SF: 1.35 million sq. ft.
Parking Spaces: 2,444
Occupancy (as of Q4 2017): 90.0%
Availability (as of Q4 2017): 135,053 sq. ft.
Year Built: 1991
Major Tenants: Southern California Gas Company,
Sidley Austin, Deloitte LLP, Latham &
Watkins, WeWork
The building is anchored by the Southern California Gas Company, who has leased 410,000 sq. ft. through October 2026. The
building offers large, efficient floor plates (26,000 sq. ft.) and close proximity to the Pershing Square metro station. Deloitte has
leased 112,000 sq. ft. through January 2031 with building top signage rights, and WeWork has leased 92,000 sq. ft. through
June 2033. An extensive renovation of the main lobby was completed in Q2 2017, including the creation of an outdoor amenity
space.
15777 Tower
Property Overview
Property Address: 777 S. Figueroa Street
Stories: 52
Total SF: 1.02 million sq. ft.
Parking Spaces: 1,057
Occupancy (as of Q4 2017): 84.5%
Availability (as of Q4 2017): 158,443 sq. ft.
Year Built: 1991
Major Tenants: Orrick, Arnold & Porter, National
Union Fire Insurance, Zurich
American Insurance Company
The building is conveniently situated adjacent to EY Plaza, the FIGat7th retail center, and the 755 Figueroa land parcel (Phase
III). Within walking distance to L.A. Live and the flourishing South Park district, the building has become increasingly desirable
as a result of the surrounding area’s redevelopment. A building top signage opportunity exists for potential anchor tenants.
Marsh USA vacated 86,000 sq. ft. in April 2018, while Orrick recently renewed approximately 66,000 sq. ft. lease through August
2022.
16EY Plaza
Property Overview
Property Address: 725 S. Figueroa Street
Stories: 41
Total SF: 911,000 sq. ft.
Parking Spaces: 2,444
Occupancy (as of Q4 2017): 87.9%
Availability (as of Q4 2017): 110,527 sq. ft.
Year Built: 1985
Major Tenants: Ernst & Young, US Secret Service,
Lockton Insurance Brokers,
Pillsbury LLP, Jackson Lewis LLP
The office tower is situated on a recently renovated, 2.5-acre, open-air plaza that sits across from one of the busiest Metro
stations in Los Angeles. The TOBY award-winning building is LEED EB:OM Platinum certified and within walking distance from
the Staples Center, L.A. Live, and many other cultural venues. Ernst & Young is the largest tenant, leasing 121,000 sq. ft.
through October 2032.
17FIGat7th
Property Overview
Property Address: 735 S. Figueroa Street
Stories: 3
Total SF: 314,000 sq. ft.
Parking Spaces: Allocated from EY Plaza garage
Occupancy (as of Q4 2017): 91.1%
Availability (as of Q4 2017): 28,049 sq. ft.
Year Built: 1986 (redeveloped in 2012)
Major Tenants: Target, Gold‘s Gym, Zara, H&M,
Nordstrom Rack, Victoria‘s
Secret
FIGat7th is an outdoor shopping and dining destination, with retailers, restaurants and business services. The retail center
completed a $40 million redevelopment in 2012, bringing boutique versions of signature, chef-driven concepts to its collection of
eateries, known as TASTE, and coveted retail anchored by Target. The retail center sits adjacent to one of the busiest
intersections in Los Angeles, with pedestrian traffic of up to 20,000 people per hour at the corner of Figueroa and 7th Street. Both
Zara and H&M opened their flagship locations here, joining other notable retailers such as L’Occitane, Victoria's Secret, MAC,
Bath & Body Works, Sunglass Hut and LensCrafters. The highly anticipated opening of Nordstrom Rack occurred in October
2017, to much excitement from Downtown residents and employees alike.
18Lease Expiration Schedule
Total Currently
Property 2018 2019 2020 2021 2022 2023 2024 2025 2026 2027 2028+
Leasable Available
Bank of America Plaza 1,405,428 91,764 38,927 37,320 168,809 7,868 15,333 131,986 140,446 173,959 65,308 0 533,708
% of building 6.5% 2.8% 2.7% 12.0% 0.6% 1.1% 9.4% 10.0% 12.4% 4.6% 0.0% 38.0%
Wells Fargo North 1,400,639 210,144 27,469 39,141 14,322 84,772 297,438 286,222 26,637 10,557 20,083 59,154 324,700
% of building 15.0% 2.0% 2.8% 1.0% 6.1% 21.2% 20.4% 1.9% 0.8% 1.4% 4.2% 23.2%
Wells Fargo South 1,124,960 261,283 82,234 31,373 47,529 20,074 147,676 94,918 0 265,843 27,108 0 146,922
% of building 23.2% 7.3% 2.8% 4.2% 1.8% 13.1% 8.4% 0.0% 23.6% 2.4% 0.0% 13.1%
Gas Company Tower 1,345,163 135,053 32,729 118,032 12,554 72,790 38,257 15,621 175,962 47,223 405,848 15,921 275,173
% of building 10.0% 2.4% 8.8% 0.9% 5.4% 2.8% 1.2% 13.1% 3.5% 30.2% 1.2% 20.5%
777 Tower 1,024,835 158,443 193,986 89,369 63,940 90,321 118,560 211,117 6,036 46,177 0 6,035 40,851
% of building 15.5% 18.9% 8.7% 6.2% 8.8% 11.6% 20.6% 0.6% 4.5% 0.0% 0.6% 4.0%
EY Plaza 910,610 110,527 73,232 61,983 18,463 115,215 41,734 131,662 15,701 132,146 29,167 31,234 149,546
% of building 12.1% 8.0% 6.8% 2.0% 12.7% 4.6% 14.5% 1.7% 14.5% 3.2% 3.4% 16.4%
FIGat7th 314,357 28,049 2,079 4,749 2,482 34,811 10,430 7,045 53,178 45,096 819 27,330 98,289
% of building 8.9% 0.7% 1.5% 0.8% 11.1% 3.3% 2.2% 16.9% 14.3% 0.3% 8.7% 31.3%
TOTAL SQ. FT. 7,525,992 995,263 450,656 381,967 328,099 425,851 669,428 878,571 417,960 721,001 548,333 139,674 1,569,189
% of portfolio 13.2% 6.0% 5.1% 4.4% 5.7% 8.9% 11.7% 5.6% 9.6% 7.3% 1.9% 20.9%
Data as of Q4 2017
19Financing
Face
Effective
Building Amount Maturity 2018 2019 2020 2021 2022+
Rate
(000’s)
Ernst & Young Plaza[1] $265,000 4.23% Nov 2020 $265,000
FIGat7th $59,000 3.88% Feb 2023 $59,000
777 Tower $220,000 3.55% Nov 2018 $220,000
Wells Fargo Center-
$250,000 5.39% Dec 2018 $250,000
South Tower[2]
Wells Fargo Center –
$470,000 4.38% Apr 2019 $470,000
North Tower[2]
Gas Company Tower $450,000 4.35% Aug 2021 $450,000
Bank of America Plaza $400,000 4.05% Sep 2024 $400,000
TOTAL $470,000 $470,000 $265,000 $450,000 $459,000
[1] Represents a $230 million floating rate loan swapped to fixed at an all in 3.90%. Junior loan of $35 million bears interest at LIBOR + 4.55%.
[2] This loan has three (3) one-year extension options
202018 Plan – Cash Flow Summary
2018 Cash Flow Summary
Ernst & Young Fig At 7th Bank of America 777 Tower Gas Company Tower Wells Fargo South Wells Fargo North 755 Figueroa Corporate Total DTLA
Net Operating Income
Commercial Property Revenue 32,704,204 9,692,612 53,083,476 30,243,705 47,303,117 32,462,750 43,330,301 - - 248,820,165
Parking Revenue 4,801,970 1,475,218 8,314,194 3,145,210 7,698,630 4,885,238 6,620,595 - - 36,941,055
Operating Expenses (19,587,843) (7,330,802) (27,372,516) (18,163,192) (25,433,821) (19,632,987) (24,639,805) (299,786) - (142,460,753)
Commercial Property NOI - cash 17,918,331 3,837,028 34,025,154 15,225,723 29,567,926 17,715,000 25,311,090 (299,786) 143,300,468
Lease Termination Income - - - - - - - - - -
Total Commercial Property NOI 17,918,331 3,837,028 34,025,154 15,225,723 29,567,926 17,715,000 25,311,090 (299,786) - 143,300,468
Other Revenue 61,013 311,855 308,227 50,400 108,421 295,090 176,492 - - 1,311,497
Total Income 17,979,344 4,148,883 34,333,381 15,276,123 29,676,348 18,010,090 25,487,582 (299,786) - 144,611,965
Commercial Property debt Interest (10,139,249) (2,301,325) (16,425,000) (7,831,694) (19,865,037) (13,202,944) (21,777,319) - - (91,542,569)
Other General and Administrative - - - - - - - - - -
General and Administrative - - - - - - - - (1,000,000) (1,000,000)
Asset Mgt Fee (816,316) (258,889) (1,366,373) (729,784) (1,234,842) (787,157) (1,117,541) - - (6,310,902)
Funds from Operations 7,023,779 1,588,669 16,542,008 6,714,645 8,576,468 4,019,989 2,592,721 (299,786) (1,000,000) 45,758,494
Net Income 7,023,779 1,588,669 16,542,008 6,714,645 8,576,468 4,019,989 2,592,721 (299,786) (1,000,000) 45,758,494
Cash Flow
Leasing Costs (14,263,340) (1,883,996) (4,815,995) (17,217,521) (16,799,883) (10,819,998) (20,685,094) - - (86,485,827)
Capital Expenditures (2,238,325) (220,000) (1,177,000) (1,926,175) (1,385,000) (27,166,206) (27,016,537) (6,036,000) - (67,165,243)
Cash Flow Before Financing (9,477,886) (515,327) 10,549,014 (12,429,051) (9,608,415) (33,966,215) (45,108,909) (6,335,786) (1,000,000) (107,892,577)
New Financing, Net 85,350,000 23,125,600 - (770,000) - 5,000,000 - - - 112,705,600
Principal Repayments (5,832,875) - - - - - - - - (5,832,875)
Cash Flow After Financing 70,039,238 22,610,273 10,549,014 (13,199,051) (9,608,415) (28,966,215) (45,108,909) (6,335,786) (1,000,000) (1,019,852)
21Hypothetical Liquidation Illustration
The table below sets forth an example of a partial distribution of cash that would be available in a hypothetical liquidation of the Company on December 31, 2017, effected by the
sale of all of the Company’s material real properties at their estimated fair market values as of that date. This information is being presented only for illustrative purposes and is not
a measure of financial performance, financial position or cash flows. This hypothetical liquidation as of December 31, 2107 would result in sufficient cash for a distribution in
accordance with the Company’s constituent documents from subsidiaries of the Company to the Company in an amount sufficient to redeem the Company’s Series A Preferred
Stock (which would include the accrued and unpaid dividends). The example does not represent an actual transaction and is presented solely for illustration of the outcome under
the constituent agreements currently governing the Company and its subsidiaries. This example is qualified in all respects by reference to, and should be read in conjunction with,
the definitive agreements for the Company’s constituent agreements, all of which have been publicly filed by the Company with the SEC as exhibits, and to all of the Company’s
other filings with the SEC, as well as the risks that may impact the Company’s future performance and financial performance as set forth under “Forward-Looking Statements”
above.
The Company has no current intent, and it has no obligation to liquidate now or at any time in the future. The Company has no current intent, and has no obligation to redeem or
pay dividends on the Company Series A Preferred Stock. The ability of the Company to redeem the Company Series A Preferred Stock, or pay dividends to the holders thereof, is
subject to certain limitations contained in the Company’s charter and the legal availability of funds under Maryland law. If full cumulative dividends on the Company Series A
Preferred Stock for all past dividend periods and the then current dividend period have been or contemporaneously are declared and paid in cash or declared and a sum sufficient
for the payment thereof in cash is set apart for payment, the Company has the right to pay dividends in cash or other property on its shares of Common Stock or to redeem,
purchase or otherwise acquire for any consideration, or make any other distribution of cash or other property, directly or indirectly, on or with respect to, any Common Stock. The
common shareholders of the Company and Brookfield DTLA Holdings LLC each has the right at any time to sell or otherwise transfer any or all of its respective interest in the
Company or its subsidiaries, without effecting a sale or other disposition of any of the Company’s real properties at any time. Any of these sales or other disposition may be made
in a manner that would not result in the receipt of proceeds by the Company or its subsidiaries or result in the repayment, in whole or in part, of the Company’s Series A Preferred
Stock. The Company has the right to amend, modify or supplement the constituent documents of the Company or its subsidiaries (or make elections under those documents) or
enter into transactions in connection with the operations of the Company or its subsidiaries that may have the effect of reducing the amount of cash available to pay dividends on, or
to pay the liquidation preference of, the Company’s Series A Preferred Stock; however, the Company cannot amend, alter or repeal (or cause to be amended, altered or repealed)
the provisions of its charter so as to materially and adversely affect any right, preference, privilege or voting power of the Series A Preferred Stock. This type of change to the terms
of the Series A Preferred stock would require the affirmative vote or consent of holders of two-thirds of the shares of the Series A Preferred Stock. The Company does not intend to
provide additional examples of hypothetical liquidations in the future.
22Hypothetical Liquidation Illustration
Brookfield DTLA Fund Office Trust Investor Inc.
Capital Structure
December 31, 2017 (000's)
Estimated gross real estate value [1] $3,623,000
Mortgage debt [2] -2,002,000
Net working capital -8,870
Net value $1,612,130
Hypothetical Liquidation Waterfall:
New OP Senior B interest (preferred portion) 190,291
DTLA Fund Properties III LLC Senior Participating Interest [3] 1,021
(held by Brookfield DTLA Holdings LLC )
191,312
$1,420,818
New OP Series A Interest - preferred portion [4] 391,400
New OP Series A1 Interest - preferred portion [5] 363,207
754,607
Remaining cash $666,211
Based on Management’s internal estimate, before deduction for all cost costs of sale, including brokerage, marketing, transfer taxes, and
[1]
other professional fees.
[2] Excludes all prepayment or defeasance costs that may be due upon repayment.
[3] Senior
component was previously repaid. Represents a 4% residual interest held by Brookfield DTLA Holdings LLC in Brookfield DTLA Fund
Properties III LLC which owns 333 South Hope Street, 725 and 735 South Figueroa Street.
[4] Liquidation
preference of $ 243.3 million, plus accrued and unpaid dividends of $ 148.1 million in partial redemption of the New OP Series A
Interest. The amount redeemed is in an amount sufficient to redeem all of the Company's Series A Preferred Stock.
[5] Liquidation
preference of $225.7 million, plus accrued and unpaid dividends of $137.5 million in partial redemption of the Series A1 Preferred
Interest. The portion redeemed is pro rata with the partial redemption of the New OP Series A Interest.
23Organization Chart
The following chart sets forth the structure of the Company and its subsidiaries:
Leg en d
BROOKFIELD DTLA = Brookfield DTLA Holdings LLC Notes:
DTLA HOLDINGS = DTLA Fund Holding Co. (1) Issued to former holders of MPG Preferred Stock that did not
COMPANY = Brookfield DTLA Fund Office Trust Investor Inc. tender shares in the Tender Offer.
SURVIVING CORPORATION = Brookfield DTLA Fund Office Trust Inc. (2) Issued to DTLA Holding in exchange for the shares of MPG
PROPERTIES HOLDING INC. = Brookfield DTLA Fund Properties Holding Inc. Preferred Stock purchased in the Tender Offer.
SURVIVING LLC = MPG Office, L.P. (to be converted into an LLC) (3) Managing Member of Surviving LLC.
NEW OP = Brookfield DTLA Fund Properties II LLC (4) Managing Member of New OP.
DTLA OP = Brookfield DTLA Fund Properties III LLC (5) Entitled to 4% of the DTLA OP common distributions after payment
of Senior Participating Preferred Interest.
BROOKFIELD (6) Entitled to the balance of the DTLA OP common distributions after
PREFERRED
DTLA payment of Senior Participating Preferred Interest, subject to
SHAREHOLDERS adjustment based on the results of the Tender Offer.
(7) There is $190,291 thousand outstanding (including return thereon)
Common
Stock outstanding on the New OP Series B Interest, as of 12/31/2017,
Common
Series A
Preferred
Stock and further amounts could be advanced in the future. Entitled to
Stock DTLA share in common distributions from New OP, as specified in the
[7.625%] (1) HOLDING
Series A
definitive filed documents.
Common
Preferred
Stock (8) New OP Series A Interest and New OP Series A1 Interest are
Stock
COMPANY entitled to distributions pari passu with each other and only if
[7.625%] (2)
New OP Senior Participating
there is then no outstanding balance on the preferred portion of
Common Stock and PROPERTIES Series B Preferred Int erest [7]%(5) the New OP Series B Interest (or return thereon). Entitled to share
HOLDING INC. Int erest
Series A Preferred Stock [7.625%]
(7) in common distributions from New OP, as specified in the definitive
filed documents.
SURVIVING
(9) Managing Member of DTLA OP.
CORPORATION (3)
New OP (10) All REITs have accommodation preferred shareholders holding
Series A1
Int erest preferred stock having approximately $125,000 of liquidation
Common Interest and [7.625%]
(8)
preference. The accommodation preferred in the Company and
Series A Preferre d
Int erest [7.625%] Surviving Corporation is junior to the Company Series A Preferred
and the Surviving Corporation Series A Preferred, respectively,
SURVIVING (11) Please refer to the definitive filed documents for relevant terms of
LLC (4) New OP
Series A NEW OP (9)
each ownership interest.
Int erest
[7.625%](8)
DTLA OP
Common
Int erest (6)
Brookfield DTLA Brookfield DTLA Brookfield DTLA Brookfield DTLA Brookfield DTLA Brookfield DTLA
Brookfield DTLA Brookfield DTLA
333 South Grand 355 South Grand 777 South 4050/755 Inc. 725 South 333 South Hopa
555 West 5th REIT FIGAT7TH REIT
REIT (Wells
(Gas Co Tower)
REIT (KPMG Figueroa REIT (755 Fig and 4050 Figueroa REIT
(7th and Fig)
REIT (Bank of 24
Fargo Tower) Tower) (777 Tower) West) (E&Y Tower) America)Brookfield Properties © 2018
25You can also read