Ground-truth Analysis of California's Residential Sector aECI Trend
←
→
Page content transcription
If your browser does not render page correctly, please read the page content below
Ground-truth Analysis of California’s Residential Sector aECI Trend

      Authors:           Margaret Harper, Colin Sheppard, and Charles Chamberlin
                         Schatz Energy Research Center, Humboldt State University

      Project Managers: Yerina Mugica and Dale Bryk
                        Center for Market Innovation, Natural Resources Defense
                        Council

                                        May 2011
This report is one in a series of short ground-truth efforts that seek to understand historical non-transportation
residential sector energy consumption trends observed in state specific simulations using the proposed
Performance based State Efficiency Program (PSEP) metric.1,2 Initial simulations of the PSEP metric used
historical data to estimate the number of years that each state would have made progress with respect to
weather adjusted energy consumption intensity (aECI), where progress is defined as a downward slope over
the five year period that ends in the evaluation year. Over the period from 1985-2007, California would have
performed very well according to the PSEP methodology, with more progress years detected than any other
state (Figure 1).
This performance is not surprising, as California is the poster child for the use of effective energy efficiency
programs and policies. Based on their progressive energy efficiency policies and continued investment in
energy efficiency, California has ranked #1 on the ACEEE’s scorecard for four years in a row.3 Starting in
the mid-1970s, California began to focus on energy efficiency by founding the California Energy
Commission, and implementing a statewide energy building code and appliance standards. These standards,
coupled with R&D efforts towards efficient building and appliance technologies along with innovative
policies, such as decoupling some utility revenues from electricity sales, have clearly enabled California to
take advantage of their energy efficiency resource. These energy efficiency measures have helped the state
maintain a nearly level consumption of electricity per capita since the mid-1970s. Much research has
focused on explaining this impressive trend. This report further analyzes the important role of the decreased
consumption of natural gas in decreasing the state’s total residential energy consumption as measured by the
PSEP metric.
Figure 1. Map displaying the number of years from 1985-2007 that each state made progress in reducing aECI
1
Exploring Strategies for Implementing a Performance Based State Efficiency Program: State Energy
Consumption Metrics – Residential Sector Analyses, Colin Sheppard, Charles Chamberlin and Arne Jacobson,
Schatz Energy Research Center, Humboldt State University in collaboration with Yerina Mugica and Rick Duke, Center
for Market Innovation, Natural Resources Defense Council. Released: May 15, 2009.
For additional information on the PSEP metric:
SERC webpage: http://www.schatzlab.org/projects/psep/psep.php
NRDC webpage: http://www.nrdc.org/globalWarming/cap2.0/energybargain.asp
2
Unless otherwise stated, the energy data used in this report are from the Energy Information Agency of the U.S.
Department of Energy’s State Energy Data System (SEDS).
3
American Council for an Energy-Efficient Economy (ACEEE), “2010 State Energy Efficiency Scorecard,” Reviewed
October, 2010: http://www.aceee.org/sector/state-policy/scorecard.
2
ANALYSIS OF CALIFORNIA’S ADJUSTED ENERGY CONSUMPTION INDEX (aECI)
                             •                             California’s aECI has consistently declined over the period of 1985-2007, decreasing by nearly 10
                                                           MBtu per person over the 23-year period (Figure 2).4
                             •                             Though California only showed progress in 11 years, six other years had five-year slopes of adjusted
                                                           ECI that were slightly negative, but they did not pass the 80% significance test.

                             Figure 2. Adjusted ECI for California from 1985-2007 (above) and Slope of aECI vs. Year with single tailed
                             80% confidence intervals shown (below). In the upper graph, years without progress are indicated with gray
                             diamonds, years with progress that is not statistically significant are indicated with blue squares, and years with
                             statistically significant progress are indicated with green circles. In the lower graph, a progress year is indicated
                             when the upper bar of the 80% confidence interval falls below zero.5


4
 Throughout the report, MBtu represents one million Btu.

5
 The analysis of aECI trends presented in the figure uses state-specific moving average heat rates as described in the
PSEP revised methods. HDD and CDD calculations use data from the National Climatic Data Center (NCDC) and
                                                                                                                                                                                                                                                           3
ENERGY EFFICIENCY INITIATIVES
California’s exemplary history of energy efficiency policies offers one explanation for the state’s consistent
reduction in per capita energy use and strong performance in the PSEP metric. In the mid-1970s, the rising
price of oil and the OPEC oil embargo prompted California to begin implementing energy efficiency
measures.6 An initial response was the passage of the Warren-Alquist Act in 1974, which established the
California Energy Commission (CEC) and tasked the Commission with assessing trends in energy
consumption, forecasting future supplies and demands, conducting research and development in alternative
sources of energy and recommending new and expanded energy conservation measures.7 In 1975, the first
statewide building energy requirements were established by the Department of Housing and Community
Development for low-rise residential buildings.8 These regulations were soon followed in 1976 by the state’s
first appliance standards (Title 20) and in 1978 by a more inclusive and stringent building energy code: Title
24: Energy Efficiency Standards for Residential and Nonresidential Buildings.9,10 Both the state’s building
code and appliance code have been regularly updated with new standards published every two to three years,
with the most recent standards adopted in 2008 and 2009, respectively.11

Coupled with these increasingly stringent efficiency standards were innovative policies encouraging the
participation by the utility companies in developing and promoting energy efficient technology. Utilities,
universities, the CEC through its Public Interest Energy Research programs, and the US DOE all assisted
with research and development into more efficient appliances, such as electronic ballasts for fluorescent
lighting. This critical R&D proved the technical feasibility of new efficiency standards and enabled
manufacturers to produce new energy efficient products.6

Further, California had the foresight to realize that effectively promoting energy efficiency would require the
participation of the large investor owned utilities (IOUs). Unfortunately, the conventional business model
for a utility treats residential efficiency savings as a loss of sales, creating disincentives for the utilities to
support energy efficiency. A collaborative effort between the CEC, CPUC and NRDC developed the
concept of “decoupling,” or disconnecting, some of a utility company’s authorized revenues from their
energy sales by ensuring utilities will recover their fixed costs (no more and no less) regardless of their sales
levels through periodic rate adjustments. By 1982, both electric and natural gas utilities operated under
decoupled mechanisms.12 During this same period, researchers worked to prove to the utilities and the
legislature the potential of energy efficiency measures to mitigate the need for increased power generation,
transforming the concept of energy efficiency from a loss of sales to a least-cost way of meeting demand.
Thanks to this policy innovation, utilities have administered and implemented portfolios containing a number
of energy efficiency programs, including appliance rebates, direct installations, appliance early retirements,


assume a base temperature of 65˚F; while more accurate base temperatures and HDD and CDD which are regionally
differentiated on an annual basis would be preferable for the analysis, these data are not readily available.

6
  Much of California’s energy efficiency history is based on information presented in Rosenfeld, A.H., and D.
Poskanzer, “A Graph is Worth a Thousand Gigawatt-Hours: How California Came to Lead,” Innovations: Energy for
Change, MIT, vol. 4, issue 4, 2009, and in Martinez, S., D. Wang and J. Chou, "California Restores its Energy
Efficiency Leadership: Smart Policies Provide Enormous Economic and Environmental Benefits," NRDC White Paper,
March 9, 2010.

7
  CEC, “Warren-Alquist State Energy Resources Conservation and Development Act. Revised 2009,” Downloaded
September 2010: http://www.energy.ca.gov/reports/Warren-Alquist_Act/

8
  Building Codes Assistance Project, “Online Code Environment and Advocacy Network: California,” http://bcap-
ocean.org/state-country/california

9
  CEC, “California’s Appliance Efficiency Program,” http://www.energy.ca.gov/appliances/index.html

10
    CEC, “California’s Energy Efficiency Standards for Residential and Nonresidential Buildings,”
http://www.energy.ca.gov/title24/index.html

11
    CEC, “Archive of Building Energy Efficiency Standards,” http://www.energy.ca.gov/title24/standards_archive/

12

  Cavanagh, Ralph, “Graphs, Words and Deeds: Reflections on Commissioner Rosenfeld and California’s Energy
Efficiency Leadership,” Innovations: Energy for Change, MIT, vol. 4, issue 4, 2009.

                                                                                                                                                                                                                                                                                                                                                                                                                                                                                                                                                                                                                                                                                                                                                                                                           4
and low-income weatherization programs.13 These measures were reinforced by legislation, such as AB
1890 (1996), AB 995 (2000), SB 1037 (2005) and AB 2021 (2006), which established energy efficiency as a
priority resource.14 California also established a “loading order” for meeting new load on the California
electricity grid: utilities must first pursue all cost-effective efficiency resources, then aggressively pursue
renewable resources, then use cleaner and more efficient forms of fossil-based energy, and only after
exhausting these options may they turn to conventional energy sources to meet new load.15 Based on utility
estimates and CEC models, by 2007, utility programs were saving 120 million Therms of natural gas and
2,900 GWh of electricity in the residential sector each year.16,17
In addition to these innovations, starting in the mid-1970s, California has continually promoted low-income
weatherization and retrofits through the federal Weatherization Assistance Program (WAPTAC). In recent
years, California has been granted over $4 million annually in federal funding to implement low-income
retrofits.18
SAVINGS ESTIMATES
For the 2007 and 2009 demand forecasts, the CEC used models and reported utility savings to estimate the
historical electricity and natural gas savings from these energy efficiency measures (Figures 3 and 4).
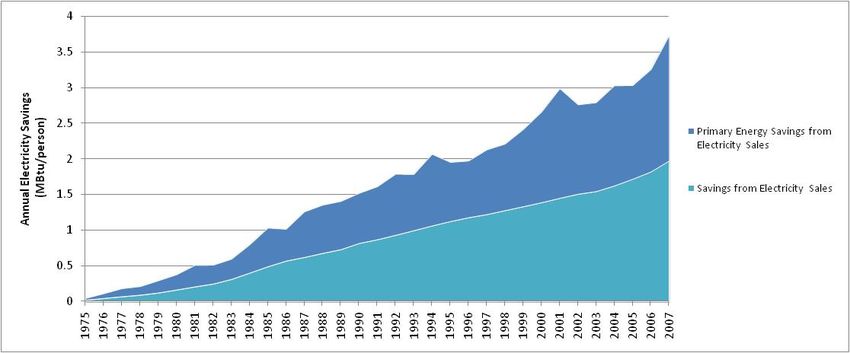
Figure 3. Estimated residential electricity savings from California’s building standards, appliance standards,
utility programs, retrofit programs and naturally occurring savings from 1975 to 2007 16,19
13
Bernstein, M., R. Lempert, D. Loughran and D. Ortiz, The Public Benefit of California’s Investments in Energy
Efficiency,” final report prepared for the CEC, March 2000.
14
Text of California legislation can be found on the Legislative Council’s website: ftp://leginfo.public.ca.gov/pub/.
15
The CEC and CPUC jointly adopted the California Energy Action Plan which establishes the loading order, at:
http://www.energy.ca.gov/energy_action_plan/index.html.
16
Data provided by Nicholas Fugate, Electricity Supply Analysis Division, CEC. The savings estimates are updated for
the 2009 forecast; data from 1990 on is published with the forecast at:
http://www.energy.ca.gov/2009publications/CEC-200-2009-012/. All savings are modeled estimates of cumulative
savings which include assumptions as to the persistence and decay of energy efficiency measures.
17
Martinez, Wang and Chou (Supra note 6) explore more fully the influence of deregulation and the 2000-2001
California energy crisis on utility program savings. As deregulation removed many of the incentives for utilities to
pursue energy efficiency measures, savings dropped sharply, only to recover after state policies were reenacted after the
energy crisis. After the state reinstated energy efficiency as a priority and reestablished the decoupling of utilities’
authorized fixed cost recovery from their sales, energy savings from utility programs exceeded historical levels.
18
WAPTAC, “Grantee Contacts: California,” http://www.waptac.org/Grantee-Contacts.aspx?dstate=CA#results and
Community Services and Development, “LIHEAP and DOE Fact Sheet 2008,” Downloaded September 2010:
“http://www.csd.ca.gov/Programs/Weatherization%20Assistance%20Program.aspx
19
Savings estimates are for electricity sales and do not include primary energy.
5
Figure 4. Estimated residential natural gas savings from California’s building standards, appliance standards,
                                                                                      16
utility programs, retrofit programs and naturally occurring savings from 1975 to 2007

In the residential sector, natural gas savings have historically resulted in the greatest energy savings, while
electricity savings have contributed less to energy savings. Note the scaling of the two graphs differ;
estimates of natural gas savings, which include savings from appliance standards, building standards, utility
programs, and miscellaneous retrofits are almost three times greater than those of electricity savings. The
large potential for natural gas savings is due to natural gas fueling the majority of California’s residential
space and water heating.

In addition to the savings estimated from the state’s building standards, appliance standards, utility programs
and weatherization retrofits, Figures 3 and 4 also include the CEC’s estimates of the naturally occurring
savings based on demand response to price. Typically, residential energy demand is not particularly
responsive to energy prices, resulting in only a small portion of the energy savings estimates being attributed
price influences.20

Substantial savings have resulted from utilities’ efforts. While in the early years these efforts showed greater
results in the non-residential sector, in recent years, utilities have expanded their residential programs to
demonstrate savings nearly equal to those realized in the non-residential sectors. 21 Though Figures 3 and 4
report savings from utility programs, they may underestimate the full benefit of these programs as they do
not account for the “spillover” benefits of utility programs, which can result in many times greater savings
than the reported savings.22


20
   According to an NREL study that estimated price-elasticities using a complex regression model, California’s
residential natural gas consumption is not an exception, with a short-term price elasticity of -0.098 and long-term price
elasticity of -0.132. Price elasticity in its simplest form is the percentage change in demand for a good divided by the
percentage change in price of the good. A good is said to be inelastic (not particularly responsive to changes in price)
when its elasticity is between zero and negative one. Goods with elasticities less than -1 are said to be elastic, or
responsive to changes in price. The study finds that residential electricity is similarly inelastic to changes in price.
Bernstein, Mark and James Griffon, “Regional Differences in the Price-Elasticity of Demand for Energy,” RAND
Corporation technical report prepared for NREL and US DOE, 2005.
21
   Rufo, M. and F. Coito, “California’s Secret Energy Surplus: The Potential for Energy Efficiency,” The Hewlett
Foundation Energy Series, September 23, 2002.
22
   According to Martinez, Wang and Chou (Supra note 6), utility programs “help transform markets to make efficiency
the norm rather than the exception and provide large “spillover” benefits. For example, by helping make efficient
products more prominent in stores, many people buy the efficient products without directly participating in utility
programs. In addition, the utilities play a critical role in readying the market and making the case for ever tighter state
and national efficiency standards, providing greatly magnified savings around the country. To provide just a few recent
examples, California utilities played a key role in: (i) path-breaking national lighting efficiency standards adopted by
Congress in December 2007 that will cut electricity needs for the nation’s four billion screw-in lightbulb sockets by
more than 60 percent by 2020; (ii) April 2008 upgrades to California’s building efficiency standards that will yield more
                                                                                                                                                                                                                                                6
RESIDENTIAL ENERGY CONSUMPTION BY FUEL TYPE
Distributing California’s per capita residential energy use by fuel type reveals that nearly all of the energy
used by California residents is in the form of either electricity or natural gas (Figure 5).23 Additionally,
Figure 5 illustrates that California’s downward trend in residential energy consumption can be partly
attributed to a consistent decrease in the consumption of natural gas, while consumption of electricity
remained relatively stable. To better understand these consumption patterns, the following sections examine
in more detail first residential electricity use over time and then natural gas use over time.

Figure 5. California’s per capita residential energy use distributed by fuel type. Historical trends in residential
energy use in the state are determined by the relatively flat trend of per capita electricity consumption and the
continually decreasing trend of per capita natural gas consumption.

ELECTRICITY ANALYSIS
California’s historical residential electricity sales differ substantially from sales in the other 49 states (Figure
6). The divergence of California’s trend from the national average starting in the early seventies coincides
with national energy crisis and the creation of the state’s original energy efficiency institutions and
initiatives.


than 500 MW of cost-effective savings by 2013, and (iii) the first-ever efficiency standards for digital televisions
California adopted in November 2009, which will cut consumption 30 to 50 percent from 2007 levels and will save
California almost $1 billion per year on electric bills.”
23
   The petroleum products, natural gas and electricity data used in this section of the report are not weather-adjusted.

                                                                                                                                                                                                                                                                                                                                                                                                                                                                                                                                                                                                                                                                                                                                                                                                           7
Figure 6. Residential sales of electricity in California (red) and the other 49 states (blue). Note these electricity
sales data do not include estimates of primary energy.

This relationship, referred to as the Rosenfeld Curve, demonstrates how California’s active energy efficiency
measures, in addition to other causal factors, affect consumption trends.24 By comparing characteristics that
affect residential energy consumption between California and the national average, Sudarshan estimates that
about 33% of the difference in residential electricity consumption can be explained by California’s energy
efficiency policies.25 In addition to the state’s strong energy efficiency policies, growth in California’s
residential electricity consumption is mitigated by California’s larger than average household size and
increasing household floor space, and residents’ apparent conservation ethic (all of which could be
influenced by energy efficiency policies and which might not be completely independent causes).25 Through
the state’s strong energy efficiency policies, California has maintained residential electricity consumption at
well below the national average, and electricity sales have only increased minimally, at a rate of less than
1MBtu/cap over the 33 year period, or approximately 0.03 MBtu/cap/year (Figure 7). When the primary
energy associated with electricity consumption is also considered, as it is in the PSEP metric, the trend of
total electricity consumption decreases slightly over the 33 year period. The following sections discuss a few
possible explanations for the gradual rise in electricity sales, such as the, increased penetration of air
conditioners and demographic shifts, and explains the discrepancy between the rise in sales and decrease in
total electricity consumption due to changes in the utilities’ grid mix.


24
     Note that the actual Rosenfeld Curve includes non-residential energy consumers and is therefore flatter and even
more impressive.
25

  Sudarshan, Anant “Deconstructing the Rosenfeld Curve: The Problem with Energy Intensities, USAEE, November
27, 2010. Available at:
http://papers.ssrn.com/sol3/Delivery.cfm/SSRN_ID1715860_code920036.pdf?abstractid=1715860&mirid=5. In this
study, the authors examined factors of household income, household size, household age profile, climate characteristics,
urbanization, housing unit floor space, housing unit age, household fuel choices and appliance use patterns.

                                                                                                                                                                                                                                                    8
Figure 7. Electricity consumption that includes primary energy as represented by the PSEP metric (red) and
electricity sales that do not include primary energy or transmission and distribution losses (green). The
trendline for each data set is based on the full 33-years of analysis.

Grid Mix
The PSEP metric differs from similar analyses in that it takes into consideration the primary energy
associated with electricity generation. Due to this inclusion, the trend in California’s residential electricity
consumption appears more variable than that represented by the electricity sales (Figure 7). Additionally,
this implies that changes in California’s grid mix could partially influence the trend of per capita electricity
consumption and the state’s performance in the PSEP metric.

California has a very diverse grid mix that initially relied heavily on petroleum products, natural gas, hydro
electric generation and nuclear generation. In the current PSEP metric, a heat rate of 1.0 is applied to
electricity generated from renewable sources and nuclear power (Figure 8). As California moved toward
more hydroelectric, biomass and nuclear generation, the average heat rate for the California grid mix
decreased dramatically.26 California has since continued to diversify its grid mix with the addition of more
energy from wind, waste, wood and solar PV. The data suggest that California’s per capita residential
electricity consumption is correlated with the state’s average annual heat rate (Figure 9). Both this linear
regression analysis and a visual comparison of the trend of reported electricity sales versus the trend of total
electricity consumption with the primary energy included, suggest that the majority of the fluctuation in
consumption is due to fluctuations in the state’s heat rate.


26
 An analysis and calculation of this heat rate can be found in the ground-truth report on Washington State on the PSEP
website: http://www.schatzlab.org/projects/psep/psep.php.

                                                                                                                                                                                                                                                    9
Figure 8. California’s generation grid mix by fraction of total electricity production and the associated
dimensionless heat rate.

Figure 9. Linear regression of the total per capita electricity consumption (including primary energy) and the
dimensionless heat rate. Changes in the heat rate explain approximately 88% of the change in the total primary
energy consumption due to electricity sales.

                                                                                                            10
AC Penetration
A potential driver of electricity consumption is the adoption of air conditioning. Based on data from the
Residential Energy Consumption Surveys (RECS), there has been a decrease and subsequent increase in air
conditioner penetration from approximately 48% to 58% from 1993 to 2005 (Figure 10).27,28 Using a rough
estimate, the increase in air conditioners alone would create an additional demand of 0.06 MBtu/cap/year per
year.29,30,31,32 Were the CDD and HDD being used to correct the PSEP metric up-dated to account for
population growth in hotter climates on a yearly basis, this increase might be partially accounted for. This
correction is necessary because the increase in AC penetration might not be independent from higher rates of
population growth and higher CDDs in the warmer climates of California.

The California Statewide Residential Appliance Saturation Study (RASS) suggests the number of homes
with central air conditioning is much greater than the estimate presented by RECS; 87.8% of the households
surveyed had at least one central air conditioning unit.33, 34 When compared to previous utility specific
residential appliance saturation studies, the 2004 RASS suggests a 35%-100% increase in air conditioning
saturation, depending on the service territory.35


27
   The Residential Energy Consumption Survey (RECS) database can be found at http://www.eia.doe.gov/emeu/recs/
28
   Assuming a sample size of 500 homes in CA and an average penetration of 53%, the 95% CI would run from 48.6%
to 57.4%, which almost matches the range of the observed values. Much of this variation could just be due to chance.
29
   With an average of 13M households in CA over the period from 1993-2005, assuming a 10% increase in AC
penetration, an estimate of the number of AC units added to the CA housing stock would be 1.3M, or ~325,000 per year
over twelve years. According to the EnergyStar AC Savings calculator, an AC unit with a Seasonal Energy Efficiency
Ratio (SEER) of 10 (the low end of efficiency ratings for that period) would consume about 1898 kWh/year. The
product of these figures divided by the average population of CA results in about 0.06 MBtu/cap increase in electricity
consumption per year.
30
   US Census bureau, “State and County Quickfacts,” downloaded June 2010:
http://quickfacts.census.gov/qfd/states/06000.html
31
   EnergyStar.gov. “Air Conditioning, Central Resources, Savings Calculator.” Downloaded March 2010:
http://www.energystar.gov/ia/business/bulk_purchasing/bpsavings_calc/Calc_CAC.xls
32
   RECS has a sample size of 468 households for CA; RASS has a sample size of 21,920, but was only conducted on a
statewide basis in one year. KEMA-XENERGY, “California Statewide Residential Appliance Saturation Study,” 2004.
Downloaded August 2010: http://www.energy.ca.gov/appliances/rass/
33
   KEMA-XENERGY, “California Statewide Residential Appliance Saturation Study,” 2004. Downloaded August
2010: http://www.energy.ca.gov/appliances/rass/
34
   Gilmore Research Group, “CA Statewide RASS,” 2004, pg 84. Downloaded August 2010:
http://www.energy.ca.gov/appliances/rass/
35
   Marshall, Lynn and Tom Gorin, California Energy Commission, “California Energy Demand 2008-2018 Staff
Revised Forecast,” 2004, pg 37. Downloaded August 2010: http://www.energy.ca.gov/electricity_analysis/index.html

                                                                                                                                                                                                                                                    11
Figure 10. Penetration of air conditioners in residential housing in California (Source: RECS)

In addition to the load growth due to air conditioners, the increased use of other electric appliances would
also contribute to the increased residential energy consumption. According to the RECS surveys, in the
Pacific region, use of electric appliances increased between 1980 and 2001, though at a slower rate than most
of the US for all appliances except personal computers.36 The witnessed growth in both air conditioner
ownership and appliance use makes California’s relatively flat trend more impressive, and may help explain
the gradual increase in electricity consumption.

Age Distribution
Additionally, a demographic shift, particularly an increase in the population’s average age, can increase per
capita residential energy use. The slight increase in the average age of California’s population is similar to
that of most states, and can therefore not be used to explain any difference between California’s energy
consumption and the average US energy consumption.

Though California is not anomalous to the rest of the country in terms of changes in the population’s age
distribution, the effect of the aging population on the ECI is moderate. The RECS data suggests that changes
in the age distribution of the state could result in a 2.5% increase in the aECI (Figure 11). Assuming the
electricity load grows at the same rate as the total aECI, this underlying load growth would result in an
increase in residential electricity consumption of approximately 0.05 MBtu/cap/year, which is similar to the
growth attributed to the increased penetration of air conditioners.

This effect is outside the influence of energy policy makers, and it may therefore be reasonable to correct the
ECI trend to account for demographic changes in age distribution within a state. An initial analysis indicated
that the effect was small in most states and that the demographic age shifts were similar from state to state
following a trend that is consistent with an aging baby boom generation. A correction for the age distribution
effect has not yet been incorporated into the PSEP method, but it may be included in a future version of the
metric.


36
 These figures are reported in the eia’s Regional Energy Profile Pacific Appliance Report, 2001 and based on the
RECS data: http://www.eia.doe.gov/emeu/reps/appli/pacific.html .

                                                                                                                                                                                                                                                    12
Figure 11. Distribution of California citizens by age; the relationship between age and dimensionless ECI based
on analysis of RECS 2005 data set demonstrated that from 1990-2007, ECI in CA would have increased by
~2.5% entirely due to shifts in the age of the state’s population.


NATURAL GAS ANALYSIS
On average, consumption of natural gas has decreased nationwide, due to appliance efficiency gains,
improved housing construction, utility efficiency programs, and an increase in the share of natural gas
customers who do not use natural gas as their primary space heating fuel.37 California’s residential
consumption of natural gas has decreased at an even greater rate, despite the fact that the use of natural gas
appliances has increased in the state (Figure 12).

Figure 12. Residential natural gas consumption in California (red) and the other 49 states (blue).


37
   Alic, Lejla, “Trends in U.S. Residential Natural Gas Consumption,” Energy Information Administration, Office of
Oil and Gas, June 2010.

                                                                                                                                                                                                                                                           13
Even though California boasts a relatively low per capita consumption of natural gas, it is still the most
common heating fuel in the state. According to the RECS data, Californians have increasingly adopted
natural gas appliances for both space and water heating (Figure 13).

Figure 13. Types of heating fuel used in California (Data source: RECS)

In 2005, approximately 70% of survey respondents used natural gas to heat their homes, while only
approximately 23% used electricity. The RASS surveys support the high saturation of natural gas for both
space and water heating in California, suggesting 77.5% of households use natural gas, while only 10.7% of
households use electricity as their primary space heating fuel and 78.6% of households use natural gas as
their primary water heating fuel. These trends strongly contradict the clear decrease in natural gas
consumption and the recent increase in electricity consumption.

Just as with electricity consumption, much of these additional savings are the direct result of energy
efficiency measures taken by the state and the utility companies, such as building codes, appliance standards
and efficiency programs. In 2007, building codes alone were estimated to have saved approximately 5-8% of
the total residential electricity consumption (a cumulative savings of approximately 0.4 MWh/person from
1990-2007).38 In addition to the savings that can be attributed to building codes, California’s greater than
average household size may play a role in decreasing the state’s energy consumption.

On average, larger households consume less energy per capita than do smaller households as each additional
household member adds to household energy consumption, but to a lesser extent. This assumption seems
especially applicable to energy used for space heating, and therefore the consumption of natural gas. Though
quantifying the effect of household size on consumption is difficult, in recent years, California has had a


38
  Though California has an average rate of housing growth (according to data from the National Association of
Homebuilders, from 2000-2006 California saw approximately 4.5 new housing starts for every 1000 people, ranking
36th in the nation), Aroonruengsawat et al. suggest that in 2007, California’s statewide building code may have reduced
per capita residential energy consumption by approximately 5-8%. They also note that because California’s code has
been in place for so long, California has had more building permits issued since the establishment of a building code
than any other state. Aroonruengsawat, Anin, Maximilian Auffhammer and Alan Sanstad, “The Impact of State Level
Building Codes on Residential Electricity Consumption,” University of California, Berkeley, November 25, 2009,
http://urbanpolicy.berkeley.edu/greenbuilding/auffhammer.pdf.

                                                                                                                                                                                                                                                    14
greater than average, and even increasing, household size, which potentially lowers the state’s residential
energy consumption (Figure 14).39

Figure 14. Average household size in CA and the US (Source: US Census)

CONCLUSION

Over the period from 1985-2007, California would have performed very well according to the PSEP metric,
with more progress years detected than any other state. California’s strong energy efficiency measures and
innovative policies have clearly influenced their trend of energy consumption by maintaining residential
electricity consumption at a nearly constant value and decreasing natural gas consumption at faster than the
national rate. While other factors have favored California’s progress in reducing residential consumption,
such as the state’s larger than average household size and decreasing heat rate, a significant portion of the
difference in per capita energy consumption between California and the other 49 states can be directly
attributed to the state’s energy efficiency efforts.


39
  According to the US Census, in 2000 the average household size in California was 2.87 people per household, while
the average household size in the US was 2.59 people per household.

                                                                                                                                                                                                                                                    15
You can also read