Continuous automated ventilation heat recovery efficiency performance assessment using building monitoring system
←
→
Page content transcription
If your browser does not render page correctly, please read the page content below
E3S Web of Conferences 246, 10006 (2021) https://doi.org/10.1051/e3sconf/202124610006
Cold Climate HVAC & Energy 2021

 Continuous automated ventilation heat recovery efficiency
 performance assessment using building monitoring system
 Tuule Mall Kull1, Alo Mikola1,*, Andres Tukia1, Ahmet Köse2,3, Eduard Petlenkov2, Martin Thalfeldt1
 1Nearly Zero Energy Buildings Research Group, Department of Civil Engineering and Architecture, Tallinn University
 of Technology, 19086 Tallinn, Estonia
 2Centre for Intelligent Systems, Department of Computer Systems, Tallinn University of Technology, 19086 Tallinn, Estonia
 3R8 Technologies company, Tallinn 11415, Estonia

 Abstract. The performance of ventilation heat recovery has high impact to the total energy consumption
 of modern buildings and its sub-optimal performance results in a remarkable energy penalty. There are
 several issues, which can significantly affect the heat recovery efficiency such as the inaccuracy of sensors,
 errors in control systems, mechanical defects and incorrect setting of the system. In addition, the direct
 comparison of the designed and measured heat recovery efficiency is not necessarily meaningful due to
 varying boundary conditions e.g. mass flow rates. The main focus of this paper is to develop and demonstrate
 a simple automated method for monitoring the heat recovery efficiency of ventilation units using building
 monitoring system (BMS). As the supply and extract air mass flows and temperatures may differ from the
 calculated initial design parameters, the proposed solution is to analyse the heat recovery efficiency using
 the number of transfer unit (NTU) method. With this method the efficiency is always calculated by the
 limiting mass flow, meaning that the warm exhaust air can not transfer more energy to the cold supply air
 than it is able to contain. As a result, the NTU method gives us the possibility to continuously compare the
 result to the temperature efficiency declared by the producer of the unit. The developed method
 demonstrated that the application of NTU method enables identifying sub-optimal performance of
 ventilation heat recovery, which would not have been revealed by direct comparison of temperature
 efficiencies. In some cases, low measured temperature efficiency was associated with problems not
 connected to the heat recovery heat exchanger. The method also enabled to estimate the additional heating
 costs due to the decreased heat recovery efficiency.

 1 Introduction analysis are no longer able to provide systems to use
 energy in an effective way [7]. It possible to conclude
 The performance of ventilation heat recovery (HR) has that automated method for monitoring the heat recovery
 high impact to the total energy consumption of modern efficiency of ventilation units using BMS can solve this
 buildings [1]. To save energy in ventilation systems heat problem [8].
 recovery using heat exchangers are installed. The most There are several issues, which can significantly
 common way to recover the heat in ventilation systems affect the heat recovery efficiency such as the
 is using the passive heat recovery systems which mainly inaccuracy of sensors, errors in control systems,
 include flat plate heat exchangers, heat pipe exchangers, mechanical defects, air leakages in components and
 run around heat exchangers and rotary wheel heat incorrect setting of the system. The supply and extract
 exchangers [2]. The design of more efficient ventilation airflows specified in the design may vary in real
 systems and units will lead to a reduction in energy operation. For example Hamid et al. [9] made field
 demand of buildings [3] but if these systems are not measurements with clean add dirty heat exchangers; the
 monitored, there is not sufficient information about the study show an average increase in the pressure drop by
 real performance of these systems [4]. Modern high- 12% and decrease in the thermal exchange efficiency by
 efficiency heat recovery systems that ensure the 8.1%. If the increase of the pressure drop in filters or in
 temperature efficiency above 85% cover the significant other components of AHUs are not compensated by the
 part of the heating energy demand of the ventilation increase in fan speed, the airflows in ventilation units
 systems [5]. It means that the correct design and are decreasing [10]. One of the most common reason for
 accurate operation of the heat exchanger of the air the change in supply-air-to-extract-air flow balance is
 handling unit (AHU) plays the most important role in frost formation in plate heat exchangers [11], [12]. If the
 optimizing the energy consumption [6]. Misevičiūtė et effective frost protection measures are not taken into
 al. have even stated that the importance of ventilation use, the pressure drop on the exhaust side of the plate
 heat exchangers has increased to the level where the heat exchanger will increase [13].
 classical methods used in heat exchanger design and

 * Corresponding author: alo.mikola@taltech.ee

 © The Authors, published by EDP Sciences. This is an open access article distributed under the terms of the Creative Commons Attribution License 4.0
 (http://creativecommons.org/licenses/by/4.0/).
E3S Web of Conferences 246, 10006 (2021) https://doi.org/10.1051/e3sconf/202124610006
Cold Climate HVAC & Energy 2021

 During practical performance of ventilation systems, (A, B, C, and D). Building B is located in Finland, the
 a number of different types of problems can occur. rest in Estonia. While the rest of these buildings were
 Javier et al. [14] have proposed that one way to save the built in the 2010s, the building A and its HVAC systems
 energy in ventilation systems is to use the dynamic date to 2004 with major reconstruction in 2014. Table 1
 monitoring through Supervisory Control And Data shows the main usage of each building and the length of
 Acquisition. Prouzeau et al. have pointed out that the the gathered datasets.
 current Building Management Systems (BMS) do not Building B is a garage of a supermarket and all its
 allow efficient visualisation of the measured data, which units have design temperature set points at 12 °C (actual
 means that even if the data is measured, it is not possible temperature set point at 15 °C). Building A’s units
 to use its full potential [15]. A user friendly BMS have been designed for 18 °C supply temperature, but
 enables to perform a long term monitoring of the AHUs units A1 and A4 are operated at set points of 15 and 16
 and reduce the energy consumption through the °C. All other units service indoor areas with set points
 development of better control algorithms [4]. 19 to 21 °C. This and other technical and design data
 To determine if the heat exchanger is operating that is essential for this paper, was collected from the
 effectively, it is possible to compare the measured building managers and is shown in Table 2.
 temperature efficiency to the data that is stated in All chosen AHUs in these buildings include a heat
 technical specification of this ventilation unit. At the recovery unit with either rotary-, plate-, or run-around
 same time, the direct comparison of the designed and coil (RAC) heat exchanger. Efficiency of these heat
 measured heat recovery efficiency is not necessarily exchangers is described by the supply side temperature
 meaningful due to varying boundary conditions. To ratio declared according to standard EN 308 [21]. This
 solve the problem of comparison of the heat recovery definition was chosen as the representative declared
 efficiency the widely known solution is to use efficiency while being clearly defined and available for
 Effectiveness of Heat Exchanger–Number of Heat most units. Moreover, EN 308 defines a conservative
 Transfer Unit (ε-NTU) method [16]. Studies have estimate of efficiency as measured for dry conditions.
 shown that this method is suitable for the assessment of For building B, only design temperatures where
 the thermal performance of counter and crossflow heat available and the EN 308’s efficiency was calculated.
 [17], [18]. With this method, the efficiency is always Nominal (nom.) flows are the design volumetric
 calculated by the limiting mass flow, meaning that the airflows for the supply (SUP) and return (RET) sides.
 warm exhaust air cannot transfer more energy to the cold Table 2 lists only one airflow of units where the
 supply air than it is able to contain [19]. As a result, the values for SUP and RET sides are equal.
 NTU method gives us the possibility to continuously The data points gathered from BMS for each AHU
 compare the result to the temperature efficiency are shown in
 declared by the producer of the unit. The negative side Table 3. The measurement apparatus was the typical
 of the simplified NTU method is the fact that this equipment used in AHUs, not scientific calibrated
 method is not taking into account the influence of latent devices.
 heat and condensation of water vapour in exhaust side
 of heat exchanger [20]. As the relative humidity in
 2.2 Data cleaning and initial filtering
 extract and supply airflows is not measured in practice,
 then it is not possible to consider this. At the same time, The periods when AHUs are switched off were not of
 the temperature efficiency, which is calculated interest for this work. All but C1 units are working
 according to temperature measurement results inside the periodically, i.e., these are switched off during nights,
 heat exchanger, is always higher than the actual sensible office units also during weekends. Unit C1 is constantly
 temperature efficiency that do not include the in use as is common for residential buildings. To
 condensation of water vapour in heat exchanger. What eliminate data at nonworking times, either the main
 is more, the comparison is still not meaningful when the switch information or, in the case of building D, a
 heat recovery is not working at full load. volume flow limit of 0.3 m3/s was applied. Data for
 The aim of this work is to find a way to analyse the is not available in unit C1, ℎ is missing in all units
 heat recovery efficiency in buildings with BMS system of building B.
 for the situation when the airflows are not at their design
 values. The analysis should enable finding faults in the
 system, although not yet diagnose them. 2.3 Fault detection criteria

 2.3.1 Finding limiting values
 2 Methods
 Detecting AHU HR faults, the most obvious is to
 2.1 Research objects and data acquisition compare the efficiency estimated from the measured
 values to the declared efficiency. As mentioned in
 In this paper, BMS data trends are the basis for the fault Section 1, the comparability has to be guaranteed
 detection and diagnostics of HR units. Manager of the through recalculation if the supply and return airflows
 data is a company called R8 Technologies, which are not equal. The method applied in this paper is
 gathers and transforms the data into 15-min time steps. clarified in Section 2.4.2.
 In this paper, 17 AHUs are analysed from four buildings

 2
E3S Web of Conferences 246, 10006 (2021) https://doi.org/10.1051/e3sconf/202124610006
Cold Climate HVAC & Energy 2021

 However, such comparison can be done only when
 the heat recovery state is correctly 100% (or close to it,
 in this work states over 95% are used) and not high due
 to a mistake. To classify all possible situations, filters Table 2. AHU data, the first letter of AHU name is the
 were applied to the data to be confident that the building
 comparison is reasonable where applied. The filters are Temp. Nom. airflows
 Tset HR
 defined in section 2.3.2. AHU ratio SUP/RET
 [°C] type
 It is clear that HR should not be working 100% when EN 308 [m3/s]
 it is too warm outside. While the supply temperature has A1 15 Rotary 0.777 7.5 / 7.3
 a clear cut-off level at the setpoint, the outdoor A2 20 Rotary 0.787 7.5
 temperature does not have such a clear limit. However, A3 20 Rotary 0.676 7.8 / 6
 from the temperature ratio equation for the supply side A4 16 RAC 0.302 3.2 / 2
 [21]: A5 19 RAC 0.359 1.3 / 1
 − A6 21 RAC 0.389 2.8 / 2.3
 , = (1)
 − B1 15 Rotary 0.447 8
 B2 15 Rotary 0.447 8
 we can derive that if some declared temperature ratio
 B3 15 Rotary 0.447 8
 holds ( , = ) then the supply temperature should
 B4 15 Rotary 0.447 8
 be:
 B5 15 Rotary 0.447 8
 = ∙ + ∙ (1 − ) (2) B6 15 Rotary 0.447 8
 where is the declared temperature ratio and the C1 21 Plate 0.796 1.2
 temperatures were defined in D1 21 Plate 0.700 2.75
 Table 3. The way to find a suitable declared value is D2 21 Plate 0.700 2.16
 shown in Section 2.4. If < , we can derive D3 20 Rotary 0.830 5.2
 from Eq. (2 that the outdoor temperature has a limit at D4 20 Rotary 0.810 4.72
 , :
 − ∙ Table 3. Gathered data trends from BMS
 < = , (3)
 1 −
 Name Unit Description
 As in some situations, this limit value can obtain
 unrealistic values, we limit it to minimum and maximum Outdoor air temperature
 °C
 measured outdoor temperatures across all units. In most measured on building façade
 cases, , will be lower than . However, for Supply air temperature
 measured after HR but before
 rare situations, we take into account that the outdoor °C
 heating and cooling coils on
 temperature should also be below when the supply side
 comparison of efficiencies is allowed. Therefore, to be Supply air temperature to the
 applied for filtering, we define two limits: , ℎ °C
 rooms
 , = ( , , ) (4) °C Return air temperature extracted

 from the rooms
 Exhaust air temperature
 ,ℎ ℎ = ( , , ) (5) ℎ °C measured after HR on return
 side
 Table 1. Main usage and data span for each building ̇ m3/s Volume flow on supply side

 Duration ̇ m3/s Volume flow on return side
 Usage type Start Stop
 (months) State of the HR:
 A Supermarket 13 2019-01 2020-01 rotation speed for rotary /
 % damper valve position for plate /
 B Garage 10 2019-07 2020-05 valve position for RAC
 C Multi-family 12 2019-01 2019-12 heat exchanger
 D Office 4.5 2020-09 2021-01 HR efficiency, only used to
 % check, which temperature ratio
 is used in BMS

 2.3.2 Defining filters
 Based on the supply and outdoor temperatures as well
 as HR state values, data filters were defined. The filters
 are shown in Table 4.
 First of all, the filter F1 is defined to include the data
 where the comparison of efficiencies is possible.
 Therefore, most of the following analysis is based on

 3
E3S Web of Conferences 246, 10006 (2021) https://doi.org/10.1051/e3sconf/202124610006
Cold Climate HVAC & Energy 2021

 data that is defined by F1 conditions: the supply has occurred (NTU negative, BMS positive, fault label
 temperature (before the heating coil) has to be below the false positive) can result in time and money spent by the
 setpoint, the outdoor temperature has to be below the maintenance company. It is clear that these are edge
 limiting temperature defined by Eq. (3 and HR state has cases and when everything is very clearly fine, both test
 to be at least 95%. results would be negative (fault label true negative) and
 An automatic control system is changing the positive if something is clearly off (fault label true
 temperature setpoints in the buildings at hand and these positive).
 setpoints are not available at all times. Therefore, a For BMS, is the supply side temperature ratio as
 default setpoint level that is often followed is applied, given in Eq. (1, for most units also equal to , and
 which is also shown in Table 2 for each AHU. This is equal to , 308 , the declared temperature ratio
 leads to some situations when the setpoint is actually according to EN 308. In the case of building A, the BMS
 slightly different than taken into account. actually visualizes the return side temperature ratio, not
 When the setpoint is higher than the default level, we the supply side one. However, the comparison was still
 classify some of the data that should be below as calculated against the supply side temperature ratio for
 being above and according to HR state, it falls under our further analysis. For NTU method is the same but
 filter F5 or F6 together with overheating and warm is the supply side temperature ratio benchmark
 period situations where actually no HR is needed. When calculated from Eq. (12.
 the setpoint is lower than the default level, we classify
 the warm period or overheating situations under filters
 Table 4. Data filter definitions combined with logical AND
 F1 through F4 dependent on outdoor temperature and
 functions ( is without heating after the HR)
 HR state.
 Filters other than F1 enable initial fault detection.
 Filter label and
 For example, filters F2, F4, and F5 show problems. description
 However, the diagnosis of these faults would need some ≥
 < < , ≥ 95% F1
 95%, correctly
 further analysis, which is out of scope for this paper.
 <
 Filters F7 and F8 highlight missing data.
 < < , < 95% F2 95%,
 incorrectly
 2.3.3 Fault test <
 ≥ , Not
 F3
 <
 < ,ℎ ℎ NaN 95% allowed
 At times when HR state is correctly over 95% (F1), we Not
 < ≥ ,ℎ ℎ F4 Problem
 can detect the optimality error in the heat exchanger’s NaN
 work if the realized efficiency ( ) is lower than the >= Tset Not NaN ≥ 5% F5 Overheating
 potential efficiency. This fault can be detected but the
 >= Tset Not NaN < 5% F6 Warm period
 reason cannot be diagnosed based on only this data.
 Not not
 Often in practice, such comparison is done without any Any NaN F7
 NaN available
 recalculations based on supply side temperature ratio not
 and EN 308 declared value (BMS method). This would Any Any NaN F8
 available
 result in some faults left undetected by BMS and some
 warnings rising where these are not valid.
 To clarify this problem, a fault test was defined. The Table 5. Possible fault test results for BMS and NTU
 fault test was applied to all timesteps and we were methods comparing efficiency levels
 comparing two methods. The result of the test is positive
 Fault test Fault test Fault
 if the given method detects a fault in the system and
 BMS result NTU result label
 negative if a fault is not detected. Comparing two False
 methods, we have four possible outcomes of the test: ≤ negative > positive negative
 both positive, both negative, method 1 positive and ≤ negative ≤ negative
 True
 method 2 negative, and vice versa. negative
 False
 We are comparing the NTU method with the BMS > positive ≤ negative positive
 method. NTU method re-calculates the benchmark for True
 unbalanced airflows and the process is shown in Section > positive > positive positive
 2.4. Possible fault test outcomes for BMS method and
 NTU method are shown in
 2.4 Calculations for redefining the benchmark
 Table 5. As BMS method is the widely used one, the
 test results are combined with test result labels assessing
 whether the result given by BMS is correct according to 2.4.1 Effectiveness and efficiency
 NTU method (true) or not (false).
 It is clear that an unfound fault (NTU positive, BMS In the most traditional approach, BMS visualizes one
 negative, fault label false negative) can cause expenses temperature ratio for a HR unit, the temperature ratio for
 whether through higher than expected energy use or the supply side (Eq. (1). To detect faults, this is
 resulting in more serious malfunction occurring later. sometimes continuously compared to the declared
 However, a warning rising when no problem actually efficiency value, but mostly it is just used as an indicator
 for times when it is severely off the expected value. To

 4
E3S Web of Conferences 246, 10006 (2021) https://doi.org/10.1051/e3sconf/202124610006
Cold Climate HVAC & Energy 2021

 be clear, temperature ratio and efficiency = are / respectively). For the supply side it would
 used as synonyms. Effectiveness is the ratio of heat be:
 flows, at unequal mass flows this is not equal to
 efficiency. , = (12)
 ,
 Using the definition, the effectiveness could be
 calculated as follows [22]: When the declared effectiveness is known, this would
 enable getting a declared value, which would be
 = (6) comparable to the temperature ratio visualized in BMS.

 Unexpectedly, we obtain also an opportunity to not
 The maximum heat flow in the denominator is for both only evaluate the supply side temperature ratio but we
 the supply and the return side [22]: similarly also get a benchmark for the return side. As
 condensation is not taken into account, this has to be
 = ( − ) (7)
 applied only carefully. In the ideal case of no
 is the minimum of the heat capacity rates of the condensation and no heat transfer to the ambient, the
 supply and return flows [22]: temperature ratio on the return side would be similar to
 the supply side. In reality, it is almost always different
 = [ ̇ , , ̇ , ] (8)
 (often lower) than the supply side efficiency, especially
 Here ̇ is mass flow and is the specific heat capacity for plate heat exchangers.
 of the fluid. Mass flows were calculated from volume
 flows and air density. For density calculation Eq. (9 was 2.4.2 Applying NTU
 used [22], [23]:
 ( ) = 1
 kg
 ∙ 353 K / (273.15 K + ) (9) To enable continuous fault detection at all airflows, a
 3 benchmark that could be compared to the temperature
 where , the air temperature in °C for the given point ratio is needed. To get this variable, we use the NTU
 was taken into account where possible. As ℎ is method. Supply side temperature the AHU producers
 missing for all units in building B, was used for the declare according to EN 308 ( , 308 ) and nominal
 density calculation instead. However, the return side airflows are used as the starting basis. This declared
 temperature ratio could not be estimated still as the efficiency level is given at dry conditions, which
 temperature ratio for the return side is [21]: guarantees a conservative benchmark due to almost no
 − ℎ condensation effect. This value is mostly given at
 , = (10) balanced mass flows ( , 308 = , 308 ) with
 −
 temperature of 20 °C used for both sides in calculations
 The nominator in Eq. (6 would include the so it is also for balanced volume flows. Therefore, it can
 multiplication of the respective temperature ratio be and was transformed with NTU method into a
 nominator (from Eq. (1 and Eq. (10), and the respective benchmark for unbalanced airflows on the basis of
 heat capacity rate (e.g. ̇ , ( − ) for general textbooks in the field [22], [23] as follows.
 the supply side). Declared NTU was first calculated from the declared
 In our data, the temperatures are between -20 °C and temperature ratio assuming balanced mass flows [23]:
 +40 °C at all times. In this range of temperature and , 308
 pressure around atmospheric pressure, the specific heat 308 = (13)
 1 − , 308
 capacity stays close to constant and therefore the -s
 cancel out. With balanced airflows, the temperature If the mass flows are not equal for the design case (units
 ratios are equal to the heat flow ratios as the mass flows A1, A3, A4, A5, A6), NTU can be calculated for the
 cancel out as well. counterflow heat exchangers as [23]:
 For unbalanced airflows, it is often suggested to use 1 , 308 − 1
 the heat flow rates for efficiency estimation. However, 308 = ( ) (14)
 − 1 , 308 − 1
 the heat flow ratio could become larger than 1 for the
 side with larger mass flow, not representing the Calculation from , 308 to , 308 for unbalanced
 efficiency any more. The nominator would be multiplied flows is done similarly as in Eq. (11. is the ratio of
 with the mass flow at the observed side and the heat capacity rates [23]:
 denominator with the minimum of two mass flows. [ ̇ , , ̇ , ]
 Therefore, one of the effectiveness values would not = = (15)
 differ from the temperature ratio while the other would [ ̇ , , ̇ , ]
 be larger. where and are, respectively, the minimum
 When the temperature ratio is known, the and maximum of the heat capacity rates of the supply
 effectiveness can be also calculated as: and return flows. Clearly, for a system with balanced
 ( − ) mass flows = 1, which is why a different formula has
 , = = (11) to be used in unbalanced and balanced mass flow cases.
 ( − ) , The assumption of counterflow situation in Eq. (14
 Here, we can reduce the by the ratio of the does not apply to all heat exchangers, but the
 corresponding heat capacity rates ( / or explanation why this is assumed is shown later with the

 5
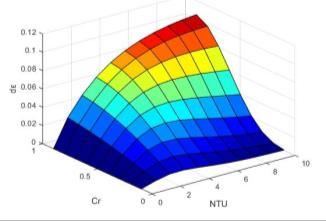
E3S Web of Conferences 246, 10006 (2021) https://doi.org/10.1051/e3sconf/202124610006
Cold Climate HVAC & Energy 2021

 example of Eq. (18. For now, we continue from NTU Eq. (20 will be used in Section 3.3 to visualize how the
 calculated from Eq. (13 or (14. airflow effectiveness changes when airflows are
 NTU describes the potential heat transfer rate as: different from designed.
 In the general case, the NTU from Eq. (19 would be
 = (16) inserted to Eq. (17 and the obtained effectiveness would
 be translated to the benchmark temperature ratio by
 where U is the overall heat transfer coefficient and A is applying Eq. (12, or similar equation for the return side.
 the heat transfer surface area (equal at both sides [23]). The 308 for applying in Eq. (19 would be
 Values of NTU should be positive. From here, UA can calculated from Eq. (13 or (14 dependent whether the
 be calculated for the design case. design situation is for balanced or unbalanced airflows.
 To enable the transformation from a balanced Often the last step of applying Eq. (12 is omitted, which
 situation to unbalanced airflows, we should assume that would result in efficiency over 100 % for one side and
 something in the heat exchanger stays constant. When is therefore not usable.
 the airflows do not change much, either NTU or UA
 could be assumed to be constant. However, to guarantee
 2.4.3 Selection software comparison
 the applicability for large differences in airflows, NTU
 is not fixated and UA is assumed to be constant. Of To ensure that the methods applied really output
 course, in reality, U can vary as well, especially for very reasonable results, Fläkt design software “Acon” was
 low or extremely high airflows, and effective area can used to compare the resulting efficiencies. Design
 vary due to dust, but this is out of the scope of this paper. conditions of = −20, = 22 were used, and
 Assuming that UA stays constant for both when the = 1.005 was assumed. Several cases were tested, as
 airflows are balanced or unbalanced, we could calculate an example, three situations are reported in Table 6 with
 UA from the design situation and then NTU from this the results in Table 7. There will be differences between
 UA at any measured from Eq. (16. Then, the the two as the program additionally takes into account
 declared effectiveness for unbalanced airflows can be the leakage and condensation effects that we omit in this
 calculated from Eq. (17 [22], [23]: paper. However, the difference cannot be large for the
 1 − [− (1 − )] chosen situations if our approach is working well.
 , = (17)
 1 − [− (1 − )] Table 6. Definition of comparison cases in Acon software
 where measured and for measured are Situation Design Volume flow Volume flow
 applied. This is the effectiveness formula for efficiency design [m3/s] test [m3/s]
 counterflow heat exchangers and Eq. (14 is the reverse SUP/RET SUP/RET
 of this. This is practically usable in most cases. 1 82.3% 1 0.9/0.7
 However, it could be that in some cases, cross-flow 2 82.3% 1 2
 (single pass) form of the formula could be more accurate 3 82.3% 1 0.5
 [23]:
 0.22 3 Results and discussion
 = 1 − ( ( (− 0.78 ) − 1)) (18)

 This and other formulas for effectiveness have been 3.1 Comparison between cross- and counter-
 derived for several different types of heat exchangers. flow effectiveness formulae
 However, re-arranging this formula for NTU, like done
 in Eq. (14 for the counterflow formula, does not result The possible effectiveness values from counterflow and
 in an explicit solution. That means a numerical cross-flow formulas Eq. (17) and (18 are calculated for
 estimation of NTU would be needed instead of direct Cr in between 0 and 1 and NTU in between 0 and 10.
 calculation like in Eq. (14, which is not simple enough The effectiveness is shown as a separate line for each Cr
 to apply in BMS. Therefore, the counterflow formula is value with 0.1 steps in Figure 1. Crossflow is shown in
 used for all heat exchangers in this work [18]. However, solid and counterflow in dashed lines. Difference of
 to quantify the possible error we make with this, the these two is shown in the small surface plot inside the
 difference of applying these formulas was compared at graph. We can see that at high NTU and Cr the
 different NTU and Cr values in Section 3.1. difference can be as high as 10 percent points.
 Using the assumption that UA is constant, we can Effectiveness for cross-flow units is in all cases lower
 derive from Eq. (16 that: than for counterflow, which we use further.
 , ∙ 308
 = (19)

 When additionally assuming balanced measured
 airflows, we can derive using Eq. (13 and any that:
 308
 = = =
 + 1 (20)
 308 +
 ,

 6
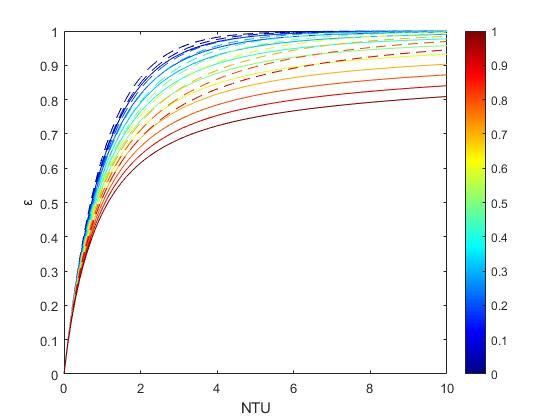
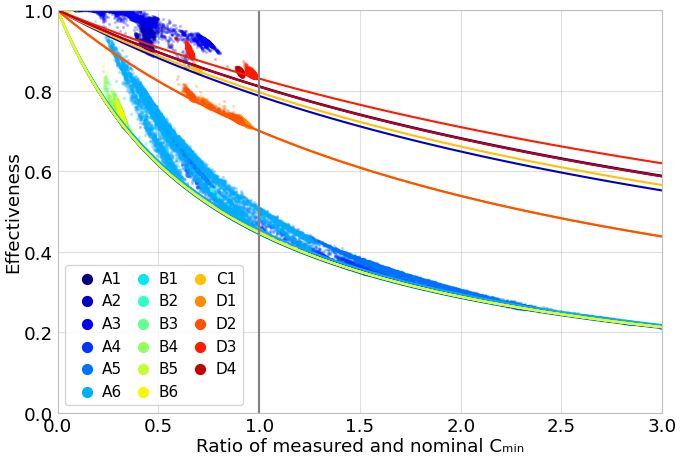
E3S Web of Conferences 246, 10006 (2021) https://doi.org/10.1051/e3sconf/202124610006
Cold Climate HVAC & Energy 2021

 Cr In Figure 3, the calculated effectiveness values from
 Eq. (20 are plotted against the ratio = / , .
 The ratio is the multiplier to get the actual mass flow
 from the design situation. A tendency can be spotted in
 the measured values (points). Therefore, the theoretical
 effectiveness value (lines) was calculated for each unit
 at different values. However, this calculation is
 0.1 possible in the general case without including
 temperatures only when we assume balanced airflows.
 Δε

 We can see that at above the grey line (airflows larger
 0
 1 than designed) the fit is good. The theoretical situations
 10
 0.5 converge at = 0, which would mean no airflow at
 0 0
 either the supply or return side or both and is therefore
 not practical. In the measured points, very low mass
 flows and therefore low values are not included in the
 Figure 1. Cross- (solid lines) and counter- (dashed lines) data. However, the converging can be spotted at around
 flow effectiveness ( ) change with rising of NTU and Cr. = 0.2. Therefore, the fit for the ratios below the grey
 Surface plot shows difference between the two methods. line is not ideal.
 In both Figure 2 and Figure 3, we can see high
 3.2 Comparison with AHU selection software variability in airflows for building A units. This is
 mainly caused by the fact that the units and their
 Table 7. Acon software and NTU method comparison results controllers and sensors are old. However, there is also
 Situation Fläkt efficiency Efficiency from NTU
 more data available from these units and the
 1 70.5% 72.5% management company has used machine learning based
 2 68.0% 69.4% control solutions for a longer period, gradually
 3 89.5% 89.9% improving the algorithms.

 Table 7 shows that there is some difference between the
 Acon software results and the ones calculated according
 to the NTU method described in Section 2.4. Although,
 the underlying method for Acon software probably
 includes also the NTU method. Among the main reasons
 for the differences, Fläkt supposedly takes into account
 the condensation effects that NTU method applied in
 this way does not. NTU method in general includes it,
 but in many cases, we do not have the data needed for
 the estimation. Still, the differences are small, varying
 for the observed cases from 0.4 to 2 %. The method
 adequately handles the increase and decrease from
 nominal volume flows. The temperature ratios stay
 below or maximally at 100% according to the NTU Figure 2. Measured and nominal volume flows for each AHU,
 method, which it should as being the efficiency. measured data distributions from BMS, cut-off below 0.3 m3/s.

 3.3 Influence of airflow difference from design
 situation on effectiveness
 From the methodology, it is clear that volume flows
 different from the design situation may change the
 benchmark. The actually measured volume flow
 distributions together with nominal value points are
 shown in Figure 2. We can see that AHUs A1 through
 A3 and all AHUs in building B operate with
 significantly lower airflows than designed. AHUs A4
 through A6 have highly varying airflows around the
 designed values and AHUs in building D have two
 airflow modes, one close to nominal and one slightly
 Figure 3. Effectiveness level dependent on ratio of measured
 lower. This can be explained by a period in 2020 when and nominal values, scatter points are actually measured
 during night the office units where not shut off but values and lines represent the theoretical situation at balanced
 operating at lower airflows to keep the rooms clean from airflows.
 virus.

 7
E3S Web of Conferences 246, 10006 (2021) https://doi.org/10.1051/e3sconf/202124610006
Cold Climate HVAC & Energy 2021

 true positives. As the unit itself is very similar to other
 units in building B, this AHU should be checked for
 malfunctions.
 Four units in the building A appear to have faults
 according to the simple BMS method, but NTU does not
 show these faults. These are the blue false positive
 columns in Figure 5. We can assume that if there is
 something wrong, the fault is not caused by the HR.
 Most probably NTU does not show a problem as the
 airflows are much higher at some timesteps for these
 units than designed.
 There are two units, for which BMS shows no fault,
 but NTU often reports problems. The difference is
 quantified in the next section. We can see from Figure 6
 Figure 4. Filtering results according to classifications in
 Table 4
 that for C1, the difference is actually very small. If we
 would also compare the return side here, we would have
 a lot more problem signals as this is a plate heat
 exchanger and condensation affects the results often.
 However, as the condensation effect is not taken into
 account, it would not be correct.

 Figure 5. Fault test results: percentage of time AHU spends in
 each class out of the filtered data, ordered for better readability

 3.4 Filtering results
 The HR is not working at its maximum potential the
 whole time. It is clear that sometimes this is the wanted
 behaviour. Figure 4 shows the data filtered by the
 conditions in Table 4. The only part we actually analyse
 is the part where HR state is and should be over 95%.
 This is shown in the chart in blue and ranges from 0.5 to
 56 % of all data depending on the AHU. The 0.5% still
 includes around 100 data points.
 The datasets include summer periods when heat
 recovery is correctly not working. Building D has data
 from September to January and therefore no warm
 period is included. Building D was integrated to the
 monitoring system in September, but the bypass damper
 position data was only included starting from December.
 That is why most of the data for D1 and D2 are not
 usable for us. This is generally a big problem that some
 data is not available.

 3.5 Fault test results
 Figure 6. Difference between the temperature ratio and the
 The fault test results for each unit are shown in Figure
 NTU benchmark, negative means underperforming and
 5. The units on x-axis are ordered with mostly true positive well-performing situation
 negatives on the left and mostly true positives on the
 right. Almost half of the units have many true positive
 values, meaning that there is a fault, which is detected 3.6 HR efficiency performance
 by both the simple and the NTU method. All units in
 building D belong here. Moreover, for many units it The temperature ratio and benchmark differences for
 applies that true negatives dominate where HR is each time step for both supply and return sides are
 working fine and both methods show the same. All units summarized in Figure 6. Units B3 through B6 are
 in building B belong here, except B2 which has mostly omitted as the results are very similar to unit B1.

 8
E3S Web of Conferences 246, 10006 (2021) https://doi.org/10.1051/e3sconf/202124610006
Cold Climate HVAC & Energy 2021

 However, there is a clear difference in unit B2 for fresh air supply in zero energy buildings,”
 performance, although it is also similar to the other units Applied Thermal Engineering, vol. 148. pp.
 in building B. The variability is very large in all units in 544–556, 2019.
 the building A due to the same effects described in [3] D. O’connor, J. K. S. Calautit, and B. R.
 Section 3.3. We can see that in the building A, rotary Hughes, “A review of heat recovery
 heat exchangers (A1 to A3) are underperforming while technology for passive ventilation
 RAC heat exchangers are mostly performing as applications,” Renewable and Sustainable
 expected as the benchmark levels for these units are very Energy Reviews, vol. 54. pp. 1481–1493, 2016.
 low. In building B, all AHUs except B2 perform well. [4] L. Schibuola, M. Scarpa, and C. Tambani,
 B2 efficiency is on average 40 percentage points lower “Performance optimization of a demand
 than expected. In buildings C and D, all chosen units controlled ventilation system by long term
 underperform. It was known that unit D3 was damaged monitoring,” Energy Build., vol. 169, pp. 48–
 during transport and we can see that its performance is 57, 2018.
 actually 10 percentage points lower than for other units [5] A. Meiss, M. Á. Padilla-Marcos, I. Poza-
 in this building. Casado, and A. Álvaro-Tordesillas, “A
 graphical tool to estimate the air change
 efficiency in rooms with heat recovery
 4 Conclusions systems,” Sustain., vol. 12, no. 3, 2020.
 The paper shows that the variation of NTU method is [6] V. Misevičiūtė, K. Valančius, V. Motuzienė,
 well suitable for continuous performance assessment of and G. Rynkun, “Analysis of exergy demand
 the heat recovery efficiency. For the old building A, the for air heating of an air handling unit / Violeta
 variations are large and for some units only a small Misevičiūtė, Kęstutis Valančius, Violeta
 portion of the data is comparable. Still, the variations Motuzienė, Genrika Rynkun.,” Energy Effic.,
 also reflect in the benchmark and therefore the method vol. 10, no. 4, pp. 989–998, 2017.
 clarifies some situations when the BMS method gives [7] V. Misevičiūtė, K. Valančius, V. Motuzienė,
 faults. While for other units the variations are much and G. Rynkun, “Analysis of exergy demand
 smaller, it also enables to identify problems more for air heating of an air handling unit,” Energy
 clearly. The method enabled us to quantify the lack of Effic., vol. 10, no. 4, pp. 989–998, 2017.
 efficiency for the unit D3, a unit with known physical [8] V. Martinaitis, G. Streckiene, A.
 faults. Compared to units in the same building the Bagdanavicius, and J. Bielskus, “A
 efficiency was 10 percentage points lower. A unit with comparative thermodynamic analysis of air
 unknown fault was detected, the unit B2. In future work, handling units at variable reference
 the difference in efficiency should be translated to temperature,” Appl. Therm. Eng., vol. 143, pp.
 additional cost for the owner and further data filters 385–395, 2018.
 should be developed to not only detect but also diagnose [9] A. Abdul Hamid, D. Johansson, and M.
 the faults. The main limitation of this method is its Lempart, “Determining the impact of air-side
 applicability to HR working at full load only. Partial cleaning for heat exchangers in ventilation
 loads are prevailing situations for spring and autumn systems,” Build. Serv. Eng. Res. Technol., vol.
 conditions and a solution to apply same or similar 41, no. 1, pp. 46–59, 2020.
 method should be developed in future. [10] A. Hamburg, K. Kuusk, A. Mikola, and T.
 Kalamees, “Realisation of energy performance
 targets of an old apartment building renovated
 This research was supported by the Estonian Centre of to nZEB,” Energy, vol. 194, 2020.
 Excellence in Zero Energy and Resource Efficient Smart [11] A. Jedlikowski and S. Anisimov, “Analysis of
 Buildings and Districts, ZEBE (grant 2014-2020.4.01.15- the frost formation and freeze protection with
 0016) funded by the European Regional Development Fund, bypass for cross-flow recuperators,” Appl.
 by the European Commission through the H2020 project Therm. Eng., vol. 116, pp. 731–765, 2017.
 Finest Twins (grant No. 856602) and the Estonian Research [12] A. Pacak, A. Jedlikowski, D. Pandelidis, and S.
 Council grant (PSG409). This research is also financed by the Anisimov, “Analysis of freeze protection
 Archimedes grant named Applied research in smart methods for recuperators used in energy
 specialisation growth areas (NUTIKAS, LEP19101) and
 recovery from exhaust air,” in E3S Web of
 supported by R8 Technologies.
 Conferences, 2017, vol. 22.
 [13] A. Jedlikowski, S. Anisimov, J. Danielewicz,
 5 References M. Karpuk, and D. Pandelidis, “Frost
 formation and freeze protection with bypass for
 [1] A. Grzebielec, A. Rusowicz, and A. Ruciński, counter-flow recuperators,” Int. J. Heat Mass
 “Analysis of the performance of the rotary heat Transf., vol. 108, pp. 585–613, 2017.
 exchanger in the real ventilation systems,” in [14] J. M. Rey-Hernández, S. L. González, J. F. San
 9th International Conference on José-Alonso, A. Tejero-González, E. Velasco-
 Environmental Engineering, ICEE 2014, 2014. Gómez, and F. J. Rey-Martínez, “Smart energy
 [2] Z. Liu, W. Li, Y. Chen, Y. Luo, and L. Zhang, management of combined ventilation systems
 “Review of energy conservation technologies in a nZEB,” in E3S Web of Conferences, 2019,

 9
E3S Web of Conferences 246, 10006 (2021) https://doi.org/10.1051/e3sconf/202124610006
Cold Climate HVAC & Energy 2021

 vol. 111.
 [15] A. Prouzeau, M. B. Dharshini, M.
 Balasubramaniam, J. Henry, N. Hoang, and T.
 Dwyer, “Visual Analytics for Energy
 Monitoring in the Context of Building
 Management,” in 2018 International
 Symposium on Big Data Visual and Immersive
 Analytics, BDVA 2018, 2018.
 [16] S. Borjigin, S. Zhang, M. Zeng, Q. Wang, and
 T. Ma, “Coupling ε-NTU method for thermal
 design of heat exchanger in cabinet cooling
 system,” Appl. Therm. Eng., vol. 159, 2019.
 [17] S. H. Noie, “Investigation of thermal
 performance of an air-to-air thermosyphon heat
 exchanger using ε-NTU method,” Appl. Therm.
 Eng., vol. 26, no. 5–6, pp. 559–567, 2006.
 [18] H. Jaber and R. L. Webb, “Design of cooling
 towers by the effectiveness-NTU method,” J.
 Heat Transfer, vol. 111, no. 4, pp. 837–843,
 1989.
 [19] H. A. Navarro and L. C. Cabezas-Gómez,
 “Effectiveness-ntu computation with a
 mathematical model for cross-flow heat
 exchangers,” Brazilian J. Chem. Eng., vol. 24,
 no. 4, pp. 509–521, 2007.
 [20] R. Adamovský, D. Adamovský, and D. Herák,
 “Exergy of heat flows of the air-to-air plate
 heat exchanger,” Res. Agric. Eng., vol. 50, no.
 No. 4, pp. 130–135, 2018.
 [21] European Commitree of Standardization, “EN
 308:1997. Heat Exchangers - Test Procedures
 For Establishinng Performance of Air to Air
 and Flue Gases Heat Recovery Devices,” 1997.
 [22] T. L. Bergman and A. S. Lavine,
 Fundamentals of Heat and Mass Transfer, 8th
 editio. Wiley, 2017.
 [23] L.-Z. Zhang, Total heat recovery : heat and
 moisture recovery from ventilation air. New
 York: Nova Science Publishers, Inc., 2008.

 10
You can also read