Global Warming 101 - or Everything you Wanted to Know About Our Changing Climate - (but were too afraid to ask)
←
→
Page content transcription
If your browser does not render page correctly, please read the page content below
Global Warming 101 – or Everything you
Wanted to Know About Our Changing Climate
         (but were too afraid to ask)

                Michael Adler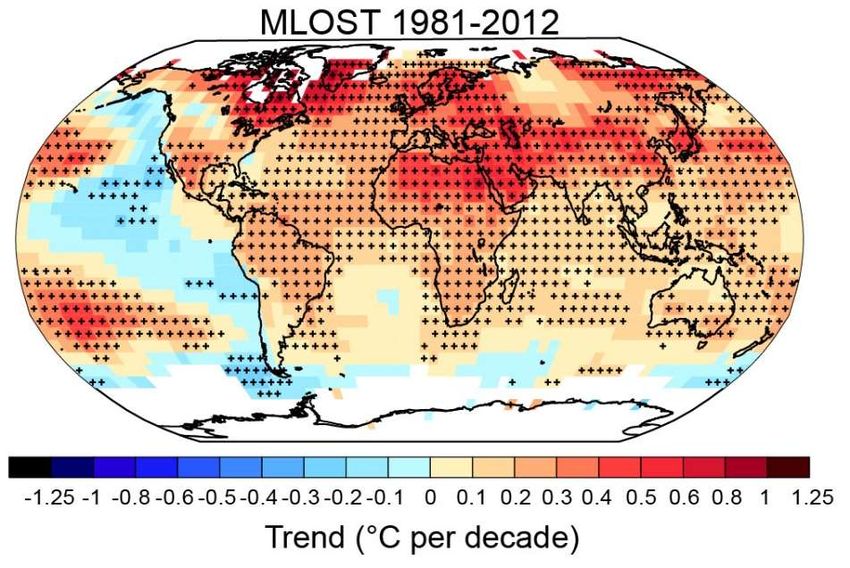
Outline of Presentation

• Explanation of the greenhouse effect on Earth using simple models
• Applying the simple models to all of the terrestrial planets
• Measurements of climate related properties and comparison with
  complex Earth System Models(ESM)
• Projections of these models to 2100 and beyond
• Necessary changes to meet climate goals
The Greenhouse Effect
•     The earth absorbs visible and ultraviolet light from the Sun. The Earth re-radiates infrared light up to the atmosphere and the
      atmosphere absorbs some of this radiation and re-radiates it back to the earth’s surface
•     The earth re-absorbs this energy with the result that it loses less heat than if there were no atmosphere

    Sun                                                                                                                   Earth
    surface                                                                                                               surface
    5280 K                                                                                                                287 K

                   Black Body at 5280 K                                             Black Body at 14C

      Visible and uv solar radiation arriving at the               Infrared radiation from the earth at the top of the
      earth’s surface                                              atmosphere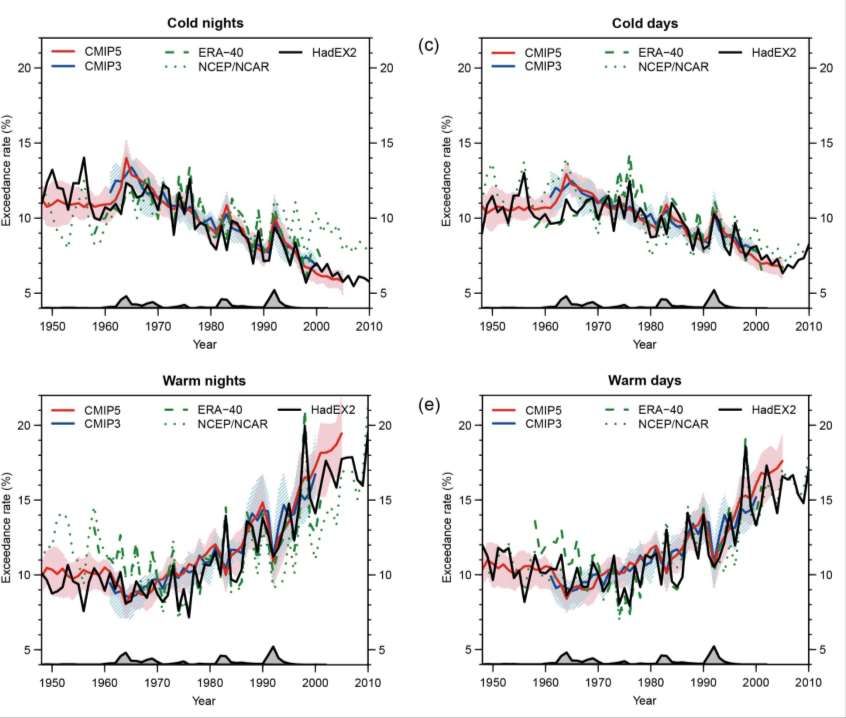
Historical Correlation Between
Greenhouse Gases and Temperature
Calculating Earth’s Temperature Assuming No Atmosphere
•    The Stefan-Boltzmann law, S= σT⁴ , is the sum of all of the power emitted by a black body at temperature T where σ is the
     Stefan-Boltzmann constant and is the integral of Planck’s black body curve over the entire range of frequencies(1)
•    Emitted solar radiation Se= σTs⁴, where σ=5.67x10**-8, T=5778K, is the surface temperature of the Sun and
     Se=6.32x10**7W/m²
•    Radiation arriving at the earth is Se times the Sun’s surface area, divided by the area of the Sun’s sphere at distance of earth
     Sar= σTs⁴ *(4*π*Rs²)/(4*π*D²), where Rs is the sun’s radius, and D is the distance from the sun
•    The earth’s absorption area is its shadow disc area as shown in the diagram but its emission area is the entire spherical surface
     area

                Radiation leaving the Sun Radiation arriving at the                                                          Radiation that could
                per unit area of sun      TOA of the Earth                                                                   be absorbed
                Se=σTsun⁴                     Sar= Se4πRs²/4πRse²                                                            S =Sar (πRe²)/(4πRe²)
                =5.67x10⁻⁸ (5778)4            Sar=1368 W/m²                                                                  S=342W/m²
                =6.32x10⁷W/m²

                                 Sun radius=6.96X10**9m, Sun distance=1.496x10**12m
                                 Sun temperature=5778K, earth albedo=0.306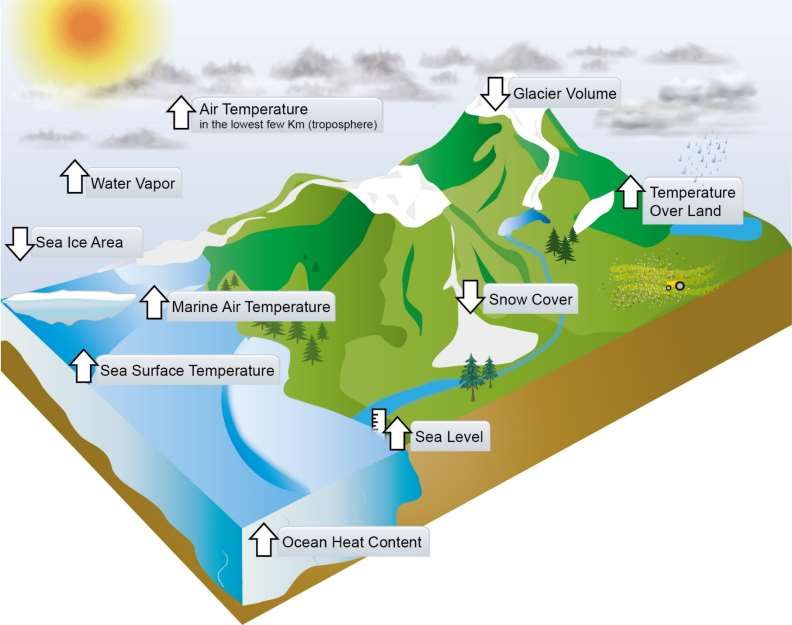
Calculating Earth’s Temperature Assuming No Atmosphere
                                                       •    The power density being absorbed by
                                                            the earth’s surface is (1-A)*S where A
 S =Sar (πRe²)/(4πRe²)                                      is the Earth’s albedo, eg its reflectance
                                                       •    If the earth is in thermal equilibrium it
 S=342W/m²                                                  will emit all of the energy it is
                                                            receiving form the sun
                                                       •    Thus the power density of emitted
                                                            radiation assuming no atmosphere is
                                                            G= σTe⁴ where Te is the temperature
                                                            at the earth surface
                                                       •   This works out to be Te=254.4K which
                                                           is about -18C and it is not likely that
                                                           life could exist in this environment
                                                       •    Thus, the earth absorbs the solar short
With A =0.306                                               wave radiation in the visible and uv
                                                            and re-emits at a much lower
(1-A) S=237W/m²                     Te                      temperature in the long wave infrared

Pe=(1-A) S= 237W/m²        G=237W/m²
                                                     Without an atmosphere Earth
                    Te=(G/σ)1/4=254 K =-18C =-0.4F   would not be inhabitable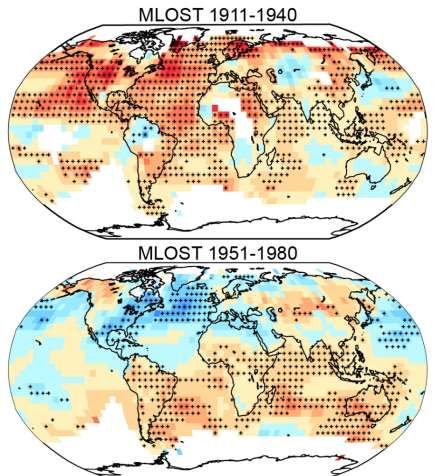
Calculating Earth’s Temperature with a Perfectly Absorbing Atmosphere
    S=342W/m²                                                        • Assume that the earth has an atmosphere
                                                                       that absorbs all of the longwave IR
                                                                       radiation that the earth emits and back
                                                                       radiates all of it with half going into space
                                                                       and half to the earth’s surface and the
                                                                       earth absorbed all of this
                                                                     • Then the total absorbed power (1-
                                                                       A)S+H=474W/m² which is 237.33W/m²
                                               H=G/2=237W/m²           from the Sun in shortwave(eg visible and
(1-A) S=237W/m²                                                        some uv) radiation and 237.33W/m² in
                                                                       longwave IR radiation from the
                                                                       atmosphere
 Pe=(1-A) S+G/2=                G=474W/m²
 474.65W/m²              Te=(G/σ)1/4=302.5K =29.5C=85.1F

       • The earth’s temperature works out to be 29.5C vs -18C with no atmosphere and this is the
         essence of the “greenhouse effect”
       • If the atmosphere only absorbs 77% of the Earth’s radiation the Earth’s temperature is 13C
         or 55.4F which is about the actual average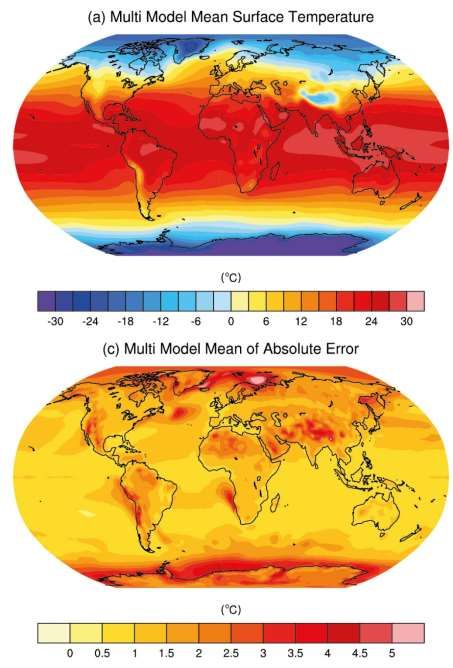
Does the Greenhouse Effect Violate the
                        2nd Law of Thermodynamics
• A simplified version of the 2nd law says a colder body cannot warm a warmer body and the
  atmosphere is colder than the Earth(1)
• However, the Sun warms the Earth and the Earth is the source of the heat that heats the
  atmosphere so the net heat is flowing from the earth
• The atmosphere acts like the Earth’s “blanket” causing some of the heat to be retained due to
  the back radiation from the atmosphere
• This is analogous to a person using a blanket in a cold room to loose less heat
• If the Earth was not producing heat, the atmosphere would have no effect just as a blanket on
  a cold stove does not cause the stove to get warmer
• Heat must be produced by the Earth or the stove for there to be an effect
• Similiarly, a person coming in to a house at 72F from outdoors at 20F feels warmer even
  though the house at 72F is cooler than the person at 98.6F because less heat is lost

In summary, the Greenhouse Effect is critical to life on Earth and at
the same time a too large Greenhouse effect leads to Global Warming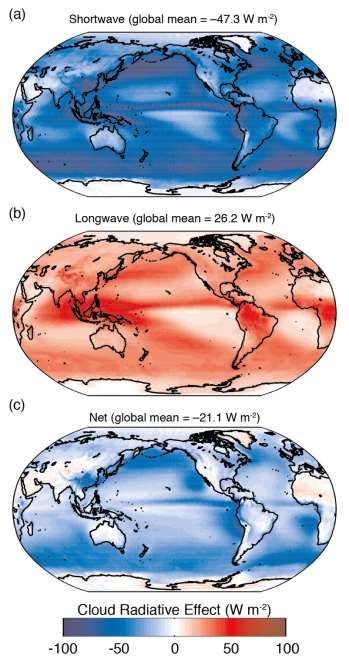
The Measured Greenhouse Effect
• As an answer to the skepticism about the greenhouse effect,
  actual measurements have been made
• The upper graph is the measured back long wave radiation
  from the atmosphere reaching the earth’s surface(1),(2)
• The absorption of this back radiation from the atmosphere
  accounts for the observed Greenhouse effect
• The lower graph are measurements of the change in the
   outgoing spectrum from 1970 to 1996 due to trace gases. (3)
• The measurements were done by the IRIS NASA satellite and
  by the Japanese IMG satellite
• This difference is a measurement of the increase in the
  Greenhouse effect
• When analyzed, this results in a 1.0-2.2 C increase in the
  surface temperature(1) which is in the actual range
The Actual Greenhouse Effect                                     • The diagram (1)shows the actual results
                                                                               of detailed calculations and includes
                                                                               many more effects than the simple
                                                                               model
                                                                             • The first difference is that 67W/m² of
                                                                               the solar radiation is absorbed by the
                                                                               atmosphere and clouds
                                                                             • Thus only 168W/m² reaches the surface
                                                                               vs 237W/m² in the simple model
                                                                             • Because of the increased absorption in
                                                                               the atmosphere and clouds 324W/m² is
                                                                               back radiated to the earth vs 148W/m²
                                                                               in the simple model
                                                                             • The third difference is that in the
                                                                               complete model 104W/m² is lost from
                                                                               the surface because of thermal
                                                                               radiation from volcanos and evaporative
                                                                               processes

• The net infrared emission from the earth for the complete model G= 388W/m² compared with G=385W/m² in the
  simple model
• That they are virtually the same is not an accident as the total emission from the earth is what determines the
  earth’s temperature of 14C via the Stefan Boltzmann law where Te=(G/σ)1/4=287K or 14C
Planetary Surface Temperatures Provides More
Information About the Greenhouse Effect
• The table gives a summary of the surface
temperatures both calculated and
measured (1) for the terrestrial planets
• The top row gives the temperature for the
planet assuming it does not have an
atmosphere based on using the black
body calculation shown earlier for earth
• The second row gives the measured
surface temperature and the agreement
for Mercury and Mars is very good
• Earth gives reasonable agreement with
the one layer model
• Venus with its dense atmosphere gives poor agreement with the no atmosphere assumption
• The incident power from the sun for Venus is 2643W/m²
• The power absorbed at the surface is 132W/m² for an albedo of 0.8
• The one layer model gives a surface temperature of 260K which is much too low and even with
a zero albedo the result is 390K which is also too lowVenus’s Surface Temperature • However, Venus has such a dense atmosphere that the underlying assumption that the short wavelength solar radiation reaches the surface is a very bad approximation • In fact a better assumption may be that the solar radiation is fully absorbed at the top of the atmosphere • Then using the no atmosphere model for the top of Venus’s atmosphere(TOA) P=σTtop⁴ gives a temperature of 210K using 132W/m² for the solar radiation • The measured top of the atmosphere from the Magellen satellite is 220K in good agreement with the above(1) • The key question is how the 730K surface temperature can be reconciled and the conventional answer found throughout the literature is that Venus has a “runaway” Greenhouse Effect
The Runaway Greenhouse Effect
                                                     • In a situation where the surface of a planet has a large
                                                       source of water a positive feedback effect can occur
                                                       where the surface temperature can increase
                                                       dramatically(1)(2)
                                                     • There is a limit to the power that a water saturated
                                                       atmosphere can emit and is about 330W/m² (3)
                                                     • If a steady state situation demands more heat emission
                                                       than this the surface temperature can rise to over 1000K
                                                       and a runaway situation can exist until all of the water is
                                                       evaporated
                                                     • This almost certainly happened on Venus in its past and
                                                       there is a key clue here

• Venus has a hydrogen/deuterium ratio of 100 compared to 10,000 on earth(4)
• This can be explained if Venus started out with similar water content as earth but lost 99.9% of its
  water due to a runaway greenhouse effect and because of a lack of magnetic field solar wind particles
  disassociated the water into hydrogen, deuterium, and oxygen with the lighter hydrogen atoms
  escaping preferentially
• Because of a lack of water Venus has no plate tectonics and there is no sequestration for CO2 so all of
  it is in the atmosphere making up 96% of the total and resulting in a very dense atmosphere
• The runaway greenhouse effect may have Venus’s High Surface Temperature
resulted in a very high surface temperatures at
one time but it does not explain why the surface
is at 730K today(1,2,3)
• The answer is that Venus’s atmosphere is largely
a closed system receiving little heat in or out and
thus is adiabatic
• The lapse rate (temperature change with
altitude) for a dry adiabatic system is 7.8K/km(4)
for CO2
• Taking this lapse rate and an atmosphere of
65km(5)(6) with the temperature there at 220K,
the surface temperature is 727K which is very
close to the measured value of 730K
• This results in a surface pressure of 92 times that
on earth(2)(3)
If earth had a similar atmosphere it would also have a very high surface
temperature and pressure, thank goodness for plate tectonicsHow Do We Know that the Climate is Warming
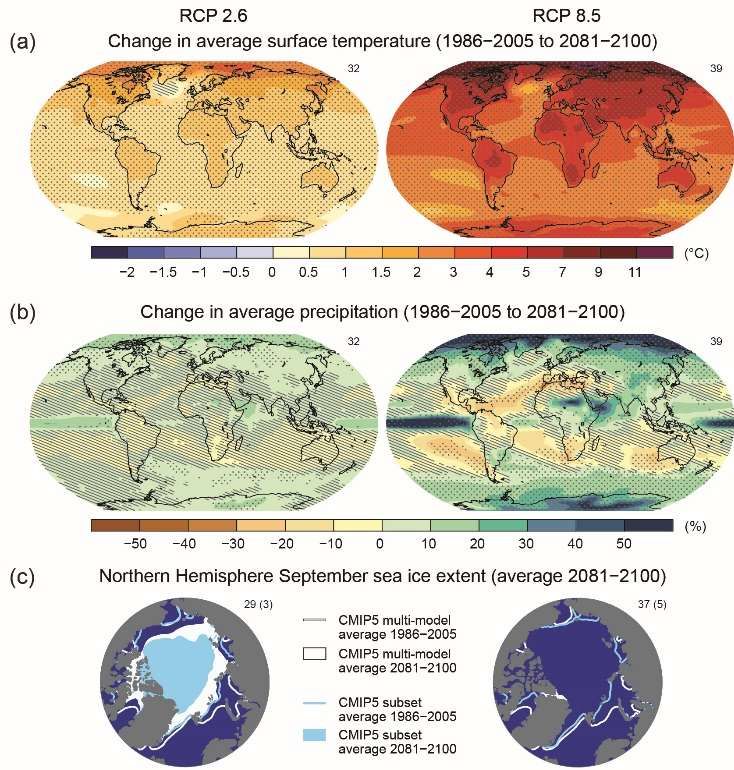
Historical Climate Change
• The land surface temperature since the late 19th century has
  increased by 0.85C and the last three decades have been
  successively warmer than any in the past with the 2000 decade
  being the warmest
• The warming trend has increased since 1950 with a 0.72C increase
  based on 7 data sets
• Significant increases are also seen for sea surface
  temperature(0.8mm/year) and marine air temperature
• One of the biggest concerns is the rise in sea level driven by a
  reduction in global glaciation
• Both Greenland and Antarctic have contributed 0.25-0.99mm/year
  increase in sea level from 1971 to 2010(1)
• Land storage of water does not seem to have changed
• The Arctic sea ice extent has decreased 3.5% to 4.1% per decade
  with a range of 0.45 to 0.51 million km2 loss per decade(2)
• The total since 1950 the total loss is 4 million km2
Latest Data on Global Temperatures

                                                                                      2016
                                                                                      2017
                                                                                      2015
                                                                                      2014
                                                                                      2013

• The previous temperature profile was seen by some to show       • Looking at the last 5 years, there has been a
  a roll-off in the 15 years previous to 2013 when the previous     significant and continuous rise in global
  data was compiled                                                 temperatures(2)
• However, when more recent data was added as seen above          • Before 2013 the temperatures had rolled off
  the curve has made a noticeable uptick resuming its rapid         but now it is seen as a normal fluctuation
  temperature rise since 1980(1)                                    that has been seen many times before
Polar Amplification
• Climate system feedbacks that contribute to recent polar
amplification include the(1)
• reduction of snow cover and sea ice
• changes in atmospheric and ocean circulation
• the presence of anthropogenic soot in the Arctic
environment,
• increases in cloud cover and water vapor
• Overall, sea ice changes are thought to be the major
source of polar amplification
NASA GISS temperature trend
2000-2009, showing strong arctic
amplification(1)Rate of Change in Temperature Across the Globe
Sea Ice and Glacier Changes
• There has been continued ice mass loss in both the
  arctic and the Antarctic and this has come from
  glaciers and ice sheets
• This has resulted in 28mm in sea level rise and
  represents 10,000 Gt of ice in the last 20 years
• The Glaciers in Antarctica are increasing except in the
  Weddle sea
• However, in Greenland the ice loss went from 34 Gt/yr
  in 1992-2001 to 215 Gt/yr in 2002-2012(1)
• This came from surface melt and runoff and
  accounted for 0.09 to 0.59mm/year sea level increase
                          • In the last decade the largest
                            contributions to global glacier
                            loss were from Alaska, the
                            Canadian arctic, and the
                            periphery of the Greenland ice
                            sheet, and the Andes and Asian
                            mountains
                          • These accounted for 80% of the
                            total ice loss
Glacier Terminus Shrinkage(scale is 1000’s meters)
1990                        Earth System Climate Models
        • The figure shows the increase in resolution of climate modeling in four
          generations of IPCC reports spanning 1990-2007
        • The 4th generation Atmosphere Ocean General Circulation
          models(AOGCM) which were used in the 2007 report include an
 1996     incredible array of complex process including
            •   Atmosphere effects of convection, clouds, aerosol and boundary layer effects, radiation
            •   Land effects of vegetation & soil type, moisture, snow, temperature feedback
            •   Sea ice effects of different albedos for bare ice, melting ice, snow covered ice, open water
        • The 5th generation Earth System Models(ESM)(2) include all of the 4th
          generation processes but add feedbacks among physical, chemical and
2001      biogeochemical processes
            •   Climate influences on sources and sinks of CO2 and CH4, eg the carbon and methane cycles
            •   Aerosol particles and their interaction with clouds and radiative transfer and the sulfur cyc
            •   Interactive time varying stratospheric ozone concentrations and chemistry

 2007     Many of the effects of the greenhouse gases and other factors such
          as clouds and aerosols are expressed in terms the change in energy
          density in the atmosphere
          This is called Radiative Forcing and is expressed in W/m²
Cloud Radiative Effect • One of the major issues influencing radiative fluxes in the atmosphere are the effect of clouds in absorbing or emitting radiation • The plots on the left are the measured CRE from the for (a)shortwave(from the Sun) , (b) longwave radiative(from the atmosphere), and (c) the net radiative effect • The plots on the right show the zonal averages for the CRE for two different measurements in black, the CMIP5 model mean in red, and individual models in gray • There is also a wide variation between individual models seen in the zonal comparison and the CRE shows up as the biggest cause of differing climate projections from the various models • Improvements are being sought in the areas of fractional coverage of clouds, their vertical distribution, as well as their ice and water content
Aerosol Caused Climate Effects

• Atmospheric aerosols come from natural and
  anthropogenic sources such as volcano’s, air
  pollution (SO2), smoke and airplane contrails
• Aerosols scatter and absorb light and also serve as
  condensation and ice nucleation sites, on which
  cloud droplets and ice particles can form
• Aerosol particles can also affect clouds making them
  brighter so they reflect more light
• Climate models account for these indirect effects
  separately as radiation interactions and cloud
  interactions(1) and are quantified as Effective
  Radiative Forcing(ERF)
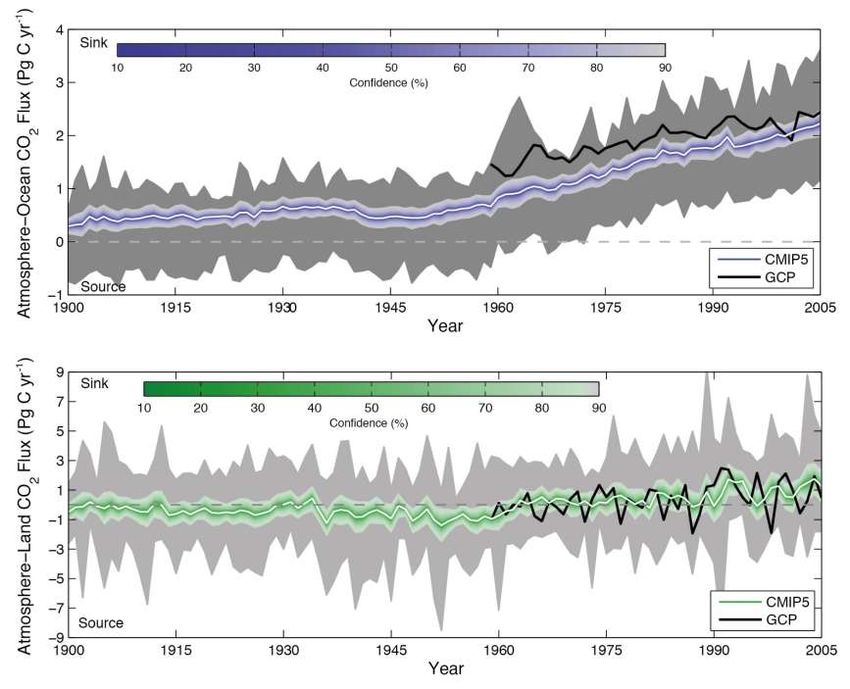
Carbon Cycle
Modeling in IPCC5
• One of the improvements
  in IPCC5 modeling over
  IPCC4 is inclusion of the
  carbon cycle
• The graphs(1) show the
  amount of CO2 either
  stored(sinked) in the
  ocean(top) or the
  land(bottom) or
  emitted(sourced) in giga
  tons/year
• The solid line are
  estimates from the Global
  Carbon Project(2)
IPCC5 ESM Model Results
• Figure shows the observed and simulated mean
  surface temperature changes where the black line
  is the observed data(referenced for 1961-1990)
• The top graph is for the ESM models with each
  model shown separately and the red line being
  the CMIP5 mean(Coupled Model Intercomparison
  Project)
• While the overall fit is very good most of the
  models over estimated the temperature rise in the
  last 15 years
• The lower graph shows the distributions of
  observed versus model results over different
  periods
• As can be seen the overall accuracy from 1951-
  2012 is very good
• The models under predicted the temperature over
  the 1984-1998 period while they over predicted in
  1998-2012
Latest Data on Global Temperatures

                                                                                    2016
                                                                                    2017
                                                                                    2015
                                                                                    2014
                                                                                    2013

• The previous temperature profile shows a roll-off in the 15   • Looking at the last 5 years, there has been a
  years previous to 2013 when the previous data was               significant and continuous rise in global
  compiled                                                        temperatures(2)
• However, when more recent data was added as seen above        • Before 2013 the temperatures had rolled off
  the curve has made a noticeable uptick resuming its rapid       but now it is seen as a normal fluctuation
  temperature rise since 1980(1)                                  that has been seen many times before
Calculations and Errors for Mean Temperature and Mean Precipitation
• Top left plot is the mean surface
temperature at 2 meters
between 1980 and 2005
calculated as the mean of all
ESM models
• Top right plot is the mean
precipitation between 1980 and
2005 calculated as the mean of
all ESM models
• The bottom plots are the error
of the model from observations
• There is “high confidence” that
the large scale patterns of
surface temperature are well
simulated except over the
Himalaya’s, Andes, and the polar
regions where the errors in
measurement are the largest(1)
• The precipitation the broad
scale precipitation patterns are
in “modest” agreement(1)
except for the tropicsObserved & Modeled Sea Level Change
• The first graph shows the observed from
4 data sets(colored lines) and modeled
changes in sea level from 1900 and 2010
and the solid red line is from satellite
altimeter data which began in 1993
• The solid line is CMIP5 model average for
the sea level rise due to thermal
expansion of the ocean due to increases
of sea heat content
• The dashed line includes the thermal
expansion model plus the observed
contribution from glaciers and the black
dotted line includes the observed ice
sheet contributions which began in 1993
• It is interesting to note that the bulk of the rise has been thermal expansion which is 0.8mm/yr and comes from the upper
700m of the sea(1)
• Together with the glacier contribution this explains 60% of the rise for 1901-1990 but 90% of the observed rise since
1990(1)
• The ice sheet contributions have the potential to increase substantially but they are relatively small now so do not test
the models going forward(2)Sea Ice Extent Observed and Modeled
• Mean sea ice extent is shown for 1980-1999 comparing models from
2007(CMIP3) and 2013CMIP5) with observations
• Definite improvement is seen in predicting summer sea ice in the
Arctic and winter in the Antarctic
• Sea ice distribution in
the Arctic and Antarctic
in both March(left) and
September(right)
• The color is a measure
of how many models
correctly predicted the
extent of 15% or more
ice coverage
• Red lines are the
observed distribution
with good agreement
except summer ice
extent in the AntarcticChanges in Temperature
Extremes
• Inaddition to a global warming in
the average temperatures there
is a significant trend in the
warming of the extremes in day
and night time temperatures
• The red and blue lines are the
model averages for the 2013 and
the 2007 models
• As can be seen there is good
agreement with the data
• Inaddition to the temperature
extremes there will be more
adverse weather extremes
• In 2017 there were 16 events
costing over $1 B each for a total
of $360 B.
• The past average was 5 such
eventsRadiative Forcing Changes from 1750 to 2011
• This chart(1) is the change in anthropogenic forcing during the
Industrial Revolution
• It lists all of the greenhouse gases by the size of their net
radiation in W/m2 and the error bars associated with each
specie
• The effects are grouped into catagories, well mixed long lived
greenhouse gases, short term GH gases, and aerosols which
have a cooling effect
• Ozone is treated in two different ways with the first as a gas in
the stratosphere which largely absorbs uv radiation and has a
cooling effect
• It also is shown with methane and with gases from air pollution
precursor sources where it is created by the chemistry in the
troposphere when exposed to sunlight(2) and acts as a
greenhouse gas
• The error bars show the uncertainty with the main issue
coming from the aerosols because of their complex
interactions with the solar radiation and cloudsAnthropogenic and Natural Radiative Forcing • Figure shows the natural and anthropogenic radiative forcings from 1750 to 2011 • Effects not addressed such as volcanic eruptions and solar variations are shown • The solar irradiance variations follow the sunspot cycle (1) • There is a small warming effect of black carbon on snow(0.04W/m2), airplane contrails(0.01W/m2), and stratospheric H2O(0.7W/m2) (2) • The relative sizes of the ozone tropospheric ozone warming effect and the stratospheric cooling are shown showing a net warming effect • There is also a cooling effect due to increases in the earth’s surface albedo from changes in land use • Effects of the aerosol radiative and cloud interactions are shown and are a strong cooling effect partially offsetting the greenhouse warmings effects(3)
Sea ice extent                Observed and Simulated Global
                                               Large Scale Climate Changes(1)
                                                   • Arctic and Antarctic September
                     Ocean                           sea ice extent
                     Heat
                     Content
                                  Ocean Heat       • Ocean heat content
                                  Content
                                                   • Continent temperature rise
                                                   • Modeled with natural forcings
                                                     alone(blue)and then total
Sea Ice Extent                                       forcings(pink) including
                                                     anthropogenic forcings
Climate Models Summary
• The figure shows the correlation (a measure of pattern
similarity) between observed and modelled temperature and
precipitation for three generations of models.
• The figure illustrates the ongoing, albeit modest, improvement.
It is interesting to note that both the poorest and best
performing models demonstrate improvement
• From this and the previous slides it can be seen that the
models are doing an amazing job in modeling all matter of
climate processes
• Average surface temperature on land and water and
combined
• Actual temperatures patterns across the globe
• Actual precipitation patterns across the globe
• Changes in the number of coldest and warmest days and
nights
• Ice sheet and glacier growth and loss as well as the details
of ice extent throughout the seasons
• Sea level changes, sea temperature, and sea heat content
The figures show a summary of results from the last • Detailed cloud effects and aerosol effects and interactions
three CMIP (Coupled Model Intercomparison Project)
models done in 2000, 2007, and 2013Future Climate Change Projections • Four climate forcing scenarios have been developed called Representative Concentration Pathways(RCP’s) where emissions and socio economic scenarios are developed in parallel, building on different trajectories of radiative forcing over time(1)(2) • RCP8.5:This RCP is characterized by increasing greenhouse gas emissions over time hitting 8.5 W/m2 in 2100, representative of scenarios in the literature that lead to high greenhouse gas concentration levels • RCP6:It is a stabilization scenario in which total radiative forcing is stabilized shortly after 2100 at 6 W/m2, without overshooting the long-run radiative forcing target level • RCP4.5:It is a stabilization scenario in which total radiative forcing is stabilized shortly after 2100 at 4.5 W/m2, without overshooting the long-run radiative forcing target level • RCP2.6: It is a “peak-and-decline” scenario; its radiative forcing level first reaches a value of around 3.1 W/m2 by mid- century, and returns to 2.6 W/m2 by2100. In order to reach such radiative forcing levels, greenhouse gas emissions (and indirectly emissions of air pollutants) are reduced substantially, over time
Projections of Temperature, Northern Sea Ice Extent, and pH
  • The plots are the projected mean global temperature and northern sea
    ice extent for scenarios RCP 2.6 and RCP8.5
  • For the temperature graph the change is relative to the mean from
    1986-2005
  • The number of models used are shown and the colored area reflect the
    range of models used
  • The global mean temperature for the period 2016-2035 will likely be in
    the range of 0.3C to 0.7C(1)
  • For the period of 2081-2100 it is likely that for RCP2.6 the increase will
    be 0.3C to 1.7C, for RCP4.5 between 1.1C to 2.6C, for RCP6.9 between
    1.4C to 3.1C and for RCP8.5 between 2.6C to 4.8C
  • It is virtually certain that heat waves will occur with more frequency and
    duration
  • Except for RCP2.6 warming will continue beyond 2100
  • The dashed line in the sea ice represents nearly ice free conditions
  • As can be seen the RCP8.5 scenario the arctic will be become ice free in
    September by 2050
  • The oceans are becoming more acidic due to increased dissolved CO2
  • The ocean’s surface layer (the top 100 yards or so) could lose 50 percent
    of its carbonate ion by the end of this century unless we reduce
    emissions dramatically.(2)
  • Marine animals will find it harder to build skeletons, construct reefs, or
    simply to grow and breathe.
Worldwide Change in Temperature, Precipitation, and Sea Ice,
• The effects shown are for the period of 2081-2100
for the scenarios RCP2.6 and RCP8.5 relative to
the period 1986-2005
• High latitudes and the equatorial Pacific will likely
see an increase in precipitation for RCP8.5 while in
many mid-latitude and sun-tropical dry regions
precipitation will likely decrease(1)
• Extreme precipitation events over most mid
latitude areas will become more intense and be
more frequent
• Areas encompassed by monsoon’s will likely
increase and monsoons will likely intensify due to
an increase in atmospheric moisture
• In the Antarctic, a decrease in sea ice extent and
volume is projected with low confidence for the
end of the 21st century as global mean surface
temperature rises.
• By 2100 the global glacier volume, excluding
glaciers on the periphery of Antarctica, is
projected to decrease by 15 to 55% for RCP2.6,
and by 35 to 85% for RCP8.5 (medium confidence)Reducing Pollution Increases Radiative Forcing Due to Aerosols 2030, 2100
• The figures show the aerosol projections for 2030
and 2100 for scenarios RCP2.6 and RCP8.5 relative
to 2000
• Most components of aerosols and ozone precursors
are estimated to decrease toward the end of this
century in the RCPs except methane in RCP8.5(1)
• Early in the century, on the other hand, both
scenarios indicate increased negative aerosol
forcing over South Asia, with reversal between
2030 and 2100.
• The ERF in 2100 shows positive values relative to
2000 in North America, Europe and Asia even with
RCP8.5, which indicates the aerosol forcing is
projected to approach to the pre-industrial level.
• This is in marked contrast to 2000 seen earlier for
which there was a large negative forcing of -
1.17W/m2 so with less aerosols there will be less
offsetting of the global warming as exists nowGlobal Sea Level Rise • Under all RCP scenarios, the rate of sea level rise will very likely exceed that observed during 1971 to 2010 due to increased ocean warming and increased loss of mass from glaciers and ice sheets.(1) • Global mean sea level rise for 2081–2100 relative to 1986–2005 will likely be in the ranges of 0.26 to 0.55 m for RCP2.6, 0.32 to 0.63 m for RCP4.5, 0.33 to 0.63 m for RCP6.0, and 0.45 to 0.82 m for RCP8.5 (medium confidence) • In the RCP projections, thermal expansion accounts for 30 to 55% of 21st century global mean sea level rise, and glaciers for 15 to 35%. • While surface melting will remain small, an increase in snowfall on the Antarctic ice sheet is expected (medium confidence), resulting in a negative contribution to future sea level • Changes in outflow from both ice sheets combined will likely make a contribution in the range of 0.03 to 0.20 m by 2081−2100 (medium confidence).
Sea Level Rise • The figure shows the various components of the
sea level rise with the last component after
thermal expansion, glaciers, and ice sheets being
loss of land water storage
• It is virtually certain that mean sea rise will
continue beyond 2100 (1)
• For a radiative forcing that corresponds to a CO2
concentration that is above 700 ppm but below
1500 ppm, as in the scenario RCP8.5, the
projected rise is 1 m to more than 3 m (medium
confidence)
• Sea level rise due to ocean thermal expansion will
continue for centuries to millennia. The amount
of ocean thermal expansion increases with global
warming (models give a range of 0.2 to 0.6 m /°C).
• Studies (2) show that a mean temperature rise between 2C and 4C would result in a near-complete loss of
the Greenland ice sheet over a millennium or more, causing a sea level rise of about 7 m.
• About 3.3 m of equivalent global sea level of the West Antarctic ice sheet is grounded on areas with
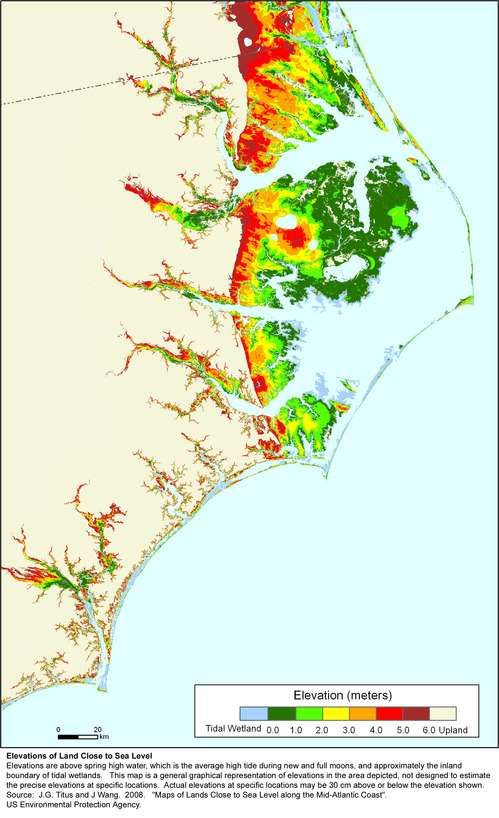
downward sloping bedrock, which may be subject to potential ice loss via the marine ice sheet instability.NRDC map
NASA
Phanerozoic Sea Level Curve• The most widely discussed climate target is to limit the surface
Climate Change Beyond 2100 temperature rise to under 2°C from pre industrial levels
• The figure shows an almost linear increase of surface temperature
with cumulative CO2 emissions from 1870 where the unit PgC is
petagrams of carbon and 1 PgC is 1000 mega tons of CO2 or 1Giga ton
• The four RCP scenarios are shown with 2040-2049(square symbol)
and the 2100(diamond symbol) milestones
• To make the 2°C goal with a probability of >33%, >50%, and >66%,
carbon emissions since 1870 must be held to about 900 PgC, 820 PgC
and 790 PgC, respectively(1)
• At present 500PgC of CO2 emissions have occurred since 1870
• There are very long time scales in achieving stabilization even if
emissions were to cease due to long time scales in the deep ocean
• This will result in a persistent warming for hundreds of years,
continuing at about the level of warming that had been realized from
a time when emissions were ceased
• Stabilization of global temperature does not imply stabilization for all aspects of the climate system.
• It is virtually certain that global mean sea level rise will continue beyond 2100, with sea level rise due to thermal expansion
to continue for centuries to millennia. (2)
• Global mean sea level rise depends on the pathway of CO2 emissions, not only on the cumulative total; reducing emissions
earlier rather than later, for the same cumulative total, leads to a larger mitigation of sea level rise.Requirements to Maintain 2 Degree C Temp Rise
• Depending on actions
between now and 2030 to
reduce CO2, future
reductions to maintain 2 C
max temperature rise can
vary significantly
• The black data bars apply
to keeping CO2 emissions
under 50 Giga tons by
2030 and the green data
is if the emissions are
greater
• The yearly required
decrease in CO2
emissions beyond 2030
vary from 3 to 6 percent
per year
• Also, by 2100 virtually all
emissions of CO2 must be
eliminatedEND
You can also read