Uganda's Technical Annex with REDD+ results from Reducing Emissions from Deforestation - Ministry of Water and Environment REDD+ Secretariat and ...
←
→
Page content transcription
If your browser does not render page correctly, please read the page content below
Uganda’s Technical Annex with REDD+ results from
 Reducing Emissions from Deforestation

Ministry of Water and Environment
REDD+ Secretariat and National Forestry Authority
April 2020

 1|Page

Uganda’s Technical Annex with REDD+ results from Reducing Emissions from
 Deforestation
 Contact Information

Okot Okidi Alfred Coordinator Climate Change
Permanent Secretary, National Forestry Authority
Ministry of Water and (NFA)
Environment Alternate National REDD+
UNFCCC NFP Focal Point
alfred.okidi64@gmail.com xavierm1962@gmail.com

Tom Obong Okello John Diisi
National Forestry Authority Coordinator, GIS and
Executive Director Mapping
tomokello@yahoo.co.uk National Forestry Authority
 (NFA)
Bob NATIFU (Mr.) National Specialist – GIS and
Ag. Commissioner Climate Mapping
Change johndiisi@gmail.com
Climate Change Department -
Ministry of Water and Edward Senyonjo
Environment Coordinator, Inventory and
Alternate UNFCCC NFP Surveys
bob.natifu@gmail.com; National Forestry Authority
bob.natifu@ccd.go.ug (NFA)
 National Specialist – Forest
Margaret A. Mwebesa Inventory, GIS and Mapping
Assistant Commissioner senyonjo.edward@gmail.com
Forestry Sector support
Department (FFSD) John Begumana
National REDD+ Focal Point Carbon Accounting, Expert,
margathieno@gmail.com Consultant
 johnbegu@gmail.com
Xavier Nyindo Mugumya

 2|Page
Contents
Introduction .................................................................................................................................................. 4
Objective....................................................................................................................................................... 8
Summary of information from Uganda’s National Forest Reference Emission Level ............................... 8
Results in tonnes of CO2 equivalent per year ............................................................................................ 10
Uncertainty analysis .................................................................................................................................... 11
Consistency between REDD+ results reported and technically assessed FREL .......................................... 13
Uganda’s National Forest Monitoring System and the institutional roles and responsibilities for
measuring, reporting and verifying the REDD+ results ............................................................................. 14
A description of how the elements contained in Decision 4/CP.15, paragraph 1 (c) and (d) have been
taken into account ..................................................................................................................................... 15

 3|Page
Introduction Uganda has established the following UNFCCC REDD+ elements reflected in decision 1/CP.16 paragraph 71 as summarised in table 1 below. Table 1: Summary of Uganda’s Readiness providing evidence of availability of the elements reflected in decision 1/CP.16 Paragraph 71. UNFCCC REDD+ elements Characteristics of the Elements Organisation to implement The institutional and Organisational arrangements for full scale implementation REDD+ of REDD+ Strategy Measurers are in place. They include: National REDD+ Management arrangements continue to function well with the policy and technical steering committees (National Climate Change Advisory Committee (NCCAC), National Technical Committee (NTC & Taskforces supported by MWE Systems) are in place The REDD+ Secretariat is strengthened and more staff have been recruited to support it in anticipation for full scale implementation Forestry Policy Review process was initiated as part of the national policy reforms proposed to address the main drivers of deforestation and forest degradation REDD+ Strategy Preparation The national REDD+ Strategy was completed with the following characteristics: The national REDD+ Strategy and implementation frameworks been reviewed and aligned with national development and international obligations with comprehensive and coherent REDD+ strategic options which are included in the Emission Reduction Programs under preparation Benefits Sharing Arrangements (BSA) and Feedback Grievance and Redress Mechanism were prepared and are ready for testing in the Emissions Reduction Program Areas. Social and Environment Management Frameworks were prepared and completed. They support safeguards information system frameworks Two Emission Reduction Programs (ER-Programs) are under preparation, they will cover the Albertine and Kyoga Water Management Zones (WMZ) areas covering nearly 55% of national territory and over 80% tropical high forests. Forest Reference Emissions Uganda submitted to UNFCCC the first assessed baseline (called Forest Reference Level/Forest Reference Level Emission Level, or FREL) in 2018 The FREL proposed by Uganda covers the activity “reducing emissions from deforestation”, which is among the activities included in decision 1/CP.16, paragraph 70. The FREL presented in the submission, for the reference period 2000–2015, corresponds to 8,254,691 t CO2 eq/year. A few areas identified by the assessment team for future technical improvement, according to the scope of the technical assessment in the annex to decision 13/CP.19 National Forest Monitoring Uganda has a prototype National forest monitoring system (NFMS) showing on System how the lead institutions (NFA, UWA) and other key institutional stakeholders, can fully monitor Forest Carbon from national to community level. It had the 4|Page
following characteristics: Forest monitoring manual that describes monitoring of all types of REDD+ activities, including monitoring of leakage; how to add more carbon pools; integration of data from different forest regimes into one central data base (as part of the NFMS), as well as an Integrated central data base (also as part of the NFMS). Activity Data collection and assessment: Land Use Land Cover Data (for forest area and forest areas change) has been collected and 6 LULC maps developed for periods - 1990, 2000, 2005, 2010, 2015 and 2017 National Forest Inventories (NFI) was done for at least 75% of the country using three data source categories: “Exploratory inventory” (In central forest reserves) and National Biomass Survey for all the other land categories. The data included in the current analysis comes from data collected since 2003 to 2019 (from the National Forest Authority). A separate soil inventory is ongoing. The data have been analyzed and is the basis for this technical annex The data generated by the mapping and inventory teams was used to prepare estimated for the LULUCF sector for our second national communication, the first bi-annual report (BUR) and new estimates will likely rd be ready for the 3 national communication. The data is being used for the preparation of the sub-national emission reduction programmes accounting requirements Proposed institutional arrangements for the NFMS completed and describes roles by all the sectors of the Ministry of Water and Environment and those outside of the ministry of water and environment. Safeguards information The design of Uganda’s safeguards information system (SIS) has been completed system (SIS) and information and its institutional arrangements agreed. It is housed in the Department of System for Multiple Benefits, Environmental Support Services (DESS) of the Ministry of Water and Other Impacts, Governance, Environment. The SIS has the following characteristics: and Safeguards It defines the goals of the country safeguards approach including the clarification of the Cancun safeguards at national level. The country is working on doing the same at district and between sectors levels We have identified the existing systems in the country and assessed their applicability for SIS and how they will be linked. Identifies indicators to provide information on how each of the criteria are being respected Proposes institutional arrangements for the SIS headed by the Ministry of Water and Environment and how it will be will be adopted to other sectors at national and subnational through enhanced stakeholder engagement Tested and installed a prototype web portal, database and reporting functions for the online SIS with plan for continuous improvement. The table below (table 2) describes some of the lessons and required improvements that Uganda will continue to address. 5|Page
Table 2: Lessons and required improvements Improvements a. Integrating REDD+ activities in mandates of Government of Uganda institutions; especially adjusting job descriptions of staff assigned REDD+ work and in other economic sectors such as agriculture, energy, wildlife, roads and infrastructure development a. Institutionalisation of a clearly-prioritized REDD+ strategy and initiation of the required jurisdictional Emission Reduction (ER) programs with strong engagement of local government, private sector and indigenous peoples and local communities and through consolidation of actors in the landscapes around the identified REDD+ Strategic Options. b. Updating the forest reference emissions level (FREL) through i. Improving the data used to make the first FREL ii. Adding reference level for other activities i.e. deforestation and forest degradation, conservation, sustainable management of forests and enhancement of forest carbon stocks iii. updating the data series, data collection and analysis, and strengthening national capacities for MRV system iv. addressing findings of the technical assessment as recorded in the report of the technical assessment of the proposed forest reference emission level of Uganda submitted in 2017 c. Improvements to national forest monitoring system (NFMS): i. Institutional frameworks that specify binding roles and responsibilities at subnational level ii. Capacity for annual Forest area change assessment (activity data) iii. Capacity for annual detection of changes in carbon stocks (emission factors) iv. Understanding of national fire regime and fire ecology, and related emission for different greenhouse gases associated with fires v. Annual or biennial gathering, storage, and analysis and reporting of forest and other data, with emphasis on carbon emissions from land use, land use change and forestry (LULUCF) as Green house information vi. Annual or regular analysis of drivers and factors of forest change vii. Completing the first forest reference emissions levels (FREL) and regularly (at least every 5 years) up-dating of the reference emission level viii. Annual National and international reporting ix. Establishing a national registry for recording activities and transactions of REDD+ activities d. Completing the establishment of a functional system for information on safeguards (SIS) and operationalizing compliance with Cancun and Warsaw agreements & frameworks under UNFCCC including: i. National validation of the so far prepared elements of the national safeguards. These are: Defined goals of the country safeguards approach which Clarified Cancun safeguards for Uganda in the form of National Safeguards Standards principles and 6|Page
criteria Proposed SIS objectives, scope and functions Identified existing systems in Uganda and assess their applicability for SIS Identified specific information needed: Identify indicators to provide information on how each of the criteria are being respected drawing from existing information systems, ESMF and other frameworks with additional indicators as needed ii. Collection, compilation and analysis of information including the development of methods and protocols for data collection and validation for each indicator as identified iii. Establishment of institutional arrangements & stakeholder participation: where we propose to identify and assign the roles and responsibilities for all safeguards information system (SIS) functions, flow of information, stakeholder participation and capacity building needs iv. Reporting and use of the information generated by the developed SIS information technology system including web portal and database, operational modalities and procedures Lessons learnt a. REDD+ has allowed the forestry sector as a both a social, economic and political point of discussion in Uganda b. The time spent in undertaking Readiness activities is related to level and adequacy of available capacities: i.e. technical, technological and financial capacities and resources c. Whereas there is availability of reasonable national capacities: current international support (procurement) arrangements do not favour the use of these national experts and capacities Main country perspectives a. Implementation is both at national and landscape level and we are using looking forward water management zones approach to implement REDD+ at the subnational levels: i. Two emission reduction programs are in preparation: 1. Albertine Water Management zone Emission Reduction Program 2. Kyoga Water Management zone Emission Reduction Program ii. Strengthening forest protection and landscape resilient project (SFLP) / Investing in Forests and Protected Areas for Climate Smart Development is also in preparation to support the Ugandan forestry sector and landscape for sustainable growth with economic and social benefits 7|Page
Objective

The objective of preparing Uganda’s REDD+ Technical Annex is to submit the data and
information required to obtain and receive payments for results-based actions, in accordance
with Decision 14/CP.19 (Modalities for measuring, reporting and verifying) through the biennial
update reports as per decision 2/CP.17, annex III, paragraph 191.

Summary of information from Uganda’s National Forest Reference Emission
Level
Table 3 provides summary information of Uganda’s technically assessed National Forest
Reference Emission Level:
Table 3: Summary of main features of the proposed forest reference emission level

Main features of the FREL Remarks
Proposed FREL 8,254,691 Uganda submitted its proposed FREL in January 2017. As a
(in t CO2 eq/year) result of the facilitative technical exchange of information
 and clarification during the technical assessment, Uganda
 submitted a modified version of its proposed FREL on 4
 February 2018

Type and duration of FREL = average The FREL is the annual average of historical CO2 emissions
FREL historical emissions associated with deforestation
 from 2000 to 2015

Adjustment for national No No adjustments for national circumstances were included
circumstances
 a
National/subnational National The FREL proposed by Uganda for the historical reference
 period 2000–2015 covers the entire national territory, with
 updates anticipated whenever improved data are available.
 b
Activities included Deforestation The FREL includes only gross emissions from deforestation
 resulting from the conversion of forests and excludes any
 subsequent emissions and removals from the deforested
 areas (see para. 11 of the technical assessment report of the
 FREL)
 b
Pools included AB, BB There is a lack of accurate data on the omitted pools. Plans
 are in place to provide data on deadwood and soils in the
 future (see paras. 30–32 of the technical assessment report
 of the FREL)

Gases included CO2 Although non-CO2 emissions were estimated for the latest
 national GHG inventory, they were not included in the FREL,
 with the justification that they are insignificant and the
 accuracy of the data is uncertain (see para. 33 of t the

1
 19. Additional or supporting information may be supplied through other documents, such as a technical annex.

 8|Page
Main features of the FREL Remarks
 technical assessment report of the FREL)
 c
Forest definition Included Land covered by trees with a minimum crown cover of 30%, a
 minimum tree height (in situ) of 4 m or the potential to reach
 it, and a minimum area of 1 ha. Seasonal woody forms,
 orchards, agroforestry and silvopastoral systems are excluded
 (see para. 35 of the technical assessment report of the FREL)

Relationship with latest Methods used for the Emissions from soils as a result of deforestation, and non-CO2
GHG inventory FREL are consistent emissions from forest fires were estimated for the latest
 with the latest GHG national GHG inventory, but were not taken into account in
 inventory (2014) the construction of the FREL (see paras. 32–33 of the
 technical assessment report of the FREL)

Description of relevant Included See paragraph 27 of the technical assessment report of the
 d
policies and plans FREL

Description of Not applicable
assumptions on future
 d
changes in policies

Descriptions of changes Not applicable
to previous FREL

Future improvements Yes Several areas for future technical improvement were
identified identified (see paras. 41 and 42 of the technical assessment
 report of the FREL)
Source: Annex - FCCC/TAR/2017/UGA Report of the technical assessment of the proposed forest reference emission level of Uganda submitted
in 2017 - Summary of main features of the proposed forest reference emission level based on information provided by the Party

Table 4 provides the specific elements to be included in the technical annex as specified
through the Annex of Decision 14/CP19, paragraph 1.
Table 4: Elements to be included in the technical annex referred to in decision 14/CP.19,
paragraph 7
FREL/FRL Element Summary information
(a) The assessed forest reference emission level and/or 8,254,691 t CO2 eq/year
forest reference level expressed in tonnes of carbon
dioxide equivalent per year (CO2 equivalent)
(b) The activity or activities referred to in decision reducing emissions from deforestation
1/CP.16, paragraph 70, included in the forest reference
emission level and/or forest reference level
(c) The territorial forest area covered National territory
(d) The date of the forest reference emission level 16 January 2017 and 4 February 2018
and/or forest reference level submission and the date
of the final technical assessment report
(e) The period (in years) of the assessed forest Historical average based on 15-year reference period
reference emission level and/or forest reference level. (2000-2015), updated whenever data are available
Source: Uganda Proposed Forest Reference Emission Level for Uganda (Revised submission 2018)

 9|Page
Results in tonnes of CO2 equivalent per year
The results of the assessment of deforestation are displayed in Table 5. Deforestation was
reduced from an average of 50,147 ha/year over the 15-year reference period (2000-2015) to
28,095 ha/year over the 2-year results period (2015-2017). The exact assessment dates for the
results period concern December 2015 – December 2017, the exact assessment dates for the
reference period concern December 2000 – December 2015.
Table 5: Deforestation per forest type assessed for the 2015-2017 period
 Deforestation Confidence Annual Confidence Interval
 2015-2017 (ha) Interval (ha) deforestation (in ha/year)
 (ha/year)
Plantation – Nonforest 1,113 1,606 557 803
land
Tropical High Forest – 7,202 4,702 3,601 2,351
Nonforest land
Woodland – Nonforest 47,874 36,182 23,937 18,091
land
Total 56,189 36,522 28,095 18,261

Uganda has used the same EF as used in the technically assessed FREL (see section ‘consistency
between REDD+ results reported and technically assessed FREL’), they are displayed in Table 6.
Table 6: Emission Factors used for the emissions assessed over the results period
Type of forest subject to deforestation Associated EF Confidence Interval
 (tCO2/ha) (tCO2/ha)
Plantations 260.2 319.8
Tropical High Forest 526.4 36.4
Woodlands 91 6.5

The emissions over the results period are assessed by multiplying AD x EF. The resulting
emissions are displayed in Table 7.
Table 7: Emissions assessed over the results reporting period 2015-2017
 Confidence Interval Confidence
 Emissions (tCO2/yr) (tCO2/yr) Interval (%)
Plantation – Nonforest
land 144,801 274,460 190%
Tropical High Forest –
Nonforest land 1,895,566 1,244,495 66%
Woodland – Nonforest
land 2,178,267 1,653,682 76%

Total 4,218,635 2,087,764 49%

 10 | P a g e
The emission reductions are assessed by subtracting the emissions over the results period from
the FREL. These results are provided per year and cumulative in Table 8.
Table 8: Emission reductions for the years 2015-2016 and 2016-2017 assessed against the FREL
 Technically assessed Emissions assessed Emission reduction
 FREL (tCO2/yr) 2015-2017 (tCO2/yr) (tCO2)

2015-2016 8,253,982 4,218,635 4,035,347
2016-2017 8,253,982 4,218,635 4,035,347
Total 8,070,694

Uncertainty analysis

The uncertainty of both the biomass estimates in the inventory data (for the EF calculation),
and the area estimates for the AD calculation concern the 90% confidence interval calculated
based on the sampling error. For the emission factor furthermore the error in the carbon
fraction and the error in the use of the root-to-shoot ratio have been considered. The sampling
error for the biomass estimates are provided in Table 9.
Table 9: Sampling error for tropical high forest and woodlands biomass assessments
Stratum no 1&2 3&4 5
Stratum name Plantations Tropical High forests Woodlands
Data source NFA statistics EI, NBS, PSP EI, NBS
Number of plots - 15 047 1 169
Number of trees (/ha) - 234.4 278.3
AGB (t.d.m./ha) 121.7 246.2 42.6
AGB (t.d.m.) - 0.77 0.61
T-value - 1.645 1.646
AGB, CI lower -
(t.d.m./ha) 244.9 41.5
AGB, CI upper -
(t.d.m./ha) 247.4 43.6
AGB, Relative CI (%) 148%* 0.5% 2.4%
 * IPCC (2019), see Table 10

For the carbon contents in plantations, Uganda has used an IPCC default value and therefore no
sampling error is available. We assume a default uncertainty of +/- 148% around the average plantation
biomass estimate based on IPCC 2019 to allow the calculation of the overall uncertainty around the
emission estimate. The lower end of the confidence interval would actually be 100% since the emission
from plantation conversion cannot be negative. Emissions from the conversion of forest plantations to a
non-forest land use only contribute 3.4% of the overall emissions from deforestation so the large
majority of the uncertainty assessment is based on the country specific sampling error.

 11 | P a g e
For the emission factor furthermore the error in the carbon fraction and the error in the use of the root-
to-shoot ratio have been considered using default values provided by IPCC (2006) as provided in Table
10.
Table 10: Default uncertainty values around the carbon fraction and root-to-shoot ratio used to
estimate BGC based on the AGC contents
 Default error (90%
 confidence interval)
 used in the error
Assumptions propagation Source
Carbon fraction 6% Table 4.3, IPCC 2006
 Table 4.4, IPCC 2006 Average of the
root-shoot-ratio 23% higher and lower range provided
 Table 4.8, IPCC 2019
 This table suggests a default standard
 deviation of 90%, which corresponds to
Plantation AGC 148% a 90% confidence interval of +/-148%

After the uncertainties of each component are assessed, the total uncertainty of the emissions was
calculated through the ‘propagation of error approach’ and by using the generic equations given in the
IPCC GL 2006, but modified so that the uncertainty components (i.e., confidence intervals) are given in
absolute numbers, rather than percent uncertainty.

Below the error propagation equations for multiplication and addition are provided. The error
propagation for multiplication was used e.g. for emission estimate per forest type (AD x EF), and the
conversion of AGB to AGC. The error propagation for addition was used e.g. for adding the emission
estimates per forest type, and adding AGC and BGC for the EF.

 - Error propagation for multiplication of several components:

 1 2 2 2 2
 = 1 ∙ 2 ∙ ⋯ ∙ √( ) + ( ) + ⋯ + ( )
 1 2

 - Error propagation for addition or several components:

 = √ 1 2 + 2 2 + ⋯ + 2
 where:
 o is the confidence interval propagated from the operation
 o 1 , 2 , ⋯ , are the mean values of each of the components in the operation
 o 1 , 2 , ⋯ , are the confidence intervals of each of the components in the operation

 12 | P a g e
Consistency between REDD+ results reported and technically assessed
FREL

Uganda has assessed results applying a methodology that is consistent with the methodology used for
assessing emissions over the reference period for the technically assessed FREL. The activity data was
collected using a stratified area estimator, where Uganda used a change map to stratify the sample
distribution. The estimate is based on the samples. The sample size was 4,932 sample plots.
To ensure the highest possible quality of the data, QA/QC procedures included extensive training of the
technical specialist and rechecks of the quality of the reference. Training involved remote sensing and
land use experts with decades of knowledge on land use and land use change assessment using field and
remote sensing data. For quality assurance purposes, these same experts collected data for the FREL
and they ensured new specialists where provided with consistent training. The remote sensing
specialists conducted field visits in different vegetation zones to calibrate how satellite imagery was
interpreted in relation to the ground information. The land use definitions were reviewed and examples
of different land use classes were provided. Clear interpretation rules were established to define how
the remote sensing imagery corresponded to the land use definitions. The sample data collection was
completed in the same physical location so the interpreters could easily discuss uncertain plots and
maintain consistency between interpretations. For each of the sample plots, the interpreters specified
their confidence of their interpretation. Low confidence samples were rechecked by a second
interpreter and if the land use change class was still undecided, they were reviewed as a group with
assistance from land use experts. The sample data was compared with the map data and a second
interpreter rechecked all omission errors in the sample data as a quality control measure.
Since the submission of the modified FREL in February 2018, Uganda has collected improved data from
the National Forest Inventory. However, in order to remain full consistency with the technically assessed
FREL for the calculation of emissions over the results period, Uganda used the same emission factors as
the FREL.
Emission Factors of Uganda’s FRL submission in 2018 have been produced by using data from the NFI
from 2003 to 2016. The NFI field operations have in the meantime been completed and reported in
2019.

The fieldwork from 2017 to 2019 continued as planned in the natural forests in protected areas and in
the northern part of the country where the largest part of the woodland areas are present.

The results have been calculated and differences are observed in the average woodland and tropical
high forest carbon estimates. For complementing the measurements in woodlands, data is collected
mostly outside the protected areas, in locations characterized by high variability and lower biomass
because of the high anthropogenic impact. In tropical high forest, instead, the complementary
measurements were mostly in protected areas which are less degraded. As such, the updated value for
woodland is lower and that for tropical high forest is higher than the initial values used in the technically
assessed FREL. The updated average AGC for woodlands is 15.7 ± 0.84 t*ha-1 (instead of 20 t*ha-1) while
the updated average AGC for tropical high forest is 143.5 ± 2.74 t*ha-1 (instead of 115.7 t*ha-1).
With the new woodland and tropical high forest biomass estimates, the woodland EF would be 21%
lower and the tropical high forest EF would be 24% higher than the current used values consistent with
the technically assessed FREL. If these updated values would have been used in both the FREL and the

 13 | P a g e
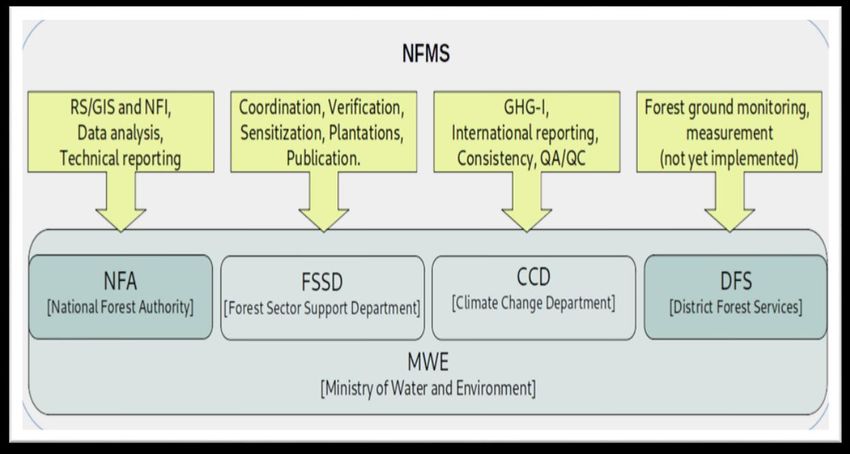
results assessment, the emission reductions would have been 6.4% higher. Therefore, we can conclude
that these new results do not have a significant impact on the REDD+ results reported in this technical
annex and using the EF from the technically assessed FREL slightly underestimates results.

Uganda’s National Forest Monitoring System and the institutional roles and
responsibilities for measuring, reporting and verifying the REDD+ results

Uganda’s NFMS can currently be considered as functional even if not yet completely sustainable.
In terms of Institutional Arrangements, the REDD+ national strategy provides for the Ministry of
Water and Environment (MWE) the lead mandate for the overall REDD+ implementation and
coordination, budgeting and resource mobilization, the monitoring and evaluation, reporting
and policy standards, regulation implementation.

Within the Ministry of Water and Environment (MWE), the NFMS is currently led and
coordinated through the REDD+ National Focal Point of the Forestry Sector Support Department
(FSSD). The REDD+ secretariat is under FSSD and its function is project based.

The Forestry sector in Uganda is under the Directorate of Environment Affairs (DEA) within the
Ministry of Water and Environment (MWE). Management is delegated to three main institutions:
FSSD, the National Forestry Authority (NFA), and the District Forestry Services (DFS). Uganda
Wild life Authority (UWA) manages the forests under its jurisdiction for tourism and
conservation purposes. UWA seeks for technical support from NFA under FSSD if deemed
necessary.
The Climate Change Department (CCD) of MWE provides oversight on National Green House
Gas Inventories within the forestry sector and other sectors.

The NFMS technical functionality is currently almost entirely covered by the NFA, a semi-
autonomous institution established in 2003 under the section 52 of The National Forestry and
Tree Planting Act and was launched on the 26th April 2004.

Current key roles and responsibilities in NFMS
Institution Mandate
Forestry Sector Support Department Overall REDD+ implementation and coordination,
(FSSD) budgeting and resource mobilization, Monitoring and
 Evaluation, reporting and policy standards,
 regulation implementation.
Climate Change Department (CCD) National focal point for the United Nations
 Framework Convention on Climate Change.
 GHG-I focal point institution.
National Forest Authority (NFA) Delegated by the FSSD for technical implementation
 of the NFMS: National Forest Inventory
 implementation, analysis and reporting, Activity Data

 14 | P a g e
(Forest, Forest Changes, Forest Degradation) analysis and reporting. A description of how the elements contained in Decision 4/CP.15, paragraph 1 (c) and (d) have been taken into account The elements contained in Decision 4/CP15 paragraph 1 (c) and (d) have been taken into account as follows: Uganda has used the most recent IPCC guidance and guidelines, this is mostly IPCC 2006 (see the references in this chapter for different components) and for the approximation of uncertainty around the plantation carbon contents estimate the 2019 refinement is used. Uganda has established a robust and transparent NFMS as described under the previous chapter. Robustness is ensured through the statistical design of the sample unit data collection, which provides estimates that are representative for the entire national territory, both for the AD and EF. E.g. emission factors are based on a national forest inventory, which provides national values that are based on a statistically representative sample distribution and not based on a local inventory that may be biased or not be representative. Transparency is ensured through the provision of details in the data collection process such 15 | P a g e
as sampling design and labeling protocol and through the provision of confidence intervals around the estimates of EF and AD. As detailed out in the previous chapter, the NFMS uses a combination of remote sensing and a ground-based forest carbon inventory. The NFMS provides estimates that are consistent, as far as possible accurate and reduce uncertainties. The NFMS gives deforestation estimates based on sample unit assessments which are efficiently distributed using a forest area change map, allowing to get unbiased estimates of which the precision is quantified through the calculation of confidence intervals. This methodology is recommended by the GFOI. A process of quality control and quality assurance is implemented to reduce uncertainties and ensure robustness and representativeness of the estimates. 16 | P a g e
You can also read