Estimating Active Cases of COVID-19 - arXiv
←
→
Page content transcription
If your browser does not render page correctly, please read the page content below
Estimating Active Cases of COVID-19
 JAVIER ÁLVAREZ, CARLOS BAQUERO, ELISA CABANA, JAYA PRAKASH CHAMPATI,
arXiv:2108.03284v1 [physics.soc-ph] 6 Aug 2021

 ANTONIO FERNÁNDEZ ANTA, DAVIDE FREY, AUGUSTO GARCÍA-AGÚNDEZ, CHRYS-
 SIS GEORGIOU, MATHIEU GOESSENS, HAROLD HERNÁNDEZ, ROSA LILLO, RAQUEL
 MENEZES, RAÚL MORENO, NICOLAS NICOLAOU, OLUWASEGUN OJO, ANTONIO OR-
 TEGA, JESÚS RUFINO, and EFSTATHIOS STAVRAKIS, CoronaSurveys Team, https://coronasurveys.
 org/team/, Spain
 GOVIND JEEVAN and CHRISTIN GLORIOSO, DICE Institute, Pathcheck Foundation, USA
 Having accurate and timely data on confirmed active COVID-19 cases is challenging, since it depends on
 testing capacity and the availability of an appropriate infrastructure to perform tests and aggregate their
 results. In this paper, we propose methods to estimate the number of active cases of COVID-19 from the
 official data (of confirmed cases and fatalities) and from survey data. We show that the latter is a viable option
 in countries with reduced testing capacity or suboptimal infrastructures.

 1 INTRODUCTION
 The COVID-19 disease epidemic caused by the SARS-CoV-2 virus started having a deep impact
 in societies across the world as the virus spread globally in early 2020. Not surprisingly, during
 its initial months, the knowledge about virus properties and the ability to test for its presence or
 correctly identify symptoms was limited [14]. These factors, when coupled with the fast spread of
 the pandemic made it very challenging to obtain accurate estimates of the numbers of individual
 cases. This problem affected the estimation of a number of important metrics, including the number
 of daily cases, the cumulative number of cases, or the proportions of active and contagious cases at
 a given time and place.
 In this article, we address these limitations and propose several approaches that try to predict the
 true magnitude of actual cases. Specifically, we aim to assess the number of active cases at a given
 point in time, i.e., how many people are sick with COVID-19. The first class of approaches depend
 on the accuracy of the official reporting of COVID-19 cases and deaths [11, 26], which can be an
 issue in some regions. The second class of approaches is survey-based and built on data collected by
 the CoronaSurveys project [4], and by the University of Maryland and Carnegie Mellon University
 with the support of Facebook [6]. We observe that in some countries (like Greece or Portugal) the
 most recent estimates from official data and from surveys match. However, in other countries (like
 Brazil or India) the surveys data gives a much larger number of active cases, possibly due to under
 reporting in the official data. The conclusion is that estimates via surveys is a viable option to
 estimate active number of cases in countries with reduced testing capacity or suboptimal reporting
 infrastructures.

 2 ESTIMATING THE NUMBER OF ACTIVE CASES FROM OFFICIAL DATA
 Soon after the genetic sequence of the virus was made public, in early 2020, it became possible to
 detect the virus from biological samples by means of RT-PCR (reverse transcription-polymerase

 Permission to make digital or hard copies of part or all of this work for personal or classroom use is granted without fee
 provided that copies are not made or distributed for profit or commercial advantage and that copies bear this notice and
 the full citation on the first page. Copyrights for third-party components of this work must be honored. For all other uses,
 contact the owner/author(s).
 2nd KDD Workshop on Data-driven Humanitarian Mapping, August 15, 2021
 © 2021 Copyright held by the owner/author(s).

 1
2nd KDD Workshop on Data-driven Humanitarian Mapping, August 15, 2021 Álvarez et al.

chain reaction), a technique that detects fragments of viral particles. Health authorities started
collecting daily numbers of detected cases and reporting them, as well as the numbers of fatalities
attributed to COVID-19. Several data aggregators of worldwide case numbers appeared, notably
those at Johns Hopkins University [11] and Oxford [3].

2.1 Estimating active cases from daily data
The simplest approach to estimate active cases consists in using the official numbers of confirmed
cases, fatalities, and recovered cases that have been collected in several data repositories [3, 8, 11].
The official number of active cases can hence be computed by subtracting the number of fatalities
and recovered from the number of confirmed cases. In this paper, we use the number of active cases
reported by Johns Hopkins University [11] based on the above computation (labelled as JHU active
in the plots below).
 Unfortunately, the number of recovered cases is not reliable or available in all countries (e.g.,
Greece and Madrid), so in order to have another estimation of the official number of active cases
we use a second approach: we assume that each reported case is active for a fixed period, which
is the median number of days COVID-19 cases are active. We label this estimate as Confirmed in
the plots below. To define the usual duration of a COVID-19 case, we consider the CDC Morbidity
and Mortality Weekly Report [15]. It states that “(65%) reported that they had returned to their
usual state of health a median of 7 days (IQR = 5–12 days) from the date of testing” and that “the
median number of days respondents reported feeling unwell before being tested for SARS-CoV-2
was 3 (IQR = 2–7 days)”. From these values we establish a reference of 10 (3 + 7) days of active case
duration (from onset to recovery) as covering the majority of cases. The same active period length
is proposed by Singanayagam et al. [21].

2.2 Estimating active cases from cumulative data
In this section we show how the official cumulative number of cases and fatalities can be used to
estimate daily new cases, and from this value the active cases. By default, we will assume that the
presented techniques are applied while immunity is mostly driven by natural infection, as is still
the case in June 2021 for most low- and medium-income countries (LMIC).
2.2.1 Tracking the cumulative number of cases. Information on the cumulative number of detected
cases in a given region is of particular relevance when trying do determine the proportion of
population that had contact with the disease. We will show that combining this value with the
cumulative number of COVID-19 deaths can help estimating the true number of cases in each
region of concern. On March 13 2020 a news article in Nature [14] brought attention to the high
level of under detection of COVID-19 cases, and suggested the use of estimates of the case fatality
rate (CFR, at that time estimated around 1%) to infer the likely number of cases. Also in March
2020 The Centre for the Mathematical Modelling of Infectious Diseases (CMMID) at the London
School of Hygiene & Tropical Medicine (LSHTM) made available a more detailed estimation of the
level of under-detection of COVID-19 symptomatic cases [19, 20]. This study took into account the
delay distribution from symptoms to death and used a more precise estimate of the CFR, from an
ongoing study with Wuhan data, that established it around 1.38% [24].
 Following the technique in [20], it is possible to estimate the actual cumulative number of
symptomatic cases at time by looking at the reported cumulative number of cases and cumulative
number of deaths, and calculating the apparent CFR . If this CFR is higher than the baseline
CFR = 1.38%, this is an indication of under-detection of cases. The actual number of cumulative
 CFR
cases can be obtained by multiplying the cumulative reported cases by CFR
 . In [16], presented at
the KDD 2020 Workshop on Data-driven Humanitarian Mapping, we provide a detailed description

 2
Estimating Active Cases of COVID-19 2nd KDD Workshop on Data-driven Humanitarian Mapping, August 15, 2021

of this estimation technique, and show that it matched independent serology-based prevalence
surveys, when considering Spanish data [18].
2.2.2 Daily cases - EpiCurve. From the estimate of the true number of cumulative cases, we estimate
the daily number of new cases (i.e., the EpiCurve) before we derive the number of active cases in
each day. Let = ( 1, . . . , ) be the series of daily new cases and = ( 1, . . . , ) the respective
cumulative number of cases, then = − −1 with 0 = 0. If the series does not have negative
values, then the corresponding series is non-decreasing (it is a rare event, but some countries
have resorted to negative values in daily cases and/or deaths to correct past misreporting).
 As we know, from the previous section, the and series can under-estimate the true number of
cases. The CFR based techniques that we developed in [16] provide a series ˆ that estimates the true
number of cumulative cases. However, this series is not always non-decreasing, and needs some
processing in order to estimate the likely true number of daily cases. Our target is to derive the series
of estimated daily cases . ˆ To this end, we consider ˜ = ( ˜1, . . . , ˜ ) where ˜ = max( ˆ1, . . . , ˆ ), so
that the cumulative series ˜ is always non-decreasing. Now, we can define ˆ such that ˆ = ˜ − ˜ −1
with ˜0 = 0.
 As an additional reference we also define a very simple estimator of daily cases D̂ that only
takes into account the daily number of reported deaths. Let = ( 1, . . . , ) be the series of daily
fatalities attributed to COVID-19. We define D̂ = ( ˆ1, . . . , ˆ ) such that ˆ = 0.0138
 +13
 , where is a day
of reference and + 13 is a day 13 days later. That is, this considers the number of deaths in a given
day and uses it to infer how many cases likely occurred 13 days before, by using as reference the
Wuhan CFR = 1.38%. The delay of 13 days is the median time from onset of symptoms to death,
estimated from the CDC COVID-19 Pandemic Planning Scenarios [7]. The disadvantage of this
technique is that it cannot predict the daily cases in the most recent 13 days, while the advantage
is that it only requires an accurate reporting of COVID-19 deaths, and does not need the series of
detected cases.
2.2.3 Active cases. In the previous section we have defined two estimates of daily new cases: ˆ
– based on cases and deaths; and D̂ – only based on deaths. From them we derive two series of
active cases: CCFR – derived from ˆ and CCFR Fatalities – derived from D̂ (we use CCFR and
CCFR Fatalities as labels in the plots below). Both series are obtained by considering each daily
case as active the next 10 days (as we presented above), and letting each of them expire after that
time, so that they no longer contribute to subsequent estimates of active cases. This transformation
also helps smoothing the data, since cumulative cases combine information from multiple days and
reduce the effect of daily variations. Note that both estimates are of symptomatic active cases, since
we use the CFR to obtain them.

3 ESTIMATING ACTIVE CASES VIA SURVEYS
The show now methodologies for deriving estimates of active cases from survey studies [1, 5, 9].

3.1 Estimating directly from symptoms
Since the spring of 2020 Facebook has been collaborating in the context of their program Data
for Good [6] with CMU and U. of Maryland promoting surveys created by these two institutions
[12]. Both surveys collect thousands of daily responses to their surveys, in which participants
report their symptoms, their habits, vaccination status, etc. The Delphi Group at Carnegie Mellon
University U.S. COVID-19 Trends and Impact Survey in partnership with Facebook (Delphi US
CTIS) [5] collects around 50,000 responses daily in the USA, while University of Maryland Social
Data Science Center Global COVID-19 Trends and Impact Survey in partnership with Facebook
(UMD Global CTIS) [23] collects more than 100,000 responses daily from many countries in the

 3
2nd KDD Workshop on Data-driven Humanitarian Mapping, August 15, 2021 Álvarez et al.

world. For this article we have used the individual responses of UMD Global CTIS to estimate the
total number of active cases using both direct and indirect survey questions.
 We observed that the set of responses to the UMD Global CTIS has to be curated. As a first
approach, we remove all responses that declare to have all 12 symptoms in the last 24 hours (fever,
cough, difficulty breathing, fatigue, stuffy or runny nose, aches or muscle pain, sore throat, chest
pain, nausea, loss of smell or taste, eye pain, headache). Additionally, we remove the responses
with high values is certain questions1
 • Declare at least one symptom and give a high value to the question “For how many days
 have you had at least one of these symptoms?"
 • Answer Yes to question “Do you personally know anyone in your local community who is
 sick with a fever and either a cough or difficulty breathing?" and give a high value to the
 question “How many people do you know with these symptoms?"
 • Give a high value to the question “How many people slept in the place where you stayed last
 night (including yourself)?"
 After filtering outliers, each survey response is considered to belong to a COVID-like illness
active case (UMD CLI in the plots below) if it declares the following combination of symptoms:
fever, along with cough, shortness of breath, or difficulty breathing (this is a combination used in
the survey and the API [23]). Similarly, the response is considered to belong to a COVID-like illness
according to the WHO (UMD CLI WHO in the plots) if it declares the following symptoms: fever,
cough, and fatigue [25]. Obviously, UMD CLI and UMD CLI WHO are estimates of the number of
symptomatic active cases.

3.2 Estimating with indirect reporting
In [1, 9] we present the CoronaSurveys project, and show how it is possible to estimate the
cumulative incidence of COVID-19 with indirect reporting and the Network Scale-up Method
(NSUM) [2, 13]. In the CoronaSurveys poll we have the following questions relative to a preselected
geographical area: (1) “How many people do you know personally in this geographical area?" (2)
“How many of the above have been diagnosed or have had symptoms compatible with COVID-19,
to the best of your knowledge?" The first question providesÍwhat Í we call the reach of a participant
 , and the second gives the number of cases . The ratio / provides an estimator of the
fraction of the population that has had COVID-19.
 In order to estimate the number of active cases, an additional questions has been included: (3)
“How many are still sick?" So, if the answer for this question by participant is , an estimator
 Í Í
of the fraction of the population that is currently sick of COVID-19 is / . We label this
estimate CoronaSurveys.
 The UMD Global CTIS, in turn, has two questions that allow respondents to report on the
symptoms of their contacts:
 • B3: “Do you personally know anyone in your local community who is sick with a fever and
 either a cough or difficulty breathing?"
 • B4: “How many people do you know with these symptoms?"
The combination of these two questions allows us to extract the number of cases of COVID-like
illness in the local community of a participant . This information is similar to the number of sick
cases provided by the third question above in the CoronaSurveys poll. Unfortunately, the UMD
Global CTIS does not include a question that allows us to estimate the size of the local community.
Instead, we use, as an estimate of this size, the average reach ¯ obtained with the CoronaSurveys
1 We use 100 as the threshold to consider that a value is high. From the data we have observed that 100 is a conservative
value that essentially filters out unrealistic responses, like those reporting millions.

 4
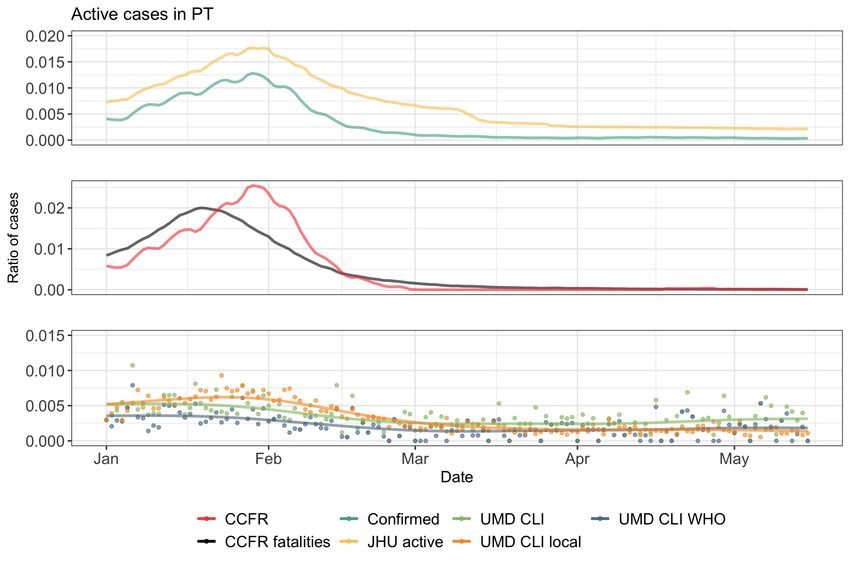
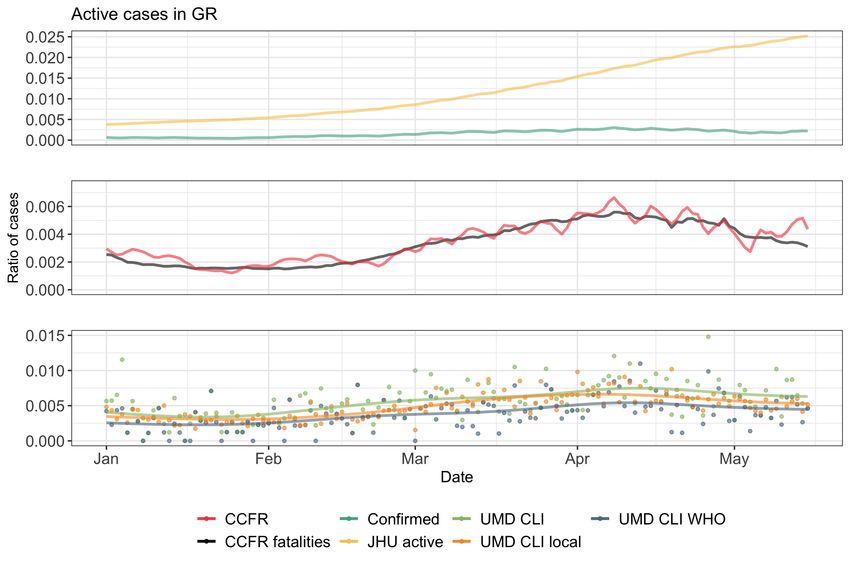
Estimating Active Cases of COVID-19 2nd KDD Workshop on Data-driven Humanitarian Mapping, August 15, 2021

 Fig. 1. Active cases in Greece and Portugal (Jan-May 2021).

poll in the considered geographical area2 . Hence, we estimate the ratio of Í
 the population that is
sick with a COVID-like illness from responses to the UMD Global CTIS as /( · ¯) (labelled
UMD CLI local in the plots).

2 The results shown here use ¯ = 71 for all countries

 5
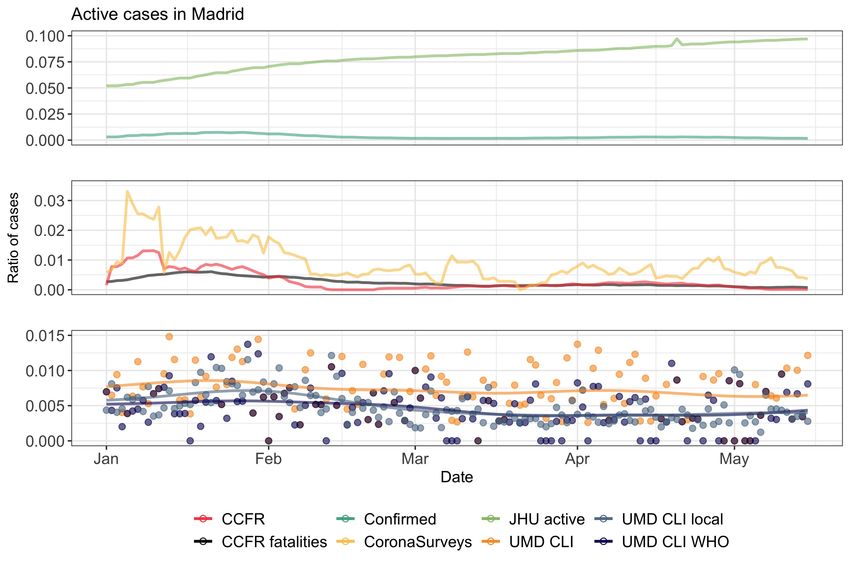
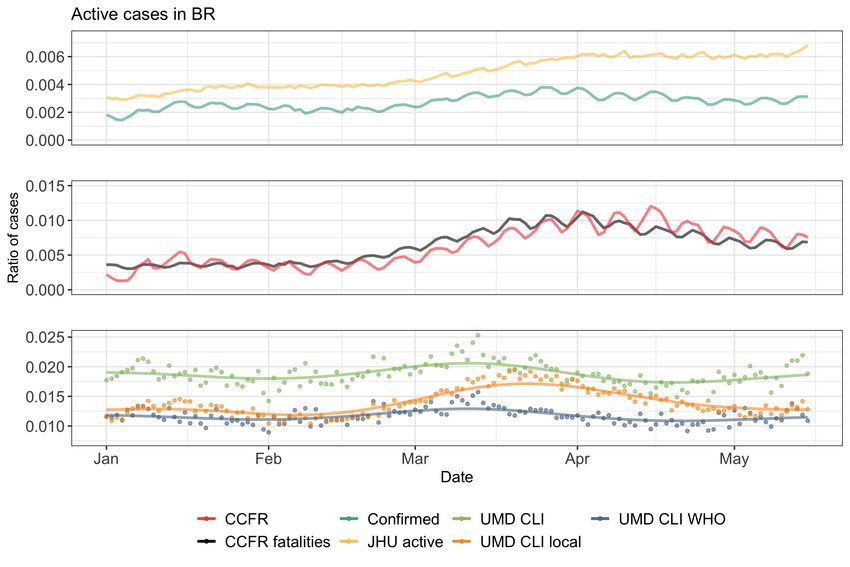
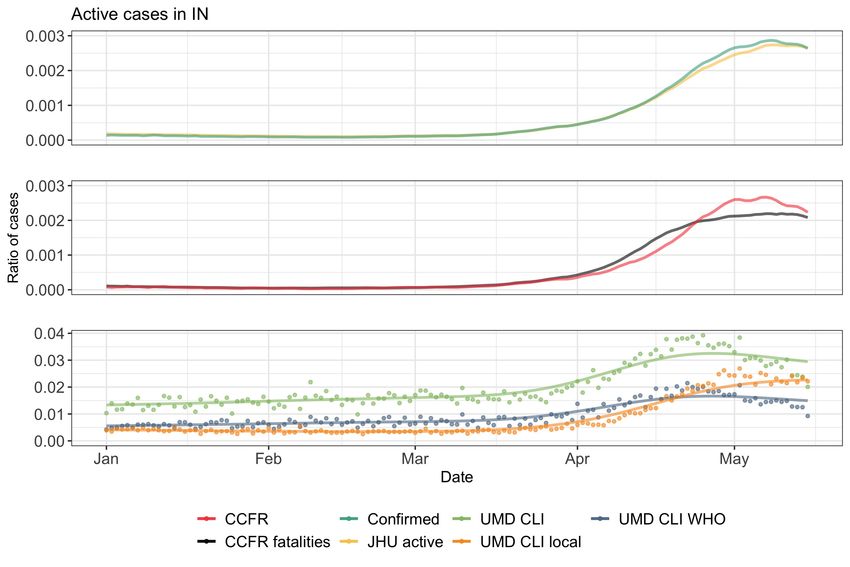
2nd KDD Workshop on Data-driven Humanitarian Mapping, August 15, 2021 Álvarez et al.

4 EXAMPLES
In this section, we first present the estimates computed for Greece (GR), Portugal (PT), Brazil
(BR), and India (IN) in 2021, reported in Figures 1 and 2. In the general case, we observe that the
estimated number of active cases using the confirmed (reported) data are lower than those derived
from surveys. For Greece, reported data may be misleading. In particular, the JHU active plot has
an increasing trend on active cases while the actual confirmed cases in the country are dropping.
Such behavior indicates possible issues in the number of reported cases in Greece, confirmed when
comparing with [26]. On the other hand, the estimates based on the confirmed cases, or on the
fatalities (i.e. CCFR and CCFR fatalities) appear to provide a better picture of the actual situation.
Similar trends, although with slightly larger numbers, can be observed for the estimates obtained
from the survey responses. In Portugal, we observe a high alignment between the estimates obtained
by the reported cases, with the peak of the curves reaching 0.02% of the population. However, the
survey estimates in the case of Portugal produce a lower percentage of active cases with their peak
not going above 0.005% of the population.
 Brazil exhibits a different trend, where the estimates based on the fatalities are higher (almost
double) than the estimates based on the confirmed cases. Such behavior may suggest that fatalities
are reported better than confirmed cases. On the other hand, estimates based on surveys suggest a
high under-reporting of confirmed cases, resulting in almost 10 times more active cases than what
estimated by the confirmed cases. Finally, India seems to follow Portugal’s trend when it comes
to the estimates based on reported cases. The curves obtained from confirmed cases and fatalities
appear to align, suggesting that the CFR in the country matches the baseline CFR from Wuhan.
The estimates coming from the surveys however match the trend we observe in Brazil, suggesting
that the active cases are ten times more than what estimated by the confirmed cases. Essentially
this possibly indicates a significant under-reporting in the confirmed cases.
 In Figure 3 we present the estimates of active cases for Madrid, including the ones derived from
the CoronaSurveys poll (which was not included in the other plots because the number of survey
responses in those countries was too low). Here we see that JHU active has some misreporting
problem (in fact the problem is with the number of recovered cases, like in Greece). The other
estimates follow similar patterns, correctly identifying the burst of cases that Madrid suffered in
January 2021. It is worth mentioning that CoronaSurveys uses an average of 36 responses per day
while the other survey-based estimates have close to 500 responses per day.

5 DISCUSSION AND FUTURE WORK
The presented results have known limitations. As mentioned, the techniques developed in Section
2.2 yield estimates (CCFR and CCFR Fatalities) of symptomatic cases. Moreover, [20] takes as
reference the baseline CFR = 1.38% from Wuhan, without taking into account the differences
between countries and over time [10, 22]. Additionally, countries that have vaccination in progress
typically vaccinate first the older age groups, and the consequence is that the baseline case fatality
ratio will decrease, since younger groups have lower CFR [22]. We are exploring how to adapt these
techniques to obtain estimates of infected cases, using for that the Infection Fatality Rate (IFR), and
taking into account country, age [17], vaccination, and SARS-CoV-2 variants. Another limitation is
the use of a fixed period (median value) for a case to be active and for onset to death, which we
plan to replace with random variables. Regarding survey-based estimates, we are exploring how
to improve the curating of the responses and how to take into account the selection bias of the
surveys. Specifically for indirect reporting, we are exploring the influence of the social network
structure and how to have better average reach estimates. Additionally, we are exploring have to
deal with the known biases of NSUM [13].

 6
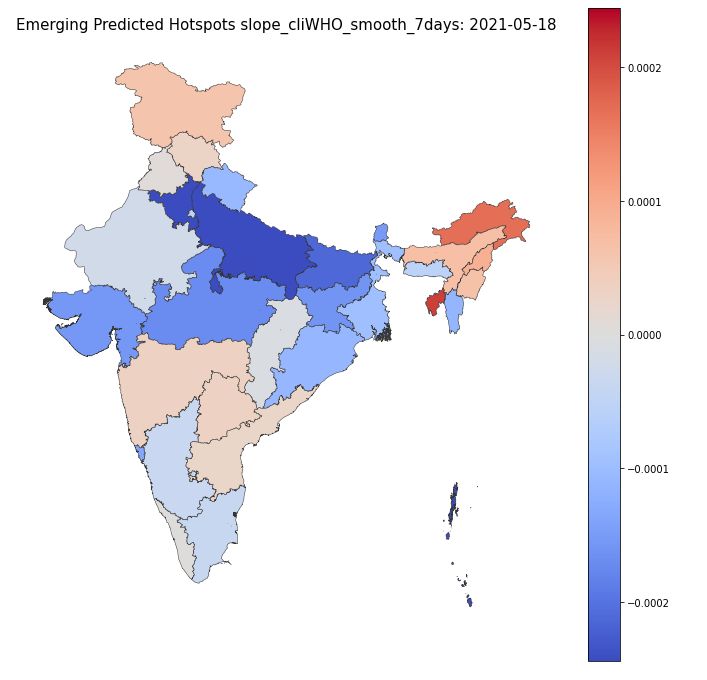
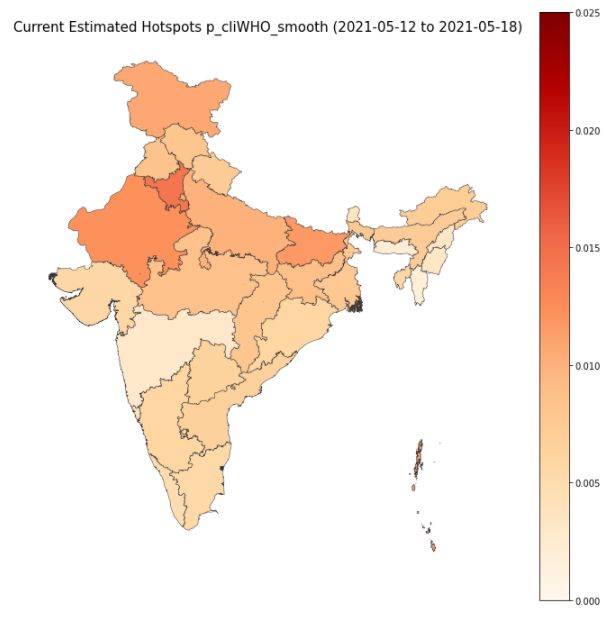
Estimating Active Cases of COVID-19 2nd KDD Workshop on Data-driven Humanitarian Mapping, August 15, 2021

 Fig. 2. Active cases in Brazil and India (Jan-May 2021).

 As future work, we will be using these estimates to help authorities understand the real situation
of the pandemic in each region and its most likely evolution in the future. This will enable the
identification of future hot areas and prepare them for the rise in cases. For this we are producing
maps and charts that show the current situation in terms of active cases at regional level, and that
show how this situation has changed in the recent few days (see Figure 4, left and center) Along
similar lines, we will use time-series analysis to forecast the evolution of the number of active cases
in the near future (see Figure 4, right).

 7
2nd KDD Workshop on Data-driven Humanitarian Mapping, August 15, 2021 Álvarez et al.

 Fig. 3. Active cases in Madrid, Spain (Jan-May 2021)

Fig. 4. Maps of current ratio of active cases (left) and its past evolution (center) in India. Forecasting of active
cases in Delhi, India (right).

 Finally, we are developing a data-driven approach to process the UMD Global CTIS data to
determine the probability that a response is an active case of COVID-19 from the set of symptoms
it declares. To this end, we will use the responses that give a positive answer to the question “Have
you been tested for coronavirus (COVID-19) in the last 14 days?" as training data, assuming that
the result of that test tells us whether the respondent is an active COVID-19 case.

ACKNOWLEDGEMENTS
We want to thank the whole CoronaSurveys Team [4] for the collective effort. We also want to thank
Tamer Farag and Kris Barkume for useful discussions on the survey data. This work is partially
supported by grant CoronaSurveys-CM, funded by IMDEA networks and Comunidad de Madrid.

 8
Estimating Active Cases of COVID-19 2nd KDD Workshop on Data-driven Humanitarian Mapping, August 15, 2021

REFERENCES
 [1] Carlos Baquero et al. The CoronaSurveys system for COVID-19 incidence data collection and processing. Frontiers in
 Computer Science, 3:52–52, 2021.
 [2] H Russell Bernard, Eugene C Johnsen, Peter D Killworth, and Scott Robinson. Estimating the size of an average
 personal network and of an event subpopulation: Some empirical results. Social science research, 20(2):109–121, 1991.
 [3] Blavatnik School of Government, University of Oxford. Oxford Covid-19 Government Response Tracker. https:
 //github.com/OxCGRT, 2020. Accessed: 2021-06-02.
 [4] CoronaSurveys Team. CoronaSurveys: Independent Measurement of the Pandemic through Open Surveys . https:
 //coronasurveys.org, 2020. Accessed: 2021-06-02.
 [5] Delphi Group. COVID-19 Trends and Impact Survey. https://cmu-delphi.github.io/delphi-epidata/symptom-survey/,
 2021. Accessed: 2021-08-06.
 [6] Facebook Data for Good. COVID-19 symptom survey – request for data access. https://dataforgood.fb.com/docs/covid-
 19-symptom-survey-request-for-data-access/, 2020. Accessed: 2021-01-24.
 [7] Centre for Disease Control and Prevention. Covid-19 pandemic planning scenarios. https://www.cdc.gov/coronavirus/
 2019-ncov/hcp/planning-scenarios.html. Accessed: 2020-04-09.
 [8] European Centre for Disease Prevention and Control. Covid-19. https://www.ecdc.europa.eu/en/covid-19-pandemic.
 Accessed: 2020-04-09.
 [9] Augusto Garcia-Agundez et al. Estimating the covid-19 prevalence in spain with indirect reporting via open surveys.
 Frontiers in Public Health, 9, 2021.
[10] Selene Ghisolfi, Ingvild Almås, Justin C Sandefur, Tillman von Carnap, Jesse Heitner, and Tessa Bold. Predicted covid-19
 fatality rates based on age, sex, comorbidities and health system capacity. BMJ global health, 5(9):e003094, 2020.
[11] Johns Hopkins University & Medicine. Johns Hopkins Coronavirus Resource Center. https://coronavirus.jhu.edu,
 2020. Accessed: 2021-06-02.
[12] Frauke Kreuter et al. Partnering with a global platform to inform research and public policy making. In Survey Research
 Methods, volume 14, pages 159–163, 2020.
[13] Ian Laga, Le Bao, and Xiaoyue Niu. Thirty years of the network scale-up method. Journal of the American Statistical
 Association, (in press):1–33, 2021.
[14] Amy Maxmen. How much is coronavirus spreading under the radar. Nature, 10, 2020.
[15] Tenforde MW, Kim SS, Lindsell CJ, and et al. Symptom duration and risk factors for delayed return to usual health
 among outpatients with covid-19 in a multistate health care systems network. MMWR Morbidity and Mortality Weekly
 Report, 69:993–998, 2020.
[16] Oluwasegun Ojo et al. Coronasurveys: Using surveys with indirect reporting to estimate the incidence and evolution
 of epidemics. CoRR, abs/2005.12783, 2020.
[17] Megan O’Driscoll, Gabriel Ribeiro Dos Santos, Lin Wang, Derek AT Cummings, Andrew S Azman, Juliette Paireau,
 Arnaud Fontanet, Simon Cauchemez, and Henrik Salje. Age-specific mortality and immunity patterns of sars-cov-2.
 Nature, 590(7844):140–145, 2021.
[18] Marina Pollán et al. Prevalence of SARS-CoV-2 in Spain (ENE-COVID): a nationwide, population-based seroepidemio-
 logical study. The Lancet, 396(10250):535–544, 2020.
[19] T Russel et al. Using a delay-adjusted case fatality ratio to estimate under-reporting. Available at the Centre for
 Mathematical Modelling of Infectious Diseases Repository, here, 2020. https://cmmid.github.io/topics/covid19/global_cfr_
 estimates.html.
[20] Timothy W. Russell et al. Reconstructing the early global dynamics of under-ascertained COVID-19 cases and infections.
 BMC Medicine, 18(1), 2020.
[21] Anika Singanayagam et al. Duration of infectiousness and correlation with RT-PCR cycle threshold values in cases of
 COVID-19, England, January to May 2020. Eurosurveillance, 25(32):2001483, 2020.
[22] Gabriele Sorci, Bruno Faivre, and Serge Morand. Explaining among-country variation in covid-19 case fatality rate.
 Scientific reports, 10(1):1–11, 2020.
[23] The University of Maryland Social Data Science Center. The University of Maryland Social Data Science Center Global
 COVID-19 Trends and Impact Survey in partnership with Facebook. https://covidmap.umd.edu/, 2020. Accessed:
 2021-08-06.
[24] Robert Verity et al. Estimates of the severity of coronavirus disease 2019: a model-based analysis. The Lancet Infectious
 Diseases, 2020/04/11 2020.
[25] World Health Organization. Coronavirus disease (COVID-19) Q&A. https://www.who.int/news-room/q-a-detail/
 coronavirus-disease-covid-19, 2020. Accessed: 2021-06-02.
[26] Worldometer. COVID-19 Coronavirus Pandemic. https://www.worldometers.info/coronavirus/, 2020. Accessed:
 2021-06-02.

 9
You can also read