Estimation of Effective Reproduction Numbers for COVID-19 using Real-Time Bayesian Method for India and its States
←
→
Page content transcription
If your browser does not render page correctly, please read the page content below
Estimation of Effective Reproduction Numbers for
COVID-19 using Real-Time Bayesian Method for
India and its States
Rishabh Tyagi ( rishabh.tyagiindia@gmail.com )
International Institute for Population Sciences https://orcid.org/0000-0001-9080-5790
Laxmi Kant Dwivedi
International Institute for Population Sciences
Ashutosh Sanzgiri
Texas A&M University
Research Article
Keywords: Bayesian approach; COVID-19, Effective Reproduction Number, Government Interventions,
India, Lockdown, State-level analysis.
DOI: https://doi.org/10.21203/rs.3.rs-45937/v1
License: This work is licensed under a Creative Commons Attribution 4.0 International License.
Read Full License
Page 1/15Abstract
WHO declared the outbreak of the novel Coronavirus, COVID-19, as a pandemic on 11th March. On 24th
March, a three-week nation-wide lockdown has been announced, which is now extended till 31st May.
Effective Reproduction Number (Rt) helps in understanding how effective preventive measures have been
in controlling an outbreak. This study assesses the impact of nation-wide lockdown in slowing down the
spread of the COVID-19 at the national and state level. An attempt has also been made to examine the
important state-level factors responsible for the uneven distribution of Rt of COVID-19 across different
states of India. Bayesian approach based on the probabilistic formulation of standard SIR disease
transmission models have been employed assuming serial interval of 4 days and basic reproduction
number (R0) of three. India’s Rt has declined from 1.81 (90% HDI: 1.64, 2.00) on 1st April to Rt =1.04 (90%
HDI: 0.96, 1.13) on 9th May, after that it started increasing, and Rt =1.14 (90% HDI: 1.06, 1.21) was
observed on 17th May. The value of Rt at the state level has shown signi cant variations. The testing rate
had a signi cant impact in reducing the Rt at the state-level. The strategy of lockdown has contributed to
containing the spread of the virus to some extent, but India still has a long way to go. Testing Rate is the
most signi cant factor at state-level, as Testing and isolating patients sooner signi cantly reduces the
disease spread.
Introduction
The World Health Organization (WHO) has declared the outbreak of the novel Coronavirus, (COVID-19) as
a pandemic on 11th March 2020. In India, the rst positive case of COVID-19 was detected on 30th
January 2020, in Kerala. Cases started to increase from the rst week of March 2020, and it reached to
the level of 100,000 on 18th May 2020. A majority of patients initially identi ed had a travel history. These
patients acted as primary cases and started infecting the general population. It is believed that it will take
twelve to eighteen months to develop a vaccine for COVID-191. The absence of a vaccine for COVID 19 is
making the situation even worse for the overstretched Indian health care systems. For example, the
number of hospital beds per 1000 population is less than one - it is just one indicator to cite the
vulnerable situation of India’s health care system2. In the absence of a vaccine, ‘social distancing’ is the
optimal strategy to control the spread of novel Coronavirus.
A three-week nation-wide lockdown was imposed on 25th March 2020 to curtail the spread of the
Coronavirus. This is a tough decision for any nation, particularly for a country with 22% of the population
living below the poverty line and 90% of its workforce employed in the informal sector. About 400 million
workers in the informal economy are at risk of falling deeper into poverty during the crisis3. The housing
conditions are relatively deplorable for one in six urban dwellers, and density of slum areas is a serious
concern and poses a challenge to maintain the social distancing among the population. The purpose of
the nation-wide lockdown is to contain the spread of the Coronavirus so that the Government could take a
multi-prong strategy: add more beds in its network of hospitals, scale up the production of the testing kits
for COVID-19 and personal protection equipment (PPE) for the health workers. This lockdown helps to
Page 2/15break the chain of infections. It hopes to delay the onset of the disease until the healthcare infrastructure
can handle the surge in cases.
It is evident that the concept of basic reproduction number (R0) was rst introduced in the eld of
demography, where this metric was used to count offspring4. The epidemiologists started to use this
concept in the case of infective cases. This indicator aims to provide information about the
contagiousness or transmissibility of infectious and parasitic agents. R0 (Basic Reproduction
number) has been described as being one of the fundamental and most often used metrics for the study
of infectious disease dynamics5. In view of current COVID-19 pandemic, the paper makes an attempt to
understand the effect of nation-wide lockdown on the reproduction number over different periods in India
and its selected states. Further, the study also tries to understand the important factors associated with
the decline in Effective Reproduction (Rt) at the state level.
There are a host of factors at the state level, which affect the decline in effective reproduction number
(Rt). The present study considered several important factors at the state level, like the number of tests
performed per million population, human development index, indicators of good governance and per
capita health expenditure. Rapid testing at the beginning of transmission is one of the major responsible
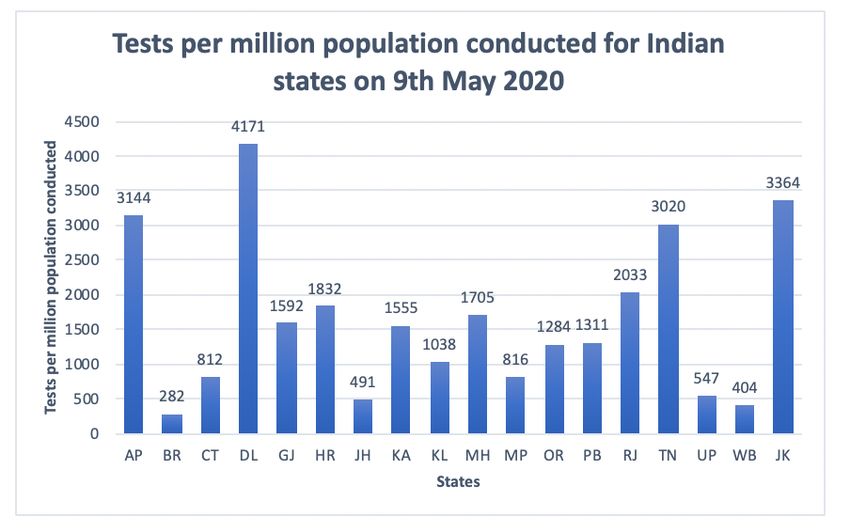
factors in declining the Rt as it helps in identifying and isolating the patients at an early stage. Fig I
shows the number of tests done per million population by different states of India as on 9th May.
However, India has limited facilities due to which su cient tests could not be conducted in some states;
as a result, they did poorly in stopping the spread of the virus. Rapid testing at an early stage has shown
phenomenal results in most of the states, which is illustrated in Fig I.
Apart from the nation-wide lockdown, social-welfare programs were implemented but not in a uniform
way by all states. Human Development Index (HDI) at the state level is a good indicator of the
effectiveness of a social welfare program implemented by the state government. It is expected that states
placed with a high human development index will do far better in controlling the spread of the virus than
those having a lower HDI Index. It is also hypothesized that Governance index at the state level assesses
the Status of good Governance and it is also a summary measure of the impact of various interventions
taken up by the State Government and Union Territories (UTs). Governance is an important factor at the
state level for controlling the spread of infection as it tells us how e cient a government is in
implementing policies and creating an impact through them. Health Infrastructure is also an important
aspect for understanding the healthcare delivery provisions and welfare mechanisms. Per Capita Health
Expenditure (PCHE) in a state is a good indicator of the health infrastructure of that state. It is
conceptualized that these factors have a strong relationship with the decline of Rt.
Materials And Methods
Data on COVID-19 was obtained from the data-sharing portal covid19india.org.Information is collected
on daily con rmed cases and daily testing numbers at the state level from 14th March to 17th May 2020.
Page 3/15For calculating the test per million population at the state level, the testing numbers were extracted at the state level from the data-sharing portal covid19india.org. The gures of the population for the selected states as on 1st March 2020 has been taken from the report “Population Projection for India and States (2011–2036)” provided by National Commission for Population (NCP). HDI Index 2018 at the state level is taken from the Global Data Lab, which provides the HDI Index at the state level for all countries from 1990-2018. Per Capita Health Expenditure (PCHE) data from the National Health Pro le (NHP 2019) has also been used. All the calculations for estimating Rt are done using Jupyter notebook with Python 3. Effective reproduction Number (Rt) Effective reproduction number (Rt,) is the mean number of infections generated during the infectious period from a single infected person at time t. The effective reproduction number may vary across locations because contact rates among people may differ due to differences in population density, cultural differences, level of immunity and restrictions imposed on the movement of the people. When Rt>1, the pandemic will spread through a large part of the population. If Rt
P(Rt): The prior beliefs of the value of P(Rt) at the beginning of the study period

P(k): The probability of observing ‘k’ new cases for a given day

Choosing a Likelihood Function P (kt |Rt)

Given an average arrival rate of λ new cases per day, the probability of observing ‘k’ new cases is
distributed according to the Poisson distribution:

There exists a relationship between Rt and λ.

λ = kt-1. e   (R – 1)
                t

Where is the reciprocal of the serial interval, and the value of the serial interval has been considered to
be four days based on the most reliable ndings9. Further, new cases are known; therefore, the likelihood
function as a Poisson parameterized by xing k and varying Rt can be reformulated7.

Input variables required for its calculation are-

  1. Daily number of con rmed cases at the state and national level which is taken from
     http://api.covid19india.org/states_daily_csv/con rmed.csv
  2. Serial Interval for COVID -19 is required
  3. Basic Reproduction Number at the initial time (14th March) (R0) is required.

Serial Interval and Incubation Period for COVID 19

Literature suggests the mean serial interval for COVID-19 ranges from 4 to 8 days (9-12). Recent analyses
by9 used a much larger sample that includes up to 468 pairs, making their estimates of between 4 and 5
days which are more statistically reliable. The estimated mean serial interval is shorter than the
preliminary estimates of the mean incubation period (approximately 5 days) (11,12). When the serial
interval is shorter than the incubation period for infectious disease, the pre-symptomatic transmission is
likely to have taken place and may occur even more frequently than symptomatic transmission13. The
Indian Council of Medical Research (ICMR) also con rmed that as much as 80% of all cases could be
asymptomatic based on the fact that COVID-19 tests that delivered positive results in India show that

                                                     Page 5/15
69% of positive cases were asymptomatic, whereas 31% are symptomatic representing a ratio of 2:114. In
the present study, the mean value of the serial number is considered as four days.
Basic Reproduction Number (R0)
Reproduction Number for COVID 19 at the initial stage is estimated between 2 and 315. Using the raw
CDC data, the estimated value of the basic reproduction number is between 2.2 and 2.3. Another study16
estimated that the median daily reproduction number (Rt) in Wuhan had declined from 2·35 (95% CI
1·15–4·77) at one week before travel restrictions were introduced on 23rd January 2020, to 1·05 (0·41–
2·39) one week after. So, a basic reproduction number (R0) of 3 at the initial stage of infection (14th
March in our case) will yield good results for the present study. However, the estimate of the effective
reproduction number using the current adopted Bayesian approach is independent of the initial assumed
basic reproduction number.
Multiple Linear Regression
Multiple linear regression analysis was carried out to quantify the impact that state-level factors made in
the decline of Rt. The difference created in the value of Rt during lockdown phase (between 2nd April and
9th May) for states acts as the dependent variable, and state-level factors namely Tests Conducted
(between 2nd April and 9th May) per million, HDI, PCHE and Good Governance Index as independent
variables. All independent variables were normalized between 0 and 1 to bring all the values of
independent variables in the dataset to a common scale15.
Results
The effective reproduction number, Rt, changes over time, because of the decrease in the fraction of
susceptible. R0 = 3 considered as initial prior and Serial Interval (SI) of 4 days have been taken for the
present study. However, initial prior does not affect the estimates as it converges to a similar Rt after a
few days regardless of which value of R0 was considered in the permissible range. Table I illustrates that
with different values of R0, the estimated value of Rt is almost remained unchanged. The width of the
Highest Density Interval (HDI) is almost the same for a given SI. Regardless of different values of R0, in
all instances, uncertainty was reduced as more cases were reported over time. It is also observed that the
value of Rt increases with an increase in the serial interval, which is consistent with the ndings of.
Impact of lockdown on Rt at national and state level for India
The value of Rt at the state level helps in understanding the spread of disease in two ways. First, to
understand how effective the measures have been imposed in controlling the outbreak and secondly, it
gives us vital information about whether Government should increase or reduce the restrictions based on
the competing goals of economic prosperity and human safety. It is expected that nation-wide lockdown
Page 6/15would be e cient in bringing down the value of Rt. In this study, 2nd April is considered as the starting
date from where lockdown policies will affect the value of Rt.
Fig II shows the mean value for Rt for different lockdown periods. The mean value of Rt for each
lockdown period has declined continuously, which shows that lockdown has helped in reducing Rt. It is
observed that India attained a maximum value of 1.81 (90% HDI 1.64, 2.00) on 1st April. The lockdown
slowly started to show an impact as Rt has declined substantially, and by the end of rst lockdown period
on 15th April, it reached to the level of 1.20 (90% HDI 1.08, 1.32) and further declined to Rt = 1.10(90% HDI
1.00,1.21) on 27th April, which shows that nation-wide lockdown has signi cantly lowered down the pace
of transmission of COVID-19. An increase was observed on 3rd May (Rt= 1.38 (90% HDI 1.30, 1.48)),
which declined to Rt =1.04 (90% HDI: 0.96, 1.13) as on 9th May before increasing again to Rt =1.14 (90%
HDI: 1.06, 1.21) on 17 May.
Fig III & Fig IV (A-D) reveals that almost all states show a decreasing pattern in Rt from the beginning to
the end of April, thereafter daily cases started to rise in the starting of May and Rt increased for almost all
states, but gets stabilized later. This indicates that nation-wide lockdown has had a positive effect in
stopping the spread of the virus across all states. However, the quantity of decline in the value of Rt
varied considerably among the states.
Role of state-level factors in explaining the disparity in the values of Rt
Multiple linear regression analysis was carried out to examine the impact of selected covariates on the
decline in ERN, and results are presented in Table II. The table clearly shows that after controlling the HDI,
index of governance and PCHE, tests conducted per million population during the lockdown period was
the signi cant factor at the 5% level of signi cance. The regression coe cient for the number of test
variable was 1.018, which indicates that as the number of tests increases, the declined in Rt was
observed. Further, this regression coe cient implies that the increase in testing rates helped in identifying
and isolating the infected people and which facilitated in reducing the Rt during the lockdown period.
Discussion
The world is going through a pandemic, and almost every country is affected by it. In India, proactive
measures like nation-wide lockdown and social distancing had been followed at an early stage of
infection. India’s Rt hit its peak on 1st April with Rt =1.81 (90% HDI: 1.64, 2.00) but declined to Rt = 1.20
(90% HDI: 1.08, 1.32) on 15th April, which shows that the nation-wide lockdown has slowed the
reproduction rate of COVID-19. Just when control of deadly virus seems to be going on the right track,
daily con rmed cases started rising from 28th April, and it has not slowed down yet. It increased the value
of Rt to the level of 1.38 (90% HDI 1.30, 1.48) on 3rd May due to the sudden spike in daily con rmed cases
of Punjab and Tamil Nadu. The reason for this sudden spike in Punjab is pilgrimage returnees from
Page 7/15Maharashtra’s Hazur Sahib in Nanded, which increased the Rt value for Punjab drastically17. While in
Tamil Nadu, this sudden spike in daily cases is linked to Koyambedu Market, a wholesale vegetable and
fruit market in Chennai. In fact, over 35 per cent of the cases reported in Tamil Nadu so far have been
traced to the Koyambedu market18. So, such lapses on the Government’s part takes away all the progress
made due to the lockdown. Again, on 17th May, the value of the effective reproductive number has again
increased slightly to Rt =1.14 (90% HDI: 1.06, 1.21) from Rt =1.04 (90% HDI: 0.96, 1.13) on 9th May. The
reason being, there is a sudden spike in the number of cases in almost all states last week, as the migrant
workers are returning back to their homes. Findings show that all phases of lockdown have brought a
decline in the reproduction number of India. However, these interventions could not completely work as
India is a diverse country where some states are highly developed in terms of health infrastructure and
human development, while some of the states are lagging in these facilities. This disparity in the states is
responsible for the fact that government interventions in India are not having the desired effect on
stopping the spread of the virus. Further, states like Punjab (Rt =0.69, 90% HDI: 0.42, 1.00), Tamil Nadu (Rt
= 0.94, 90% HDI: 0.79, 1.08) and Andhra Pradesh (Rt = 0.99, 90% HDI: 0.74, 1.27) are able to bring down
daily new cases by converging Rt to less than 1, less developed states like Jammu & Kashmir(Rt =1.26,
90% HDI: 0.97, 1.56), Odisha (Rt =1.29, 90% HDI: 1.03, 1.58) and Bihar (Rt =1.33, 90% HDI: 1.09, 1.59) still
have higher infection rates even at the end of Phase-3 lockdown as on 17th May.The possible reasons for
this disparity among states are rapid testing rate, Good Governance and social welfare. Our regression
analysis suggested that Testing Rate is the most signi cant factor that contributed to the decline of Rt
during the lockdown period. The testing rate in the state plays a vital role in identifying and isolating the
infected people and helped in reducing the Rt during the lockdown period. As per this study19, India is
detecting just 3.6% of the total number of infections of COVID-19 with a huge variation across its states.
They also suggest that India must increase its testing capacity and go for widespread testing, as late
detection of virus puts patients in greater need of ventilation and ICU care, which imposes greater costs
on the health systems. India should also adopt population-level random testing to assess the prevalence
of the infection. For detection of the true prevalence of COVID-19 infections in the country, India can
adopt the well-established National Family Health Survey (NFHS) framework as a solution to ascertain
the true prevalence of COVID-1920.
However, there might be other factors at the state level like lapses of state governments, the return of
migrant workers to their home, e cient contact tracing and quality of quarantine centres, which are
contributing in the spread of the infection but could not be quanti ed in the study. So, apart from the
factors considered here, these factors should also be accounted for in the studies to get a clearer picture.
Despite the afore-mentioned limitation, the present study is the rst attempt to study the causes of
variation among states in controlling the spread of the COVID 19. The ndings show that the strategy of
lockdown has contributed to slowing the spread of the virus to a greater extent. However, still, India has a
long way to go to control the spread of the virus and to maintain its effective reproduction number (Rt)
below one. In the wake of the current situation, complete lockdown is recommended as only three states
are able to maintain its effective reproduction number (Rt) below one. In the coming weeks, it is expected
Page 8/15that daily con rmed cases will rise in India as migrants are returning home in large numbers. So, the
number of isolation beds, ICU beds and ventilator beds should be increased in all states. This needs to be
done to accommodate a large number of cases for the coming weeks when the daily con rmed cases will
be at its peak, as health infrastructure is not up to the mark even in the developed states to handle a
pandemic of this magnitude.
Declarations
Funding Statement
No external funding was received in carrying out this study.
Con icts of interest
The authors have declared no con icts of interest.
Availability of Data
Data is open access and available at http://api.covid19india.org/states_daily_csv/con rmed.csv
References
1. Ferguson, N. M., Laydon, D., Nedjati-Gilani, G., Imai, N., Ainslie, K., & Baguelin, M. (2020). Imperial
College COVID-19 Response Team. Report 9: Impact of non-pharmaceutical interventions (NPIs) to
reduce COVID-19 mortality and healthcare demand.
2. World-Bank. Hospital beds (per 1,000 people). The World Bank Data Base –Retrieved
fromhttps://data.worldbank.org/indicator/SH.MED.BEDS.ZS?
end=2015&name_desc=false&start=2015&view=bar.
3. ILO (2020). ILO Monitor: COVID-19 and the world of work. Second edition
4. Heesterbeek, J. A. P. (2002). A brief history of R 0 and a recipe for its calculation. Acta
biotheoretica, 50(3), 189-204.
5. Delamater, P. L., Street, E. J., Leslie, T. F., Yang, Y. T., & Jacobsen, K. H. (2019). Complexity of the basic
reproduction number (R0). Emerging infectious diseases, 25(1), 1.
6. Diekmann, O., Heesterbeek, J. A. P., & Metz, J. A. (1990). On the de nition and the computation of the
basic reproduction ratio R 0 in models for infectious diseases in heterogeneous populations. Journal
of mathematical biology, 28(4), 365-382.
7. Bettencourt LMA, Ribeiro RM (2008) Real Time Bayesian Estimation of the Epidemic Potential of
Emerging Infectious Diseases. PLoS ONE 3(5): e2185.
https://doi.org/10.1371/journal.pone.0002185
8. Systrom, Kevin. The Metric We Need to Manage COVID-19. Rt: the effective reproduction number
http://systrom.com/blog/the-metric-we-need-to-manage-covid-19/
Page 9/159. Du Z, Xu X, Wu Y, Wang L, Cowling BJ, Ancel Meyers L. Serial interval of COVID-19 among publicly
reported con rmed cases. Emerg Infect Dis. 2020 Jun [date cited].
https://doi.org/10.3201/eid2606.200357
10. Nishiura, H., Linton, N. M., & Akhmetzhanov, A. R. (2020). Serial interval of novel coronavirus (COVID-
19) infections. International journal of infectious diseases.
11. Li, Q., Guan, X., Wu, P., Wang, X., Zhou, L., Tong, Y., … Feng, Z. (2020). Early transmission dynamics in
Wuhan, China, of novel coronavirus-infected pneumonia. New England Journal of Medicine, 382(13),
1199–1207. https://doi.org/10.1056/NEJMoa2001316
12. Linton, N. M., Kobayashi, T., Yang, Y., Hayashi, K., Akhmetzhanov, A. R., Jung, S., … Nishiura, H.
(2020). Incubation Period and Other Epidemiological Characteristics of 2019 Novel Coronavirus
Infections with Right Truncation: A Statistical Analysis of Publicly Available Case Data. Journal of
Clinical Medicine, 9(2), 538. https://doi.org/10.3390/jcm9020538
13. Fraser, C., Riley, S., Anderson, R. M., & Ferguson, N. M. (2004). Factors that make an infectious
disease outbreak controllable. Proceedings of the National Academy of Sciences, 101(16), 6146-
6151.
14. How asymptomatic cases fuelled spread of Coronavirus. The Times of India 2020. Retrieved from
https://timeso ndia.indiatimes.com/india/how-asymptomatic-cases-fuelled-spread-of-
coronavirus/articleshow/75292506.cms
15. White, L. F., Wallinga, J., Finelli, L., Reed, C., Riley, S., Lipsitch, M., & Pagano, M. (2009). Estimation of
the reproductive number and the serial interval in early phase of the 2009 in uenza A/H1N1
pandemic in the USA. In uenza and Other Respiratory Viruses, 3(6), 267–276.
https://doi.org/10.1111/j.1750-2659.2009.00106.x
16. Kucharski, A. J., Russell, T. W., Diamond, C., Liu, Y., Edmunds, J., Funk, S., … Flasche, S. (2020). Early
dynamics of transmission and control of COVID-19: a mathematical modelling study. The Lancet
Infectious Diseases, 20(5), 553–558. https://doi.org/10.1016/S1473-3099(20)30144-4
17. 167 pilgrims, who returned to Punjab from Hazur Sahib in Maharashtra, test COVID-19 positive. India
TV 2020: https://www.indiatvnews.com/news/india/maharashtra-hazur-sahib-nanded-76-pilgrims-
test-covid19-positive-in-amritsar-punjab-612947
18. Over 35% Tamil Nadu coronavirus cases linked to Koyambedu market in Chennai. The Indian
Express 2020. https://indianexpress.com/article/india/over-35-tn-cases-linked-to-a-market-in-
chennai-6408861/
19. Goli, S and James, K.S. (2020) How much India detecting SARS-CoV-2 Infections? A model-based
estimation. medRxiv preprint doi: https://doi.org/10.1101/2020.04.09.20059014.
20. Subramanian, S. V., & James, K. S. (2020). Use of the Demographic and Health Survey framework as
a population surveillance strategy for COVID-19. The Lancet Global Health.
Tables
Page 10/15Table I: Most Likely (ML) values of R t and Highest Density Interval (HDI) based on different Serial Interval (SI) & R 0, 24th March, 2nd April &
28th April 2020
24th March
SI=3 90% HDI SI=4 90% HDI SI=5 90% HDI SI=6 90% HDI SI=7 90% HDI
R 0=1.5 1.43 (1.19,1.68) 1.58 (1.28, 1.91) 1.72 (1.34,2.10) 1.86 (1.42,2.32) 2 (1.49,2.53)
R 0=2.0 1.43 (1.20,1.69) 1.58 (1,28, 1.90) 1.73 (1.37,2.13) 1.88 (1.45,2.35) 2.02 (1.50,2.53)
R 0=2.5 1.44 (1.21,1.70) 1.59 (1.29,1.91) 1.74 (1.39,2.15) 1.89 (1.46,2.35) 2.04 (1.55,2.58)
R 0=3.0 1.44 (1.21,1.70) 1.6 (1.30,1.92) 1.76 (1.38,2.13) 1.91 (1.49,2.38) 2.06 (1.56,2.58)
R 0=3.5 1.45 (1.22,1.71) 1.61 (1.31,1.93) 1.77 (1.41,2.16) 1.93 (1.49,2.37) 2.08 (1.60,2.62)
2nd April
SI=3 90% HDI SI=4 90% HDI SI=5 90% HDI SI=6 90% HDI SI=7 90% HDI
R 0=1.5 1.58 (1.45,1.72) 1.77 (1.60,1.93) 1.96 (1.76,2.15) 2.14 (1.92,2.37) 2.33 (2.14,2.59)
R 0=2.0 1.58 (1.45,1.72) 1.77 (1.60, 1.93) 1.96 (1.76,2.15) 2.15 (1.92,2.37) 2.33 (2.08,2.59)
R 0=2.5 1.59 (1.45,1.72) 1.78 (1.62, 1.96) 1.96 (1.77,2.16) 2.15 (1.93,2.38) 2.33 (2.08,2.59)
R 0=3.0 1.59 (1.45,1.72) 1.78 (1.62, 1.96) 1.96 (1.77, 2.16) 2.15 (1.93,2.38) 2.34 (2.09,2.60)
R 0=3.5 1.59 (1.45,1.72) 1.78 (1.61,1.94) 1.97 (1.77,2.16) 2.15 (1.93,2.38) 2.34 (2.09,2.60)
28th April
SI=3 90%HDI SI=4 90% HDI SI=5 90% HDI SI=6 90% HDI SI=7 90% HDI
R 0=1.5 1.13 (1.04,1.21) 1.16 (1.07, 1.28) 1.2 (1.09,1.33) 1.23 (1.10,1.36) 1.27 (1.14,1.43)
R 0=2.0 1.13 (1.04,1.21) 1.16 (1.06, 1.26) 1.2 (1.09,1.33) 1.23 (1.10,1.36) 1.27 (1.14,1.43)
R 0=2.5 1.13 (1.04,1.21) 1.16 (1.07,1.28) 1.2 (1.09,1.33) 1.23 (1.10,1.36) 1.27 (1.14,1.43)
R 0=3.0 1.13 (1.04,1.21) 1.16 (1.07, 1.28) 1.2 (1.09,1.33) 1.23 (1.10,1.36) 1.27 (1.14,1.43)
R 0=3.5 1.13 (1.04,1.21) 1.16 (1.07,1.28) 1.2 (1.09,1.33) 1.23 (1.10,1.36) 1.27 (1.14,1.43)
Source: Based on calculations of Jupyter Notebook https://sanzgiri.github.io/covid-19-dashboards/
Table II: Multiple Linear Regression with Difference in R t (between 2nd April and 9th May) as the dependent variable, India, 2020.
Page 11/15Difference in R t Coefficient Std. Error t P>t 95% Confidence Interval
Tests conducted** 1.018 0.3241 3.14 0.012 0.2849 1.7512
HDI Index -0.109 0.3888 -0.28 0.785 -0.9888 0.7703
Governance index -0.288 0.2911 -0.99 0.349 -0.9462 0.3708
PCHE -0.955 0.7156 -1.33 0.215 -2.5735 0.6643
constant -0.126 0.6547 -0.19 0.851 -1.6072 1.3549
R-squared 0.6042
Adjusted R-squared 0.4283
Source: Based on indicator values from various sources mentioned above and R t value from Jupyter Notebook https://sanzgiri.github.io/covid-19-
dashboards/
Figures
Figure 1
COVID-19 Testing Rate (test per million population) for states of India, 2020. Source: Data repository of
covid19india.org
Page 12/15Figure 2
Real-time effective Reproduction number (Rt) for India for all lockdown periods, 2020. Source: Based on
calculations of Jupyter Notebook https://sanzgiri.github.io/covid-19-dashboards/
Page 13/15Figure 3
Real-time effective Reproduction number (Rt) for India and states for all lockdown periods, 2020. Source:
Based on calculations of Jupyter Notebook https://sanzgiri.github.io/covid-19-dashboards/. Note: TT
represents India
Page 14/15Figure 4
(A): Real-time effective Reproduction number (Rt) for Maharashtra on 17th May 2020. Source: Based on
calculations of Jupyter Notebook https://sanzgiri.github.io/covid-19-dashboards/ (B): Real-time effective
Reproduction number (Rt) for Tamil Nadu on 17th May 2020. Source: Based on calculations of Jupyter
Notebook https://sanzgiri.github.io/covid-19-dashboards/ (C): Real-time effective Reproduction number
(Rt) for Gujarat on 17th May 2020. Source: Based on calculations of Jupyter Notebook
https://sanzgiri.github.io/covid-19-dashboards/ (D): Real-time effective Reproduction number (Rt) for
Delhi on 17th May 2020. Source: Based on calculations of Jupyter Notebook
https://sanzgiri.github.io/covid-19-dashboards/
Page 15/15You can also read