Forecasting the Prevalence of COVID-19 in Maharashtra, Delhi, Kerala, and India using an ARIMA model
←
→
Page content transcription
If your browser does not render page correctly, please read the page content below
Forecasting the Prevalence of COVID-19 in
Maharashtra, Delhi, Kerala, and India using an
ARIMA model
Strong P Marbaniang ( marbaniangstrong@gmail.com )
International Institute for Population Sciences https://orcid.org/0000-0001-5347-1867
Research Article
Keywords: COVID-19, Pandemic, ARIMA, Time series, Forecasting, India
DOI: https://doi.org/10.21203/rs.3.rs-34555/v1
License: This work is licensed under a Creative Commons Attribution 4.0 International License.
Read Full License
Page 1/16Abstract
Aims: As the whole world was preparing to welcome the year 2020, a new deadly virus, COVID-19, was
reported in the Wuhan city of China in late December 2019. By May 18, 2020, approximately 4.7 million
cases and 0.32 million deaths had been reported globally. There is an urgent need to predict the COVID-19
prevalence to control the spread of the virus.
Methods: Time-series analyses can help understand the impact of the COVID-19 epidemic and take
appropriate measures to curb the spread of the disease. In this study, an ARIMA model was developed to
predict the trend of COVID-19 prevalence in the states of Maharashtra, Delhi and Kerala, and India as a
whole.
Results: The prevalence of COVID-19 from 16 March 2020 to 17 May 2020 was collected from the
website of Covid19india. Several ARIMA models were generated along with the performance measures.
ARIMA (2,3,1), ARIMA (2,2,0), ARIMA (2,2,0), and ARIMA (1,3,1) with the lowest MAPE (5.430, 10.440,
2.607, and 2.390) for Maharashtra, Delhi, Kerala, and India were selected as the best t models
respectively. The ndings show that over the next 20 days, the total number of con rmed COVID-19 cases
may increase to 2.45 lakhs in India, 93,709 in Maharashtra, 19,847 in Delhi, and 925 in Kerala.
Conclusion: The results of this study can throw light on the intensity of the epidemic in the future and will
help the government administrations in Maharashtra, Delhi, and Kerala to formulate effective measures
and policy interventions to curb the virus in the coming days.
Introduction
COVID-19, a global pandemic, is an emerging disease that spreads from human to human and is
responsible for infecting millions and killing thousands of people since the rst reported fatal cases in
late 2019. COVID-19 belongs to the family of zoonotic coronaviruses such as the Severe Acute
Respiratory Syndrome coronavirus (SARS-Cov) and the Middle East Respiratory Syndrome (MERS-Cov)
that have their origin in bats, mice, and domestic animals. The virus rst emerged in Wuhan, the capital
city of China’s Hubei province, in late December 2019. In just a few months, the virus spread rapidly
across the world, reaching a total of approximately 4.7 million con rmed cases and 315,496 deaths as of
18 May 2020 (Hopkins 2020). The rst case of COVID-19 in India was reported in Kerala on the 30th of
January 2020, with origins in China (PIB 2020). By 17 May 2020, India had registered a total of 95,698
con rmed cases and 30,24 deaths (Covid19 2020).
As of today, the disease has spread all over the world. The number of con rmed COVID-19 cases vary due
to the differences in the testing and disease surveillance capacities across the countries and regions.
Since there is no valid treatment method and prevention for this virus yet, effective planning and proper
implementation of the health infrastructure and services is the only way to control the spread of the virus.
Page 2/16For this reason, accurate forecasting of future total con rmed cases plays a vital role in managing the
health system and allows the decision-makers to develop a strategic plan and interventions to avoid a
possible epidemic. Also, such estimates help in guiding the intensity and types of interventions needed to
lessen the outbreak (Wang et al. 2020; Zhang et al. 2020). To estimate the number of additional
manpower and resources needed to control the outbreak, a mathematical and statistical modeling tool is
required that can be used for making short- and long-term disease forecasting.
In the last few years, studies have used different statistical methods such as multivariate linear
regression (Thomson et al. 2006), simulation-optimization approach (Nsoesie et al. 2013), generalized
growth model and generalized logistic model (Chowell et al. 2020), holt method (Myrzakerimova et al.
2020), and grey model (Zhang et al. 2017) to forecast epidemic cases. These statistical models, however,
are inadequate for analyzing the in uence of randomness on the epidemic outbreak. Random factors
play an important role in the spread of a disease as Nakamura and Martinez have described in their study
(Nakamura and Martinez 2019).
Autoregressive integrated moving average (ARIMA) models are the most commonly used prediction
models and are considered to be the best (Wang et al. 2018) for predicting epidemic diseases, such as
malaria (Anokye et al. 2018), tuberculosis (Zheng et al. 2015), measles (Sharmin and Rayhan 2011), and
in uenza (He and Tao 2018). An ARIMA model is commonly used for predicting the time series data of
infectious diseases, especially for series that have a cyclical or repeating pattern. Mostly, it deals with
non-stationary time series in order to capture the linear trend of an epidemic or a disease, and it mainly
predicts a future time series value by considering the previous time series values and the lagged forecast
error.
In recent studies, different models have been used to predict the prevalence, incidence, and mortality rate
of COVID-19. Perone (2020) used an ARIMA model and predicted that Italy would reach the in ection
point in terms of cumulative cases during the months of April and May (Perone 2020). Zhao et al. (2020)
applied the Metropolis-Hastings algorithm and predicted the effects of three epidemic intervention
scenarios, that is, suppression, mitigation, and mildness in controlling the spread of COVID-19 in African
countries (Zhao et al. 2020). Wang et al. (2020) used the SEIR model and virus reproduction rate R to
predict the number of infectious cases in Wuhan, China (Wang et al. 2020).
With the rising number of COVID-19 cases every day, there is a lot of stress on the administration and the
health care system in India for accommodating patients with symptoms of COVID-19. Hence, the
prediction of the estimated new cases in the coming days will help the health administration make
adequate arrangements with ample time.
This paper aims to forecast the prevalence of COVID-19 cases in Maharashtra, Delhi, Kerala, and India as
a whole. The COVID-19 data corresponds to the period between 16 March 2020 and 17 May 2020. The
best t ARIMA model was used to estimate the prevalence of COVID-19 cases for a period of 20 days. In
addition to highlighting the characteristics of the epidemic and the behavior of its spread, this study also
provides the health authorities crucial information about the intensity of the epidemic at peak times using
Page 3/16ARIMA model. These models can help predict the health infrastructure and materials the patients will need in the future. Data Source And Methods Data For the validation and analysis of the proposed study, the prevalence of COVID-19 cases was taken from the (Covid19 2020), and Microsoft Excel was used to build a time-series database. The minimum sample size required for time series forecasting is 30 observations (Yaffee and McGee 2000). Hence in this study, 63 time-series observations between 16 March 2020 and 17 May 2020 were used to predict the prevalence of COVID-19 cases over the next 20 days with a 95% con dence interval limit. All analyses were performed using Statgraphics Centurion XVII.II software, with p-value
[Please see the supplementary les section to view the equations.] (3)

Where C is a constant and (k=1, 2…q) are the values of the previous random shock. Time series analysis
requires a stationary time series, that is, the series shows no uctuation or periodicity with time (Wang et
al. 2018). In an ARIMA model, a non-stationary time series is made stationary by applying nite
differencing to the time series. The differenced stationary time series can be modeled as an ARIMA model
to perform an ARIMA forecasting (He and Tao 2018).

Best t model selection

Once a model is generated, it is necessary to test the goodness of the model t before forecasting future
values. The accuracy of the model can be determined by comparing the actual values with the predicted
values. In this study, we used three performance measures, namely Mean Absolute Error (MAE), Mean
Absolute Percentage Error (MAPE), and Root Mean Square Error (RMSE), to test the forecasting accuracy
of a particular model. Mathematically, these measures are expressed as in Eq (4), (5), and (6).

[Please see the supplementary les section to view the equations.]       (4)

  (5)

(6)

Where is the actual value at time t, and is the difference between the actual and the predicted values.
Also, n is the number of time points. Lower MAE, MAPE, and RMSE values indicate a model that best ts
the data (Tseng and Shih 2019).

Steps involved in ARIMA modeling

Four critical steps are involved in the ARIMA modeling, namely, identi cation, estimation, diagnostic
checking, and forecasting. The rst step is to check the seasonality and stationarity of the time series
data by drawing a time series plot of the observed series with the corresponding time. A time series is
considered as stationary if a shift in time doesn’t cause a change in the shape of the distribution, that is,
the statistical properties such as mean, variance, and autocorrelation are constant over time. The
stationarity of time-series data is important as it helps develop powerful techniques to forecast future
values (Brockwell and Davis 2001). The second step is to construct the autocorrelation (ACF) and the
partial autocorrelation (PACF) plots of the stationary time series to determine the order of the AR and MA
processes. The ACF is the correlation between the observation at time t and the observation at a different
time lag, while PACF is the amount of correlation between the current observation at time t and the
observation at lag k that is not explained by the correlation at all lower-order lags (that is, lag
Results
Prevalence and incidence of COVID-19
Table 1 Descriptive statistics of the Prevalence and Incidence of Covid-19 in Maharashtra, Delhi, Kerala,
and India
Cases States Mean St. Dev Minimum Maximum Skewness Kurtosis
Prevalence Maharashtr 7563 9311 38 33053 1.258 0.468
a
Delhi 2591 2828 7 9755 1.065 0.022
Kerala 356 167 27 602 -0.701 -0.646
India 24515 27533 14 95697 1.107 0.091
Incidence Maharashtr 524 573 3 2347 1.2 0.746
a
Delhi 155 153 0 39 0.783 -0.839
Kerala 9 8 0 472 1.384 2.243
India 1517 1414 14 5049 0.846 -0.436
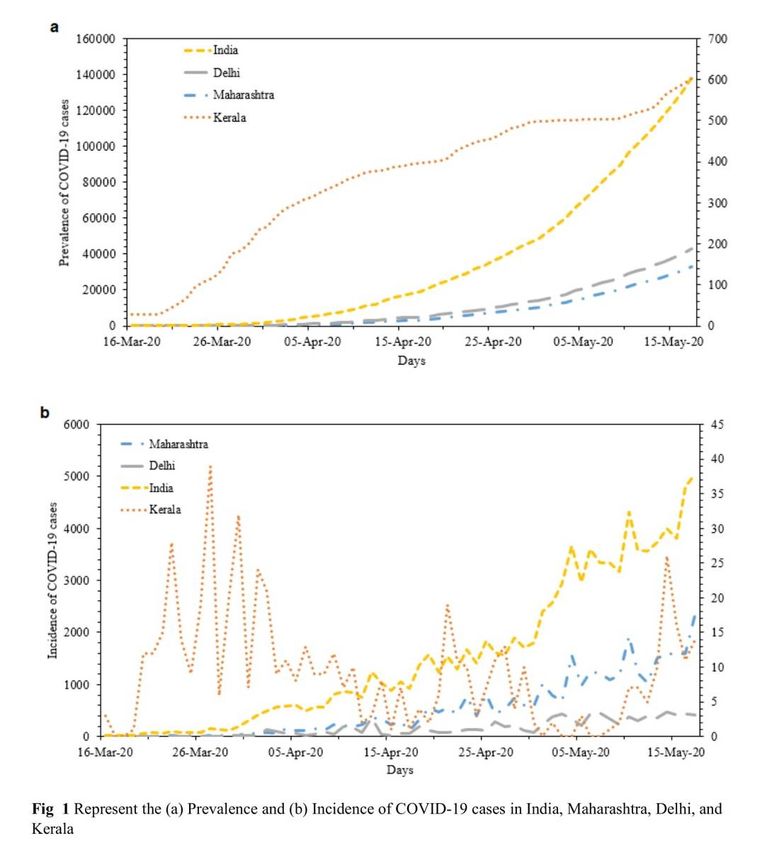
The descriptive statistics of the prevalence and incidence of COVID-19 in Maharashtra, Delhi, Kerala, and India
are given in Table 1. As seen in Fig 1, the overall prevalence curve of COVID-19 in India has been growing at a
steep rate, with the states of Maharashtra and Delhi following a similar trend. With an average of 9 new cases
per day, Kerala started showing signs of flattening the epidemic curve post-April 25. Maharashtra was one of the
most hard-hit states of India, with a total of 33,053 confirmed COVID-19 cases and 524 average daily new cases
during the period. In the national capital Delhi, the first case of COVID-19 was reported on the 2nd of March, and
since then, the number of confirmed cases has climbed to about 9,755 cases.
Forecasting the prevalence of COVID-19 pandemic using the time series ARIMA model
Table 2 Comparison of ARIMA models performance measures.
Page 6/16States Model RMSEa MAEb MAPEc
Maharashtra ARIMA (2,3,1) 205.183 131.287 5.430
ARIMA (1,3,1) 238.769 148.352 7.270
ARIMA (2,3,0) 279.522 179.476 5.737
Delhi ARIMA (2,2,0) 83.333 56.789 10.440
ARIMA (2,2,1) 77.176 55.332 15.058
ARIMA (3,2,0) 81.416 54.591 11.442
Kerala ARIMA (2,2,0) 7.071 5.010 2.607
ARIMA (2,2,1) 7.132 5.008 2.606
ARIMA (1,2,0) 8.154 5.563 2.794
India ARIMA (1,3,1) 292.565 205.074 2.390
ARIMA (2,3,1) 291.436 208.68 2.356
ARIMA (3,3,1) 293.998 207.898 2.407
a
Root Mean Square Error, b Mean Absolute Error, c Mean Absolute Percentage Error
Table 3 Parameters of best t ARIMA models.
States Best fit Parameter Coefficient S. Ea t-statistic p-value Box-Pierce
Model s statistic p-value
Maharasht ARIMA AR (1) -0.817 0.122 -6.686lines help identify the presence of non-zero autocorrelation. The ACF plot confirms that the prevalence of
COVID-19 is not stationary as the autocorrelation is seen to reduce slightly with increasing lag (see Appendix).
The first- and second-order differencing were taken to stabilize the mean of COVID-19 prevalence for
Maharashtra, Delhi, Kerala, and India. After the second-order differencing, the series became stationary, and the
parameters of the ARIMA model were determined according to the ACF and PACF plots as shown in Fig 2. All
the analyses were performed on the transformed prevalence of COVID-19. The ARIMA model with the lowest
MAPE and statistically significant parameters was selected as the best model for forecasting. ARIMA (2,3,1),
ARIMA (2,2,0), ARIMA (2,2,0), and ARIMA (1,3,1) were selected as the best fit models for Maharashtra, Delhi,
Kerala, and India respectively. With the minimum MAPE Maharashtra= 5.430, MAPE Delhi= 10.440, MAPE Kerala=
2.607, and MAPE India= 2.390, the models fitted the prevalence of COVID-19 very well (Fig 2 and Table 2). All
the estimated parameters of the best fit models and the Box-Pierce test statistic are presented in Table 3. The
fitted and predicted total confirmed COVID-19 cases are presented in Table 4 and Fig 3. For the next 20 days,
the total number of confirmed COVID-19 cases is estimated to be from 79,406 to 1,08,013 in Maharashtra,
14,423 to 25,272 in Delhi, 554 to 1295 in Kerala, and 2,18,484 to 2,73,172 in India.
Table 4 Prediction of the total con rmed Covid-19 cases for the next 20 days according to ARIMA models
with 95% con dence interval.
Page 8/16Date Maharashtra Delhi Kerala India
ARIMA (2,3,1) ARIMA (2,2,0) ARIMA (2,2,0) ARIMA (1,3,1)
Forecas Lower Upper Forecas Lower Upper Forecas Lower Upper Forecas Lower Upper
t t t t
18- 34987 34576 35398 10193 10026 10360 617 603 631 10101 10042 10159
May- 0 4 6
20
19- 37054 36398 37710 10640 10332 10948 630 607 654 10657 10548 10766
May- 6 5 7
20
20- 39463 38534 40393 11091 10632 11549 645 612 678 11233 11056 11409
May- 0 2 8
20
21- 41740 40399 43082 11549 10910 12188 660 614 706 11830 11577 12084
May- 7 1 2
20
22- 44159 42396 45921 12015 11177 12854 675 615 734 12449 12108 12790
May- 5 2 9
20
23- 46767 44541 48994 12488 11435 13542 690 616 764 13090 12652 13529
May- 7 2 2
20
24- 49376 46608 52144 12968 11683 14253 705 615 795 13754 13209 14299
May- 1 0 3
20
25- 52116 48773 55460 13455 11924 14987 721 614 827 14440 13779 15101
May- 4 4 3
20
26- 54993 51025 58961 13949 12157 15741 736 612 861 15149 14364 15935
May- 7 0 5
20
27- 57932 53280 62584 14450 12385 16515 752 609 895 15882 14963 16802
May- 6 2 0
20
28- 60996 55615 66376 14958 12607 17310 769 606 931 16639 15577 17701
May- 3 4 2
20
29- 64179 58019 70339 15473 12824 18123 785 602 968 17420 16207 18633
May- 2 2 2
20
30- 67455 60461 74450 15995 13036 18955 802 598 1005 18225 16852 19598
May- 7 8 6
20
31- 70853 62975 78731 16525 13244 19805 819 593 1044 19056 17514 20597
May- 1 7 5
20
01-Jun- 74369 65555 83184 17061 13448 20674 836 588 1084 19911 18193 21630
20 9 3 5
02-Jun- 77994 68189 87799 17604 13649 21559 853 582 1124 20793 18888 22697
20 3 9 7
Page 9/1603-Jun- 81741 70894 92589 18154 13846 22462 871 576 1166 21700 19601 23799
20 7 9 6
04-Jun- 85609 73665 97554 18712 14041 23382 888 569 1208 22634 20332 24936
20 5 5 5
05-Jun- 89596 76500 10269 19276 14233 24319 907 562 1251 23595 21081 26109
20 3 1 3 0
06-Jun- 93709 79406 10801 19847 14423 25272 925 554 1295 24582 21848 27317
20 3 8 4 2
Discussion
In an effort to slow down the spread of COVID-19, the Indian government took strong measures by
announcing a countrywide lockdown on 24 March 2020 as the number of con rmed positive cases were
increasing in the country. Estimating the prevalence and intensity of an epidemic is crucial for allocating
medical and health resources, production of activities, and even the economic situation of the country.
Hence developing a forecasting model that accurately predicts the future intensity of an epidemic can
help the government administrators and decision-makers prepare the manpower and medical supplies
required during an outbreak. In this study, the ongoing trend and the intensity of the COVID-19 pandemic
were estimated using the ARIMA time series model. The ARIMA model is one of the best models and has
been extensively employed to predict the incidence of contagious diseases (Wang et al. 2018a). To the
best of our knowledge, this is the rst study in India to apply the ARIMA model to estimate the prevalence
of COVID-19 in India and its major states.
India has reported a lower COVID-19 death rate as compared to countries like China, United Kingdom,
Italy, Spain, and the United States (Ghosal et al. 2020). However, the total con rmed COVID-19 cases in
most of the Indian states show no sign of a downward trend. At the time of writing this article, India had
82,000 positive con rmed cases (Covid19 2020) and was expected to overtake China's total COVID-19
cases shortly. Minhas (2020), in his study, points out that India is another potential epicenter of the global
COVID-19 pandemic due to human overpopulation and unhygienic living conditions (Minhas 2020).
Containing the spread of the virus among the economically disadvantaged people, who may not be able
to self-isolate, is a challenge. In Maharashtra, the number of daily new cases since March 16 has grown
exponentially and crossed the 1000-cases-per-day mark on May 6. Mumbai, the state capital of
Maharashtra and also India’s nancial capital, has been the worst hit city by COVID-19, having recorded
15,750 total cases accounting for 20 percent of all positive COVID-19 cases in India (Dutta 2020). Kerala
reported the rst case of COVID-19 in India; however, over a period of one month, the daily new con rmed
cases signi cantly reduced to zero for ve consecutive days (Covid19 2020). Delhi, the national capital,
reported 472 COVID-19 cases in a single day on May 14, the highest jump so far. With the lockdown curbs
being relaxed after May 17, the number of new cases may increase further (Dutt 2020). This pattern will
burden the health system to its maximum capacity. As a result, if adequate measures to contain the
Page 10/16spread are not appropriately enforced, and social distancing is not maintained, the number of cases is
not expected to plateau any time soon
Conclusions
An epidemic is a numbers game and as far as numbers are concerned, India has a handful of them. With
no valid medical treatment and preventive measures for this virus to date, forecasting the prevalence of
the disease is a vital strategy to strengthen the surveillance and allocate health resources accordingly.
Our forecasting model shows that if left unchecked, the intensity of the epidemic in India is likely to cross
2.45 lakh cases by 6 June 2020 and overburden the health care system. The results of the study will help
health authorities and health care management plan the necessary supply resources, which include
medical staff, medical equipment, intensive care facilities, hospital beds, and other healthcare facilities.
This will make the epidemic controllable and bring it within the domain of the available healthcare
resources in India.
References
Anokye R, Acheampong E, Owusu I, Isaac-Obeng E (2018). Time series analysis of malaria in Kumasi:
Using ARIMA models to forecast future incidence. Cogent Social Sciences, 4(1), 1–13.
https://doi.org/10.1080/23311886.2018.1461544
Brockwell PJ, Davis RA (2001). Introduction to Time Series and Forecasting (Second). Springer.
Chowell G, Luo R, Sun K, Roosa K, Tariq A, Viboud C (2020). Real-time forecasting of epidemic trajectories
using computational dynamic ensembles. Epidemics, 30(August 2019).
https://doi.org/10.1016/j.epidem.2019.100379
Covid19 (2020). Covid19 India. https://www.covid19india.org/. Accessed May 18 2020
Dutt A (2020). Biggest single-day spike as Delhi Covid-19 cases cross 8,000.
https://www.hindustantimes.com/cities/biggest-single-day-spike-as-delhi-covid-cases-cross-8-000/story-
5db5akpH7KnZIoZChnBdXL.html. Accessed May 15 2020.
Dutta PK (2020). Covid-19: Maharashtra has 33%, Mumbai 20% of all-India cases. Where they failed.
https://www.indiatoday.in/news-analysis/story/covid-19-maharashtra-has-33-mumbai-20-of-all-india-
cases-where-they-failed-1677894-2020-05-14. Accessed May 15 2020.
Ghosal S, Sengupta S, Majumder M, Sinha B (2020). Prediction of the number of deaths in India due to
SARS-CoV-2 at 5–6 weeks. Diabetes and Metabolic Syndrome: Clinical Research and Reviews, 14(4),
311–315.
He Z, Tao H (2018). Epidemiology and ARIMA model of positive-rate of in uenza viruses among children
in Wuhan, China: A nine-year retrospective study. International Journal of Infectious Diseases, 74, 61–70.
Page 11/16Hopkins J (2020). COVID-19 Dashboard by the Center for Systems Science and Engineering (CSSE) at
Johns Hopkins University. https://coronavirus.jhu.edu/map.html. Accessed May 18 2020.
Minhas S (2020). Could India be the origin of next COVID-19 like epidemic? Science of the Total
Environment, 728.
Myrzakerimova AB, Shaizat M, Duisebekova KS, Nurmaganbetova MO (2020). Forecasting risk of
diseases in Kazakhstan with using mapping technique based on 9 years statistics. Procedia Computer
Science, 170, 75–81.
Nakamura GM, Martinez AS (2019). Hamiltonian dynamics of the SIS epidemic model with stochastic
uctuations. Scienti c Reports, 9(1), 1–9. https://doi.org/10.1038/s41598-019-52351-x
Nsoesie EO, Beckman RJ, Shashaani S, Nagaraj KS, Marathe MV (2013). A Simulation Optimization
Approach to Epidemic Forecasting. PLoS ONE, 8(6). https://doi.org/10.1371/journal.pone.0067164
Perone G (2020). An ARIMA Model to Forecast the Spread of COVID-2019 Epidemic in Italy. SSRN
Electronic Journal, (April). https://doi.org/10.2139/ssrn.3564865
PIB (2020). No Title. https://pib.gov.in/pressreleaseiframepage.aspx?prid=1601095. Accessed May 12
2020
Sharmin S, Rayhan I (2011). Modelling of infectious diseases for providing signal of epidemics: A
measles case study in Bangladesh. Journal of Health, Population and Nutrition, 29(6), 567–573.
https://doi.org/10.3329/jhpn.v29i6.9893
Thomson MC, Molesworth AM, Djingarey MH, Yameogo KR, Belanger F, Cuevas LE (2006). Potential of
environmental models to predict meningitis epidemics in Africa. Tropical Medicine and International
Health, 11(6), 781–788. https://doi.org/10.1111/j.1365-3156.2006.01630.x
Tseng YJ, Shih YL (2019). Developing epidemic forecasting models to assist disease surveillance for
in uenza with electronic health records. International Journal of Computers and Applications, 0(0), 1–6.
https://doi.org/10.1080/1206212X.2019.1633762
Wang H, Wang Z, Dong Y, Chang R, Xu C, Yu X et al (2020). Phase-adjusted estimation of the number of
Coronavirus Disease 2019 cases in Wuhan, China. Cell Discovery, 6(1), 4–11.
https://doi.org/10.1038/s41421-020-0148-0
Wang Y, Shen Z, Jiang Y (2018). Comparison of ARIMA and GM(1,1) models for prediction of hepatitis B
in China. PLoS ONE, 13(9), 1–11. https://doi.org/10.1371/journal.pone.0201987
Wang Y, Xu C, Wang Z, Zhang S, Zhu Y, Yuan J (2018a). Time series modeling of pertussis incidence in
China from 2004 to 2018 with a novel wavelet based SARIMA-NAR hybrid model. PLoS ONE, 13(12), 1–
23. https://doi.org/10.1371/journal.pone.0208404
Page 12/16Yaffee RA, McGee M (2000). Introduction To Time Series Analysis and Forecasting with application of
SAS and SPSS (1st ed.). Academic Press.
Zhang L, Wang L, Zheng Y, Wang K, Zhang X, Zheng Y (2017). Time prediction models for echinococcosis
based on gray system theory and epidemic dynamics. International Journal of Environmental Research
and Public Health, 14(3). https://doi.org/10.3390/ijerph14030262
Zhang S, Diao MY, Yu W, Pei L, Lin Z, Chen D (2020). Estimation of the reproductive number of novel
coronavirus (COVID-19) and the probable outbreak size on the Diamond Princess cruise ship: A data-
driven analysis. International Journal of Infectious Diseases, 93, 201–204.
https://doi.org/10.1016/j.ijid.2020.02.033
Zhao Z, Li X, Liu F, Zhu G, Ma C, Wang L (2020). Prediction of the COVID-19 spread in African countries
and implications for prevention and controls: A case study in South Africa, Egypt, Algeria, Nigeria,
Senegal and Kenya. Science of The Total Environment, 729, 138959.
https://doi.org/10.1016/j.scitotenv.2020.138959
Zheng YL, Zhang LP, Zhang XL, Wang K, Zheng YJ (2015). Forecast model analysis for the morbidity of
tuberculosis in Xinjiang, China. PLoS ONE, 10(3), 1–13. https://doi.org/10.1371/journal.pone.0116832
Declarations
Authorship: Strong P. Marbaniang contributed to the study conception and design, material preparation,
conducted the formal analysis, interpreted the results, and writing the original manuscript.
Conflict of interest statement: The authors declare that they have no conflicts of interest.
Role of funding source: This study did not receive any specific grant from any funding agency in the public,
commercial, or not-for-profit sectors.
Ethical Approval: Non sought
Figures
Page 13/16Figure 1
Represent the (a) Prevalence and (b) Incidence of COVID-19 cases in India, Maharashtra, Delhi, and
Kerala
Page 14/16Figure 2
The estimated ACF and PACF plot to predict the trend of Covid-19 prevalence for (a-b) Maharashtra (c-d)
Delhi (e-f) Kerala, and (g-h) India.
Page 15/16Figure 3
Time series forecasting plot estimated from ARIMA best- t model for (a) Maharashtra (b) Delhi (c) Kerala,
and (d) India
Supplementary Files
This is a list of supplementary les associated with this preprint. Click to download.
Appendix.doc
MethodswithEquations.docx
Page 16/16You can also read