NOVEL CORONAVIRUS 2019-NCOV: EARLY ESTIMATION OF EPIDEMIOLOGICAL PARAMETERS AND EPIDEMIC PREDICTIONS - MEDRXIV
←
→
Page content transcription
If your browser does not render page correctly, please read the page content below
medRxiv preprint doi: https://doi.org/10.1101/2020.01.23.20018549. The copyright holder for this preprint (which was not peer-reviewed)
 is the author/funder, who has granted medRxiv a license to display the preprint in perpetuity.
 It is made available under a CC-BY-NC-ND 4.0 International license .

 Novel coronavirus 2019-nCoV: early estimation of epidemiological parameters and
 epidemic predictions
 Version 2. Updated 27 Jan 2020

 Jonathan M. Read1, Jessica R.E. Bridgen1, Derek A.T. Cummings2, Antonia Ho3, Chris P.
 Jewell1

 Affiliations:
 1. Centre for Health Informatics, Computing and Statistics, Lancaster Medical School,
 Lancaster University, Lancaster, United Kingdom.
 2. Department of Biology and Emerging Pathogens Institute, University of Florida,
 Gainesville, United States of America.
 3. Medical Research Council-University of Glasgow Centre for Virus Research, Glasgow,
 United Kingdom.

 Correspondence: jonathan.read@lancaster.ac.uk

 Changes to previous version:
 ● case data updated to include 22 Jan 2020; we did not use cases reported after this
 period as cases were reported at the province level hereafter, and large-scale control
 interventions were initiated on 23 Jan 2020;
 ● improved likelihood function, better accounting for first 41 confirmed cases, and now
 using all infections (rather than just cases detected) in Wuhan for prediction of
 infection in international travellers;
 ● improved characterization of uncertainty in parameters, and calculation of epidemic
 trajectory confidence intervals using a more statistically rigorous method;
 ● extended range of latent period in sensitivity analysis to reflect reports of up to 6 day
 incubation period in household clusters;
 ● removed travel restriction analysis, as different modelling approaches (e.g. stochastic
 transmission, rather than deterministic transmission) are more appropriate to such
 analyses.

 Abstract

 Since first identified, the epidemic scale of the recently emerged novel coronavirus (2019-
 nCoV) in Wuhan, China, has increased rapidly, with cases arising across China and other
 countries and regions. using a transmission model, we estimate a basic reproductive number
 of 3.11 (95%CI, 2.39–4.13); 58–76% of transmissions must be prevented to stop increasing;
 Wuhan case ascertainment of 5.0% (3.6–7.4); 21022 (11090–33490) total infections in
 Wuhan 1 to 22 January.

 Background and current epidemic situation

 On 29 December 2019, Chinese authorities identified a cluster of similar pneumonia cases
 of unknown aetiology in Wuhan City, Hubei Province, China (Tan et al., 2020). A novel strain
 of coronavirus (2019-nCoV) was subsequently isolated from a patient on 7 January 2020
 (Tan et al., 2020). Most cases from the initial cluster had epidemiological links with a live
 animal market (Huanan South China Seafood Market), suggesting a possible zoonotic origin

 1
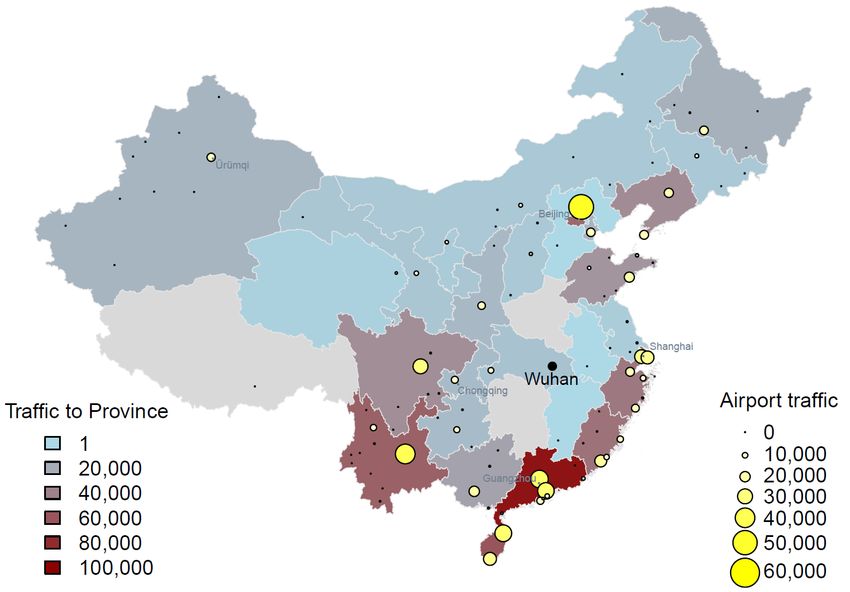
medRxiv preprint doi: https://doi.org/10.1101/2020.01.23.20018549. The copyright holder for this preprint (which was not peer-reviewed)
 is the author/funder, who has granted medRxiv a license to display the preprint in perpetuity.
 It is made available under a CC-BY-NC-ND 4.0 International license .

 (World Health Organization, 2020). However, the definitive source of the virus is unknown.
 Infections in at least one family cluster (Chan et al., 2020) and in healthcare workers confirm
 the occurrence of human-to-human transmission, though the extent of this mode of
 transmission is unclear. On 21 January 2020, the WHO suggested there was possible
 sustained human-to-human transmission (World Health Organization Western Pacific on
 Twitter, 2020).

 As of 1000 GMT 25 Jan 2020, 1,372 cases had been confirmed (Munroe, 2020), of which
 more than 700 were from Hubei Province (BBC News, 2020). Cases have also been
 reported in other Chinese provinces, including large cities such as Beijing, Shanghai and
 Shenzhen, as well as other countries, including Thailand (n=5), Japan (n=2), South Korea
 (n=2), Taiwan (n=3), Malaysia (n=1), Singapore (n=3), Nepal (n=1), Vietnam (n=2), United
 States (n=2), Australia (n=1), and France (n=3) (European Centre for Disease Prevention
 and Control, 2020). In a case series of the first 41 hospitalised cases in Wuhan, presenting
 symptoms included fever, cough, myalgia and fatigue (Huang et al., 2020). Over half had
 shortness of breath, and all had evidence of pneumonia (Huang et al., 2020). To date, 41
 deaths have been reported, all but two were from the Hubei province (European Centre for
 Disease Prevention and Control, 2020).

 Current clinical and epidemiological data are insufficient to understand the full extent of the
 transmission potential of the epidemic. Estimates in this manuscript are highly uncertain due
 to uncertainty about the timing and natural history of cases, the impact of changes in
 reporting over the course of the outbreak and the potential impact of responses to cases
 among other sources. The outbreak comes at a time when there is a substantial increase in
 travel volume within as well as in and out of China around the Lunar New Year on 25
 January 2019. Over 3 billion passenger journeys were predicted for the period between 10
 January and 18 February (CGTN, 2020). In an effort to contain the outbreak, travel
 restrictions were imposed on Wuhan from 23 January, and have since expanded to 12 other
 cities, and large social gatherings cancelled (New York Times, 2020).

 Domestic and international connectivity of Wuhan

 Wuhan is a city of more than 11 million residents and is connected to other cities in China
 via high-speed railway and frequent commercial airline flights. There were 670,417 airline
 passenger bookings departing Wuhan made during January 2017, the top destinations being
 Shanghai (53,214 bookings), Beijing (51,066 bookings) and Kunming (40,120 bookings)
 (OAG, 2020); Figure 1. While the majority of air travel departing Wuhan is domestic (87.2%
 of bookings, Jan 2017), Wuhan is connected internationally through both direct and indirect
 flights (Bogoch et al., 2020).

 Transmission model

 We fitted a deterministic SEIR metapopulation transmission model of infection within and
 between major Chinese cities to the daily number of confirmed cases of 2019-nCoV in
 Chinese cities and cases reported in other countries/regions, using an assumption of
 Poisson-distributed daily time increments (see Methods Supplement). We modelled the
 period from 1 January 2020 when local authorities closed the wet market implicated as the
 zoonotic source of human infection (World Health Organization, 2020) up to and including

 2
medRxiv preprint doi: https://doi.org/10.1101/2020.01.23.20018549. The copyright holder for this preprint (which was not peer-reviewed)
 is the author/funder, who has granted medRxiv a license to display the preprint in perpetuity.
 It is made available under a CC-BY-NC-ND 4.0 International license .

 22nd January 2020. We only considered human-to-human transmission in our model, and
 made the assumption that following the closure of the market, no further zoonotic infection
 contributed to the epidemic dynamics. Coupling between cities followed daily-adjusted rates
 of travel estimated from monthly-aggregated full itinerary passenger booking data for
 January 2017, accessed from OAG Traffic Analyser database (OAG, 2020), assuming that
 travellers are drawn randomly from the origin population.

 We estimated the transmission rate and the recovery rate (the inverse of the infectious
 period). We assumed that the latent period was 4 days, based on an estimate of the
 incubation period of SARS, a related coronavirus (Lessler et al., 2009). This is similar to the
 estimate of 4.4 days from initial characterisation of 2019-nCoV cases. We make the
 assumption that the latent period approximates to the incubation period. We also estimated
 the ascertainment rate within Wuhan, and the initial number of human infections present in
 Wuhan when the market was closed. Confirmed cases in Chinese cities and other
 countries/regions reported as of 22 January 2020 were used for fitting; from 23 January
 cases were not reported for Wuhan and other locations within Hubei but only at the
 aggregate province level. Fitting was achieved by treating the ODE system as representing
 the mean number of new cases per day in our study period, and assuming that the observed
 number of new cases were (approximately) Poisson distributed around this mean. Given the
 model and data, parameter inference was achieved by maximum likelihood estimation using
 Nelder-Mead optimisation as implemented in the optim() function in the R statistical
 language (R Core Team 2020); see https://github.com/chrism0dwk/wuhan/tree/v0.2 for R
 code, case data, and prepared datafiles.

 Uncertainty in the parameter estimates was explored using parametric bootstrap according
 to the following procedure. Firstly, 10000 Monte Carlo simulations from the model (ODE and
 Poisson noise) were generated using the MLE estimates of the parameters. Each simulated
 dataset was then re-fitted to the model to construct a joint sampling distribution of the
 parameters, and 95% confidence estimated as the lower 2.5% and upper 97.5% quantiles.
 The ODE system (without Poisson noise) was run over this sampling distribution to generate
 95% confidence intervals around the predicted mean epidemic trajectory.

 Epidemiological parameter estimates

 We estimated the transmission rate within Wuhan, , to be 1.94 d-1 (95%CI, 1.25–6.71),
 while we found the infectious period to be 1.61 days (95%CI, 0.35–3.23). We calculated the
 basic reproductive number, 0 , of the infection to be 3.11 (95%CI, 2.39–4.13), comparable
 to the range for SARS estimated from outbreaks during the 2003 epidemic (Lipsitch et al.,
 2003; World Health Organization, 2003). We highlight that this number is highly uncertain
 and that a large range of parameters are consistent with the data given the assumptions of
 our model. This estimate reflects both the dynamics of transmission and, potentially, the
 dynamics of case reporting, with increases as reporting over time potentially increasing our
 estimate. The estimate we give here represents an update from the report of 23 January in
 which we estimated a higher 0 , and highlights the sensitivity of our findings to additional
 data at this early period. The current estimate of 0 is significantly greater than 1, the
 epidemic threshold, providing evidence that sustained human-to-human transmission is
 occurring in China. Further, it suggests that a concerted effort will be required to control the

 3
medRxiv preprint doi: https://doi.org/10.1101/2020.01.23.20018549. The copyright holder for this preprint (which was not peer-reviewed)
 is the author/funder, who has granted medRxiv a license to display the preprint in perpetuity.
 It is made available under a CC-BY-NC-ND 4.0 International license .

 outbreak, requiring between 38% and 80% of transmission to be averted to control the
 epidemic.

 We estimated that the average ascertainment rate in Wuhan between 1 and 22 January was
 5.0% (95%CI, 3.6–7.4), reflecting the difficulty in identifying cases of a novel pathogen.
 Given the generally good accessibility to healthcare in China, this suggests that the majority
 of infections may be of mild illness and insufficiently serious for individuals to seek treatment.
 However, it is worth noting that a number of identified cases have died (Centre for Disease
 Control and Prevention 2020) and that the true case fatality rate has yet to be estimated
 accurately. Also, asymptomatic infection has been reported for 2019-nCoV (Chan et al.,
 2020). We also estimated the size of the epidemic in Wuhan at the time of the market
 closure (1 January) to be 15 individuals (95%CI, 5–37). Our estimates of epidemiological
 parameters are sensitive to our assumption regarding the length of the latent period; see
 Figure 2. Early epidemiological investigations suggest a duration between 3 to 6 days (Chan
 et al., 2020), Should the latent period be longer than the 4 days we assume, our 0
 estimates would be higher and the estimated ascertainment rate slightly lower; see Figure 2.
 If cases are being reported with increasing efficiency and the timing of cases is inconsistent
 with the timing assumed here (i.e. throughout the outbreak, the length of time between
 infection and reporting in surveillance data is declining), this may tend to decrease our
 estimate of the reproductive number.

 Epidemic size estimates

 Using our parameterised transmission model, we simulated the impact of an ongoing
 outbreak in Wuhan to seed infections and outbreaks in other cities of China, and to generate
 infection in travellers to other countries/regions, through airline travel originating in China.
 We stress that these projections make strong assumptions: that no control interventions are
 instigated; that the key epidemiological variables driving epidemic dynamics remain
 constant; that travel behaviour within China and to other countries/regions continues as per
 our mobility estimates; finally, we only consider travel by air and do not include land
 transportation, particularly via the rail network within China.

 We estimate that on 22 January, in Wuhan there were currently 14464 infected individuals
 (prediction interval, 6510–25095), and a total 21022 infections (prediction interval, 11090–
 33490) since the start of the year. We also estimate t 24 currently infected individuals
 (prediction interval, 19–30) in other locations of China on this date. For comparative
 purposes, we estimate the total number of infections in Wuhan from 1January to 18 January
 inclusive to have been 6733 (prediction interval, 3500–10914). This estimate of the total
 infections is comparable to other published estimates based on travel data and reported
 cases identified outside of China (estimated between 1,700 and 7,800)(Imai et al., 2020a),
 and highlights our estimated low ascertainment rate, the rapid growth of the epidemic, and
 uncertainty in model predictions.

 Should the transmission continue at the same rate in Wuhan, with no control or change in
 the behaviour of individuals (such as spontaneous social distancing) our model predicts that
 on 29 January the epidemic in Wuhan will be substantially larger, with 594 cases expected
 to be detected on that day in Wuhan (prediction interval, 446–788) and 105077 currently
 infected (prediction interval, 46635–185412); see Figure 3 and Table 1. If transmission has

 4
medRxiv preprint doi: https://doi.org/10.1101/2020.01.23.20018549. The copyright holder for this preprint (which was not peer-reviewed)
 is the author/funder, who has granted medRxiv a license to display the preprint in perpetuity.
 It is made available under a CC-BY-NC-ND 4.0 International license .

 reduced, either through control or spontaneous public response to the epidemic, this will be
 a gross overestimate, though it may be useful to help gauge the effectiveness of
 interventions.

 We also estimated epidemic projections for other Chinese cities and countries/regions. The
 epidemic sizes projections are subject to model and parameter uncertainty, though the
 relative magnitude of predictions in other cities and countries/regions may be informative for
 planning and preparedness purposes.The model predicts infected travellers to other Chinese
 cities will initiate outbreaks in those cities, the largest on 29 January being in Shanghai,
 Beijing, Guangzhou, Shenzhen, Chengdu and Kunming; see Figure 3 and Table 1. Our
 model predicts the total number of infected individuals in locations elsewhere in China to be
 237 (prediction interval, 167–324) on 29 January. Finally, the model predicts an elevated risk
 of importations into other countries/regions, most notably to Thailand, Japan, South Korea,
 Taiwan, Hong Kong SAR, USA, Singapore, Malaysia, Australia and Viet Nam; see Figure 3
 and Table 1. Again, these predictions assume no change in the transmission of the virus
 within China through control or other responses to the epidemic, and likely underestimate
 the potential importation rate to regions with ground transportation from China, in particular
 Hong Kong.

 Comparison of estimates to other reports

 Our estimates of 0 are broadly consistent with early estimates from other groups: 2.0–3.3
 (Majumder and Mandl, 2020); 2.6 (uncertainty range 1.5-3.5)(Imai et al., 2020b); 2.92 (95%
 CI 2.28, 3.67)(Liu et al., 2020); 2.2 (90% interval: 1.4-3.8) (Riou and Althaus, 2020). Sources
 of discrepancies may be due to model differences and differences in the contribution of
 specific types of data to our estimates. We believe that our estimates are slightly elevated
 compared to others due to the inclusion of cases from other locations within China other
 than Wuhan. However, it is important to note that our point estimate is consistent with all
 others uncertainty intervals, all indicating sustained growth of cases.

 Comparison of transmissibility with SARS and MERS

 Our estimates of the basic reproductive number for this novel coronavirus are comparable to
 most estimates reported for SARS and MERS-CoV, but similar to some estimates from
 subsets of data in the early period of SARS. For the SARS coronavirus, estimates of the
 mean reproductive number ranged from 1.1 to 4.2 with most estimates between 2 and 3
 (Bauch et al., 2005). These estimates represent a range of methods and settings. Some
 estimates come from data that mixes time periods before and after control. Estimates of 0
 also varied based on assumed serial intervals (e.g. (Lipsitch et al., 2003) estimated 0
 ranging from 2.2 to 3.6 for serial intervals of 8 to 12 days (9). Another study (Bauch et al.,
 2005) reviewed sources of variation in basic reproductive numbers of SARS and noted that
 those locations in which outbreaks occurred, 0 was approximately 3. Estimates from
 MERS-CoV were uniformly lower, with estimates from Saudi Arabia having a mean of less
 than 1 (~0.5) but exhibited large temporal variability with increases in some periods of time
 particularly in healthcare settings (Cauchemez et al., 2016).

 A comparison of the efficiency of transmission in this outbreak and in SARS outbreaks can
 be seen as well in simple comparisons of doubling times in each outbreak. In SARS,

 5
medRxiv preprint doi: https://doi.org/10.1101/2020.01.23.20018549. The copyright holder for this preprint (which was not peer-reviewed)
 is the author/funder, who has granted medRxiv a license to display the preprint in perpetuity.
 It is made available under a CC-BY-NC-ND 4.0 International license .

 doubling times varied from 4.6 days to 14.2 days depending on setting (doubling time,
 Td=6.0 (1358 over 63 days, Singapore), Td=4.6 (425 over 41 days, Hong Kong), Td=14.2
 (7919 over 185 days, overall)) (Lipsitch et al., 2003). Using confirmed case information (41
 reported January 14; 291 reported 24:00 on January 20; 1975 reported 24:00 on January
 25)(NHCPRC daily reports, 2020) we find doubling times of 2.1, 1.8, and 2.0 days. If the
 outbreak has been ongoing for a longer period of time, this would increase the estimated
 doubling time. These doubling time estimates, similar to our estimates of 0 , are susceptible
 to bias due to the dynamics of case reporting, with bunching of identified cases (due to
 temporally clustered recognition of cases) tending to bias our estimate towards lower
 doubling times. We note our estimates of the doubling time in this outbreak are short
 compared to estimates from the SARS outbreak in Hong Kong (Lipsitch et al., 2003).

 Limitations

 Our model necessarily makes a number of assumptions. Our estimates of the basic
 reproductive number of this novel coronavirus are tied to the specific time period and data
 analysed here, and this measure may change substantially over the course of this outbreak
 and as additional data arrives. Additionally, the spatial component of our model is dependent
 upon only airline travel; the model does not include rail and road transportation, so we may
 underestimate local connectivity and the connectivity of Wuhan to other locations. We also
 do not attempt to account for any implementation of control, nor and dynamic changes of
 factors than may influence transmission (such as spontaneous social distancing), nor
 changes in surveillance and reporting effort. Our choice of modelling approach may also
 lead to unreliability in the precision of our estimated model parameters (King et al. 2015),
 However, our approach used ‘raw’ counts of cases to fit the model, not cumulative case
 information, and the point estimates would not be biased (King et al. 2015).

 Earlier novel coronavirus (SARS and MERS-CoV) outbreaks found evidence for substantial
 heterogeneity in reproductive numbers between individuals (Chowell et al., 2004; Bauch et
 al., 2005; Cauchemez et al., 2016). In our analysis, we assume that there is little
 heterogeneity in reproductive numbers and this assumption may change our estimated
 reproductive number. Additionally, 0 estimates tend to be reduced as case information
 accumulates, though control measures may also be introduced during these periods. As is
 true for any modelling analysis of surveillance data, our estimate of 0 may also reflect the
 dynamics of surveillance effort and reporting rather than just the dynamics of the epidemic.

 A key uncertainty of this outbreak is when it started. We have chosen to model transmission
 from 1 January onwards. Surveillance in China and elsewhere only started once the
 outbreak was identified in Wuhan. Had the outbreak started much earlier, and both within-
 China and international infectious exports occurred before January and in early January
 (while surveillance was ramping up), our estimates of the reproductive number would mostly
 decrease.

 A threat to the accuracy of these projections is if a substantial proportion of infection has
 been due to multiple exposures to animals that has been curtailed in some way. These data
 may also represent a period of high transmission (due to favourable seasonal conditions,
 stochastic variation or selection bias in detecting large clusters of transmission) that will not
 be sustained over long periods of time.

 6
medRxiv preprint doi: https://doi.org/10.1101/2020.01.23.20018549. The copyright holder for this preprint (which was not peer-reviewed)
 is the author/funder, who has granted medRxiv a license to display the preprint in perpetuity.
 It is made available under a CC-BY-NC-ND 4.0 International license .

 Summary

 We are still in the early days of this outbreak and there is much uncertainty in both the scale
 of the outbreak, as well as key epidemiological information regarding transmission. However,
 the rapidity of the growth of cases since the recognition of the outbreak is much greater than
 that observed in outbreaks of either SARS or MERS-CoV. This is consistent with our broadly
 higher estimates of the reproductive number for this outbreak compared to these other
 emergent coronaviruses, suggesting that containment or control of this pathogen may be
 substantially more difficult.

 References

 Bauch, C. T. et al. (2005) ‘Dynamically modeling SARS and other newly emerging
 respiratory illnesses: past, present, and future’, Epidemiology , 16(6), pp. 791–801.

 BBC News (2020) Death toll rises as coronavirus spreads, BBC News. BBC News. Available
 at: https://www.bbc.com/news/world-asia-china-51245680 (Accessed: 26 January 2020).

 Bogoch, I. I. et al. (2020) ‘Pneumonia of Unknown Etiology in Wuhan, China: Potential for
 International Spread Via Commercial Air Travel’, Journal of travel medicine. doi:
 10.1093/jtm/taaa008.

 Cauchemez, S. et al. (2016) ‘Unraveling the drivers of MERS-CoV transmission’,
 Proceedings of the National Academy of Sciences of the United States of America, 113(32),
 pp. 9081–9086.

 CGTN (2020) Things you need to know about the world’s largest human migration. Available
 at: https://news.cgtn.com/news/2020-01-19/What-is-the-world-s-largest-human-migration--
 Nmsd7OcJ8Y/index.html (Accessed: 26 January 2020).

 Chan, J. F.-W. et al. (2020) ‘A familial cluster of pneumonia associated with the 2019 novel
 coronavirus indicating person-to-person transmission: a study of a family cluster’, The
 Lancet. doi: 10.1016/s0140-6736(20)30154-9.

 Chowell, G. et al. (2004) ‘Model parameters and outbreak control for SARS’, Emerging
 infectious diseases, 10(7), pp. 1258–1263.

 European Centre for Disease Prevention and Control (2020) Geographical distribution of
 2019-nCov cases, European Centre for Disease Prevention and Control. Available at:
 https://www.ecdc.europa.eu/en/geographical-distribution-2019-ncov-cases (Accessed: 26
 January 2020).

 Huang, C. et al. (2020) ‘Clinical features of patients infected with 2019 novel coronavirus in
 Wuhan, China’, The Lancet. doi: 10.1016/s0140-6736(20)30183-5.

 Imai, N. et al. (2020a) Estimating the potential total number of novel Coronavirus cases in
 Wuhan City, China. 2. Imperial College. Available at:
 https://www.imperial.ac.uk/media/imperial-college/medicine/sph/ide/gida-fellowships/2019-
 nCoV-outbreak-report-22-01-2020.pdf (Accessed: 27 January 2020).

 Imai, N. et al. (2020b) Transmissibility of 2019-nCoV. 3. Imperial College. Available at:
 https://www.imperial.ac.uk/media/imperial-college/medicine/sph/ide/gida-
 fellowships/Imperial-2019-nCoV-transmissibility.pdf (Accessed: 27 January 2020).

 7
medRxiv preprint doi: https://doi.org/10.1101/2020.01.23.20018549. The copyright holder for this preprint (which was not peer-reviewed)
 is the author/funder, who has granted medRxiv a license to display the preprint in perpetuity.
 It is made available under a CC-BY-NC-ND 4.0 International license .

 Lessler, J. et al. (2009) ‘Incubation periods of acute respiratory viral infections: a systematic
 review’, The Lancet infectious diseases, 9(5), pp. 291–300.

 Lipsitch, M. et al. (2003) ‘Transmission dynamics and control of severe acute respiratory
 syndrome’, Science, 300(5627), pp. 1966–1970.

 Liu, T. et al. (2020) ‘Transmission dynamics of 2019 novel coronavirus (2019-nCoV)’,
 bioRxiv. doi: 10.1101/2020.01.25.919787.

 Majumder, M. and Mandl, K. D. (2020) ‘Early Transmissibility Assessment of a Novel
 Coronavirus in Wuhan, China’. Available at: https://papers.ssrn.com/abstract=3524675
 (Accessed: 27 January 2020).

 Munroe, T. (2020) Xi says China faces ‘grave situation’ as virus death toll hits 42, IN.
 Reuters. Available at: https://in.reuters.com/article/us-china-health-idINKBN1ZO005
 (Accessed: 26 January 2020).

 New York Times (2020) Toll From Outbreak Climbs in China as Infections Reach Europe
 and Australia. Available at: https://www.nytimes.com/2020/01/24/world/asia/china-
 coronavirus.html (Accessed: 26 January 2020).

 NHCPRC daily reports (2020) National Health Commission of the People’s Republic of
 China. Available at: http://www.nhc.gov.cn/xcs/yqtb/list_gzbd.shtml (Accessed: 27 January
 2020).

 OAG (2020) Traffic Analyser FAQ. Available at: https://www.oag.com/traffic-analyser-faq
 (Accessed: 26 January 2020).

 Riou, J. and Althaus, C. L. (2020) Pattern of early human-to-human transmission of Wuhan
 2019-nCoV, bioRxiv 2020.01.23.917351. Available at:
 https://www.biorxiv.org/content/10.1101/2020.01.23.917351v1.full.pdf (Accessed: 27
 January 2020).

 Tan, W. et al. (2020) ‘A Novel Coronavirus Genome Identified in a Cluster of Pneumonia
 Cases — Wuhan, China 2019−2020’, China CDC Weekly. China CDC Weekly, 2(4), pp. 61–
 62.

 World Health Organization (2003) Consensus document on the epidemiology of severe
 acute respiratory syndrome (SARS). Available at:
 https://www.who.int/csr/sars/en/WHOconsensus.pdf (Accessed: 26 January 2020).

 World Health Organization (2020) ‘WHO | Novel Coronavirus – China’. World Health
 Organization. Available at: http://www.who.int/csr/don/12-january-2020-novel-coronavirus-
 china/en/ (Accessed: 26 January 2020).

 World Health Organization Western Pacific on Twitter (2020) Twitter. Available at:
 https://twitter.com/WHOWPRO/status/1219478547644813312 (Accessed: 26 January 2020).

 8
Figures

Figure 1. Connectivity of Wuhan to other cities and provinces in mainland China, based on total commercial airline traffic from Wuhan in
January 2017. Traffic is based on the number of departing bookings.

 1
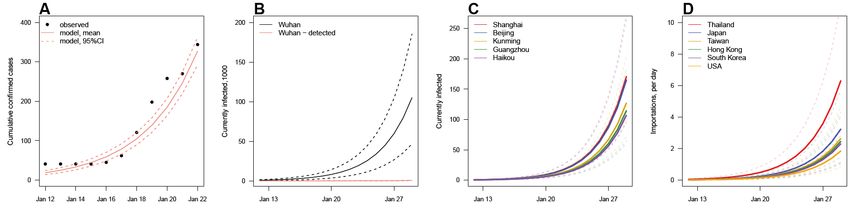
Figure 2. Sensitivity of parameter estimates to assumed latent period (1/ ) value. Boxes represent the 2.5% and 97.5% quantiles and black
dots the 50% quantile.

Figure 3. (A) Comparison of observed cases and predicted detected cases in Wuhan for the period 12 to 22 January. Epidemic predictions for
(B) Wuhan, (C) selected Chinese cities and (D) selected countries/regions, up to 29 January. Estimated detected cases are also plotted for
Wuhan. 95% confidence intervals around mean epidemic trajectory shown as dotted lines.

 2
Tables

Table 1. Predicted epidemic sizes (number of detected cases) in selected Chinese cities and predicted imports to other countries/regions on 29
January 2020, assuming no change in transmissibility or ascertainment rate. Assumption 1: ascertainment rate in all cities excluding Wuhan is
100%. Assumption 2: ascertainment rate in all Chinese cities is 5.0%.

 3
You can also read