MODELLING THE NUCLEAR ENVELOPE OF HELA CELLS - BIORXIV
←
→
Page content transcription
If your browser does not render page correctly, please read the page content below
bioRxiv preprint first posted online Jun. 12, 2018; doi: http://dx.doi.org/10.1101/344986. The copyright holder for this preprint
 (which was not peer-reviewed) is the author/funder, who has granted bioRxiv a license to display the preprint in perpetuity.
                              It is made available under a CC-BY-NC-ND 4.0 International license.

                              Modelling the nuclear envelope of HeLa cells

                      Cefa Karabağ1,3 , Martin L. Jones2 , Christopher J. Peddie2 , Anne E. Weston2 ,
                            Lucy M. Collinson2 , and Constantino Carlos Reyes-Aldasoro1,3
                                  1
                                    City, University of London, Northampton Square EC1V 0HB, UK,
                          2
                              Electron Microscopy Science Technology Platform, The Francis Crick Institute,
                                                         London NW1 1AT, UK
                               3
                                 Corresponding authors cefa.karabag.1@city.ac.uk reyes@city.ac.uk

                                Abstract. This paper describes a framework for the automatic segmen-
                                tation of the nuclear envelope of cancerous HeLa cells and the modelling
                                of the volumetric shape against an ellipsoid. The framework is auto-
                                matic and unsupervised and reported a Jaccard Similarity Index of 0.968
                                against a manual segmentation. The modelling of the surface provides a
                                visual display of the variations, both smooth and rugged over the surface,
                                and measurements can be extracted with the expectation that they can
                                correlate with the biological characteristics of the cells.

                                Keywords: Automatic Nuclear Segmentation, HeLa Nuclear Shape

                      1       Introduction
                      The field of Computational Pathology has grown in recent years bringing to-
                      gether computational and mathematical methods that are applied to disease-
                      related data sets [1]. Computational pathology can combine various sources of
                      data such as medical records, laboratory data, genomics, proteomics, and a va-
                      riety of images with different stainings, antibodies and biomarkers [2, 3]. Some
                      of its aims are to quantify pathological data with various techniques such as
                      machine learning [4] to enable the best possible medical decisions [5]. The au-
                      tomation of the acquisition, especially through the use of whole slide imaging
                      [6] and high-throughput microscopic equipment, has been instrumental in the
                      development field. Labs can now acquire tens of thousands of data sets that
                      can easily exceed gigabytes of data every month [7]. Previous work has applied
                      computer-based image analysis for cell detection and classification [8], tissue
                      classification [9], nuclei and mitosis detection [10], microvessel segmentation [11]
                      and other immunohistochemistry scoring tasks [12] in histopathological images.
                          Generally, although not exclusively, the images associated with computa-
                      tional pathology are light or fluorescence microscopy and stained through im-
                      munohistochemistry. Less frequently considered are images observed with elec-
                      tron microscopy (EM), phase contrast and differential interference contrast (DIC)
                      [13]. One important difference between these last modalities and light and flu-
                      orescence, is the fact that the intensity of each pixel or voxel is not exclusively
                      related to the presence or absence of a marker or stain, and thus the elements
                      of interest have intensities above and below that of the background. Another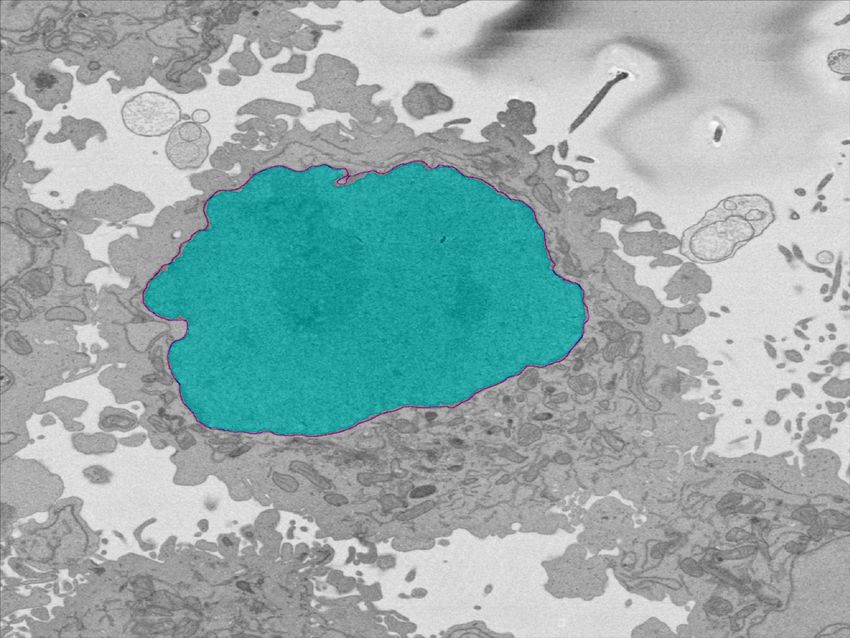
bioRxiv preprint first posted online Jun. 12, 2018; doi: http://dx.doi.org/10.1101/344986. The copyright holder for this preprint
 (which was not peer-reviewed) is the author/funder, who has granted bioRxiv a license to display the preprint in perpetuity.
                              It is made available under a CC-BY-NC-ND 4.0 International license.

                      2

                      important difference is that EM can provide 3D data sets in a similar way to
                      multiphoton and confocal microscopes, albeit through a destructive process [14,
                      15]. In addition, in the case of EM, the much higher resolution and magnifica-
                      tion changes considerably the problems to solve beyond separating and counting
                      cells and nuclei, or finding their spatial distribution. As there may be a single
                      cell of interest, understanding the nuclear formation [16], the arrangement of
                      chromosomes [17] or the breaching of the nuclear envelope [18] become relevant.
                      The integrity of the nuclear envelope (NE), which separates nucleoplasm and
                      cytoplasm, is of great interest as for some time it has been assumed that the NE
                      brakes down only during mitosis, however, in cases of virus infection or cancer,
                      the NE may remodel outside mitosis [18].
                          A problem common to all imaging modalities is the determination of a ground
                      truth (GT) against which to validate segmentation results. Despite the signifi-
                      cant disadvantages of time and inter- and intra-user variability, manual or semi-
                      automatic delineation of structures like the NE is widely used [19, 20]. Recently,
                      a new approach known as citizen-science (CS) [21], has been used to find a GT
                      by leveraging the power of the internet and an army of non-experts. The expec-
                      tation is that out of large enough number of delineations, a useful segmentation
                      with comparable accuracy of that provided by experts can be extracted.
                          In this paper, a framework to analyse the NE of HeLa cells is presented. The
                      framework extends an automatic segmentation of the NE [22] and models the
                      NE as a 2D surface against a 3D ellipsoid. Distances from the NE to the ellipsoid
                      and the local variation of the distances are calculated with the expectation that
                      they can allow the identification of different biological processes.

                      2     Materials and Methods
                      2.1    Materials: HeLa cells preparation and acquisition
                      The preparation details of the cell have been published previously, but briefly,
                      wild type HeLa cells were embedded in resin (Durcupan) as per the guidelines
                      of the National Centre for Microscopy and Imaging Research (NCMIR) [23].
                          Images were acquired using a serial blockface scanning electron microscopy
                      (SBF SEM) using a 3View2XP (Gatan, Pleasanton, CA) attached to a Sigma
                      VP SEM (Zeiss, Cambridge). The resolution of the images was 8192×8192 pixels
                      over a total of 518 slices, with 10 × 10 × 50 nm voxel size with 0-255 intensity
                      levels. Individual cells were manually cropped as volumes of interest as substacks
                      of 2000 × 2000 × 300 voxels (Figs. 1a,d) and were saved as single channel tif files.

                      2.2    Ground Truth
                      Manual delineation of every slice of the data set was performed by an expert
                      who had no further input in the processing of the data. As the HeLa cells can
                      have complicated 3D shapes, in some cases it was necessary for the expert to
                      scroll up and down the slices to determine if a certain region, which appeared
                      disjoint in a certain slice, was part of the nucleus (Figs. 1b,e).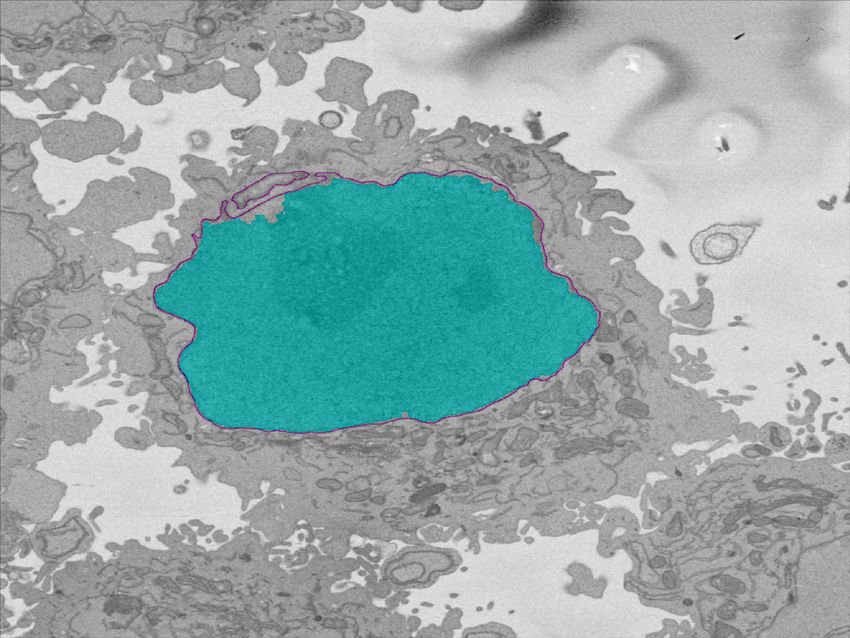
bioRxiv preprint first posted online Jun. 12, 2018; doi: http://dx.doi.org/10.1101/344986. The copyright holder for this preprint
 (which was not peer-reviewed) is the author/funder, who has granted bioRxiv a license to display the preprint in perpetuity.
                              It is made available under a CC-BY-NC-ND 4.0 International license.

                                                                                                                          3

                                     (a)                               (b)                               (c)

                                     (d)                               (e)                               (f)

                      Fig. 1: (a) One representative EM image containing one HeLa cell at the centre
                      and fragments of other cells surrounding it. (b,c) Two regions of interest (ROI)
                      which illustrate the difficulty of identifying the nuclear envelope. (d) Manual de-
                      lineation of the nuclear envelope performed by a single expert. (e,f) Delineations
                      of the ROIs from (b,c). Notice in (b,e) the disjoint region that the expert con-
                      sidered to belong to the nucleus and in (c,f) the uncertainty in some regions of
                      the boundary.

                      2.3    Automatic segmentation of the nuclear envelope

                      The NE was segmented following the framework described in [22], which is avail-
                      able open-source as Matlab code (https://github.com/reyesaldasoro/HeLa-Cell-
                      Segmentation). The framework exploited the darker intensity of the NE as com-
                      pared with the cytoplasm and the nucleoplasm by Canny edge detection. The
                      edges were then dilated to connect disjoint edges, which were part of the NE,
                      due to intensity variations of the envelope itself (Fig. 2a). The connected pixels
                      not covered by the dilated edges were labelled to create a series of superpixels
                      (Fig. 2b). The superpixel size was not restricted as large superpixels covered the
                      areas of background. Morphological operators were used to: remove regions in
                      contact with the edges of the image, remove small regions and fill holes inside
                      larger regions (Fig. 2c). The central superpixel was selected as the nucleus and
                      further morphological operators were applied to close the jagged edge. Sensitiv-
                      ity analyses to determine the optimal parameters were performed (results not
                      shown).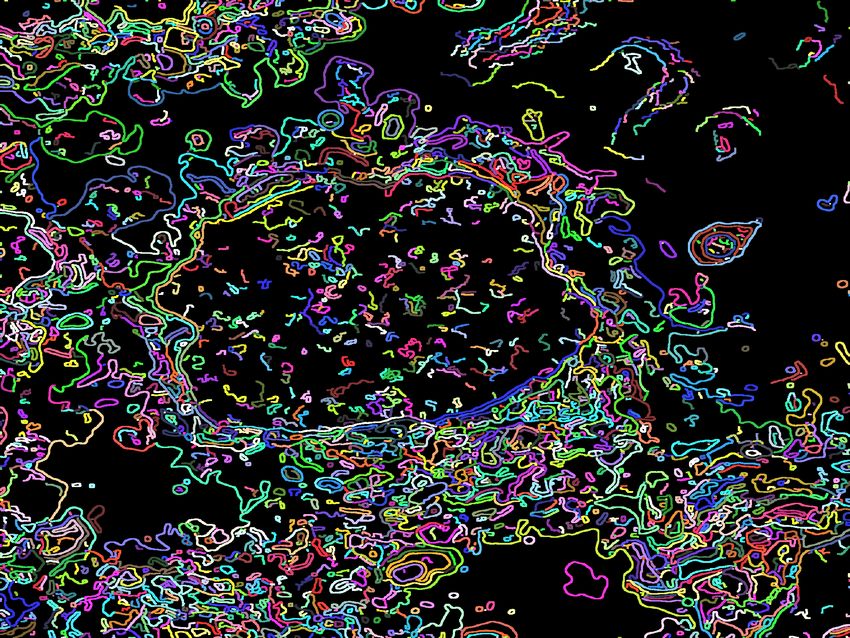
bioRxiv preprint first posted online Jun. 12, 2018; doi: http://dx.doi.org/10.1101/344986. The copyright holder for this preprint
(which was not peer-reviewed) is the author/funder, who has granted bioRxiv a license to display the preprint in perpetuity.
It is made available under a CC-BY-NC-ND 4.0 International license.
4
(a) (b) (c)
(d)
(e) (f)
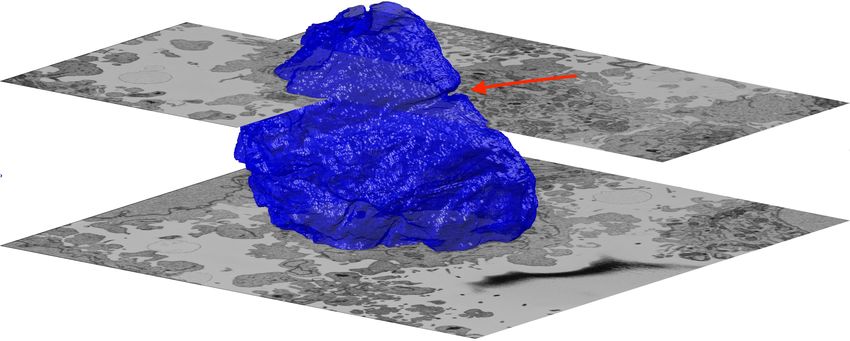
Fig. 2: Illustration of the pipeline to segment the nuclear envelope of the HeLa
Cell. (a) Edges detected by Canny algorithm. (b) Labelled superpixels. (c) Mor-
phological processing and selection of large superpixels. The edges and the la-
belled areas have been assigned random colours for visualisation purposes. (d,e)
Segmentation of two slices (cyan shades) and the manual segmentation (ma-
genta line). (f) Surface of the NE and partial EM slices to give context. Notice
the notch (arrow) on the upper right side of the NE.
2.4 Validation of the segmentation
In order to compare the results of the automated segmentation with the manually
segmented GT, the Jaccard Similarity Index (JI) [24] of intersection over union of
areas was calculated. For each slice, the manual delineation was morphologically
closed to generate a region rather than a line.
2.5 Nuclear envelope shape modelling
To further study the shape of the segmented NE, this was modelled against a
3D ellipsoid. The ellipsoid was adjusted to have the same volume as the nucleus.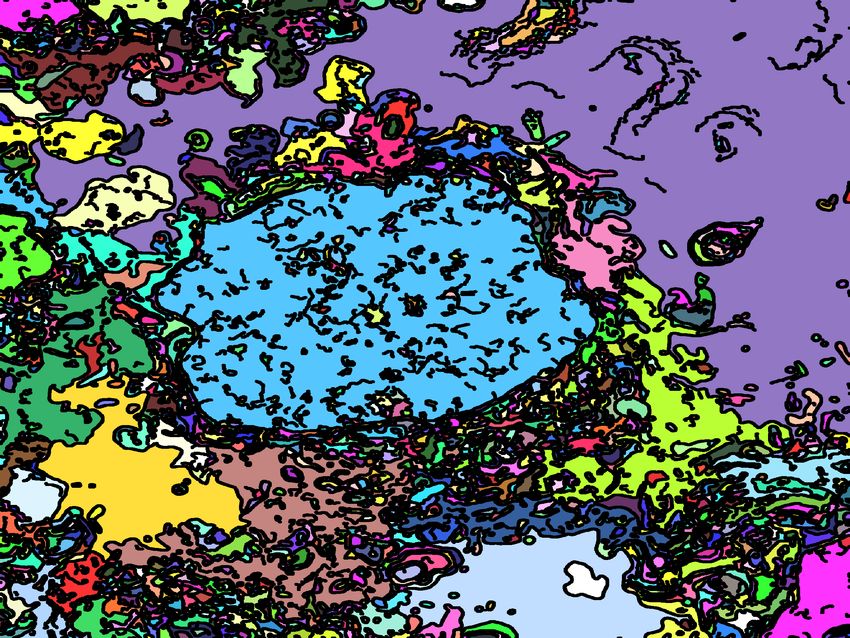
bioRxiv preprint first posted online Jun. 12, 2018; doi: http://dx.doi.org/10.1101/344986. The copyright holder for this preprint
 (which was not peer-reviewed) is the author/funder, who has granted bioRxiv a license to display the preprint in perpetuity.
                              It is made available under a CC-BY-NC-ND 4.0 International license.

                                                                                                                          5

                                 (a)                      (b)                       (c)                       (d)

                      Fig. 3: Assessment of the automatic segmentation and the ground truths of two
                      ROIs. In all cases the magenta line corresponds to the manual delineation and
                      the shaded region in blue corresponds to: (a,c) Automatic segmentation, (b,d)
                      Manual GT. Notice how the GT has been incorrectly estimated in the cases
                      where an invagination of the boundary creates a closed loop.

                      The surfaces of the ellipsoid and the nucleus were subsequently compared by
                      tracing rays from the centre of the ellipsoid and the distance between the sur-
                      faces for each ray was calculated. It was assumed that when the nucleus surface
                      was further away from the centre, the difference was positive. Processing and
                      visualisation were performed in MATLAB R (The MathworksTM , Natick, USA).

                      3     Results
                      The automatic algorithm produced a rather accurate segmentation of the NE.
                      The JI of the automatic results against the manual GT was 0.968. This value
                      indicate a rather high overlap considering that the shape of the nucleus is very
                      irregular on the upper and lower slices. Furthermore, the shape of the manual
                      delineations can give rise to ambiguities in the assessment of the segmentation
                      correctness. In particular, the delineation connected in different points when in-
                      vaginations of the NE were present, and thus the GT, which was morphologically
                      closed, was itself incorrectly estimated (Fig 3).
                          The comparison between the model ellipsoid and the NE reported a JI of
                      0.7184 (Fig. 4a). This value could be used to assess the roundness or not of a
                      nucleus, and it is speculated that the JI could be related with biological charac-
                      teristics of cells. This will be validated in the future against a large number of
                      cells. In addition, the measurements of distance from the nucleus to the ellipsoid
                      showed rougher and smoother regions (Figs. 4b,c, 5).
                          The surface corresponding to the distance from the nuclear envelope to a
                      model ellipsoid (Fig. 5) showed graphically the hollow and prominent regions
                      of the cell, but more important, elements such as a notch (solid red arrow) or
                      ruggedness (dashed green arrow) can be an indication of NE brake down or
                      remodelling. The local variation of the surface (Fig. 6) enhanced these elements
                      as the trends were removed. Notice again the notch and the high frequency
                      variation of the rugged region.
bioRxiv preprint first posted online Jun. 12, 2018; doi: http://dx.doi.org/10.1101/344986. The copyright holder for this preprint
(which was not peer-reviewed) is the author/funder, who has granted bioRxiv a license to display the preprint in perpetuity.
It is made available under a CC-BY-NC-ND 4.0 International license.
6
(a) (b) (c)
Fig. 4: (a) Rendering of the nuclear envelope (red surface) against the model
ellipsoid (blue mesh). (b) Illustration of distance calculations by ray tracing in
one slice. Yellow regions correspond to the nucleus outside the ellipsoid, cyan
regions where nucleus inside the ellipsoid. (c) Measurements obtained along the
boundary.
Fig. 5: Surface corresponding to the distance from the nuclear envelope to a
model ellipsoid. Solid red arrow indicates a notch, dashed green arrow shows
rugged region.
4 Discussion
The modelling of the NE surface against an ellipsoid can reveal interesting char-
acteristics of the nucleus and the nuclear envelope of a HeLa cancer cell. The 2D
maps of the NE surface provides an easier way to assess the characteristics of a
3D structure. Whilst further experimentation with more data sets, and a careful
processing of the GTs, is necessary, the framework here described can be useful,
as it is fully automated, unsupervised, segmented each slice in approximately 8
seconds and does not require training data.
Future work will concentrate in the segmentation and modelling of a large
number of cells, not all of which have a GT segmented by an expert and will be
compared against results gathered from the CS approach. For this purpose, a
CS project called Etch a Cell [25] was created to gather manual segmentations
of the NE of HeLa cells.bioRxiv preprint first posted online Jun. 12, 2018; doi: http://dx.doi.org/10.1101/344986. The copyright holder for this preprint
(which was not peer-reviewed) is the author/funder, who has granted bioRxiv a license to display the preprint in perpetuity.
It is made available under a CC-BY-NC-ND 4.0 International license.
7
Fig. 6: Surface of the local variation of the distances. In both cases, hot shades
correspond to positive values and cool shades to negatives. Solid red arrow in-
dicates a notch, dashed green arrow shows rugged region.
5 Acknowledgements
This work was supported by the Francis Crick Institute which receives its core
funding from Cancer Research UK (FC001999), the UK Medical Research Coun-
cil (FC001999), and the Wellcome Trust (FC001999). The authors acknowledge
the Alan Turing Institute Data Study Groups and Dr Sebastian Vollmer.
References
1. Roth, K.A., Almeida, J.S.: Coming into focus: computational pathology as the new
big data microscope. American Journal of Pathology 185(3), 600–601 (Mar 2015)
2. Fuchs, T.J., Buhmann, J.M.: Computational pathology: challenges and promises
for tissue analysis. Computerized Medical Imaging and Graphics: The Official Jour-
nal of the Computerized Medical Imaging Society 35(7-8), 515–530 (Dec 2011)
3. Huntsman, D.G., Ladanyi, M.: The molecular pathology of cancer: from pan-
genomics to post-genomics. The Journal of Pathology 244(5), 509–511 (Apr 2018)
4. Gurcan, M.N., Boucheron, L.E., Can, A., Madabhushi, A., Rajpoot, N.M., Yener,
B.: Histopathological image analysis: a review. IEEE Reviews in Biomedical Engi-
neering 2, 147–71 (2009)
5. Louis, D.N., Gerber, G.K., Baron, J.M., Bry, L., Dighe, A.S., Getz, G., Higgins,
J.M., Kuo, F.C., Lane, W.J., Michaelson, J.S., et al.: Computational pathology: An
emerging definition. Archives of Pathology & Laboratory Medicine 138(9), 1133–
1138 (Aug 2014)
6. Park, S., Pantanowitz, L., Parwani, A.V.: Digital imaging in pathology. Clinics in
Laboratory Medicine 32(4), 557–584 (Dec 2012)
7. Campanella, G., Rajanna, A.R., Corsale, L., Schffler, P.J., Yagi, Y., Fuchs, T.J.:
Towards machine learned quality control: A benchmark for sharpness quantification
in digital pathology. Comp. Medical Imaging and Graphics 65, 142–151 (Apr 2018)
8. Bankhead, P., Loughrey, M.B., Fernndez, J.A., Dombrowski, Y., McArt, D.G.,
Dunne, P.D., McQuaid, S., Gray, R.T., Murray, L.J., Coleman, H.G., et al.:bioRxiv preprint first posted online Jun. 12, 2018; doi: http://dx.doi.org/10.1101/344986. The copyright holder for this preprint
(which was not peer-reviewed) is the author/funder, who has granted bioRxiv a license to display the preprint in perpetuity.
It is made available under a CC-BY-NC-ND 4.0 International license.
8
Qupath: Open source software for digital pathology image analysis. Scientific Re-
ports 7(1), 16878 (Dec 2017)
9. Kather, J.N., Weis, C.A., Bianconi, F., Melchers, S.M., Schad, L.R., Gaiser, T.,
Marx, A., Zollner, F.G.: Multi-class texture analysis in colorectal cancer histology.
Scientific Reports 6, 27988 (Jun 2016)
10. Veta, M., van Diest, P.J., Kornegoor, R., Huisman, A., Viergever, M.A., Pluim,
J.P.W.: Automatic nuclei segmentation in H&E stained breast cancer histopathol-
ogy images. PLOS ONE 8(7), e70221 (Jul 2013)
11. Kather, J.N., Marx, A., Reyes-Aldasoro, C.C., Schad, L.R., Zollner, F.G., Weis,
C.A.: Continuous representation of tumor microvessel density and detection of
angiogenic hotspots in histological whole-slide images. Oncotarget 6(22), 19163–
19176 (Aug 2015)
12. Akbar, S., Jordan, L.B., Purdie, C.A., Thompson, A.M., McKenna, S.J.: Com-
paring computer-generated and pathologist-generated tumour segmentations for
immunohistochemical scoring of breast tissue microarrays. British Journal of Can-
cer 113(7), 1075–1080 (Sep 2015)
13. Xing, F., Yang, L.: Robust nucleus/cell detection and segmentation in digital
pathology and microscopy images: A comprehensive review. IEEE Reviews in
Biomedical Engineering 9, 234–263 (2016)
14. Peddie, C.J., Collinson, L.M.: Exploring the third dimension: Volume electron
microscopy comes of age. Micron 61, 919 (Jun 2014)
15. Russell, M.R.G., Lerner, T.R., Burden, J.J., Nkwe, D.O., Pelchen-Matthews, A.,
Domart, M.C., Durgan, J., Weston, A., Jones, M.L., Peddie, C.J., et al.: 3D correl-
ative light and electron microscopy of cultured cells using serial blockface scanning
electron microscopy. Journal of Cell Science 130(1), 278–291 (Jan 2017)
16. Lu, L., Ladinsky, M.S., Kirchhausen, T.: Formation of the postmitotic nuclear
envelope from extended ER cisternae precedes nuclear pore assembly. The Journal
of Cell Biology 194(3), 425–440 (2011)
17. Walter, J., Schermelleh, L., Cremer, M., Tashiro, S., Cremer, T.: Chromosome
order in HeLa cells changes during mitosis and early G1, but is stably maintained
during subsequent interphase stages. J Cell Biology 160(5), 685–697 (2003)
18. Hatch, E., Hetzer, M.: Breaching the nuclear envelope in development and disease.
J Cell Biol 205(2), 133–141 (Apr 2014)
19. Coelho, L.P., Shariff, A., Murphy, R.F.: Nuclear Segmentation in Microscope Cell
Images: A Hand-Segmented Dataset and Comparison of Algorithms. IEEE Inter-
national Symposium on Biomedical Imaging 5193098, 518–521 (2009)
20. Belevich, I., Joensuu, M., Kumar, D., Vihinen, H., Jokitalo, E.: Microscopy image
browser: A platform for segmentation and analysis of multidimensional datasets.
PLOS Biology 14(1), e1002340 (Jan 2016)
21. Schnoor, J.L.: Citizen science. Environmental Science & Technology 41(17), 5923–
5923 (Sep 2007)
22. Karabag, C., Jones, M.L., Peddie, C.J., Weston, A.E., Collinson, L.M., Reyes-
Aldasoro, C.C.: Automated segmentation of hela nuclear envelope from electron
microscopy images. In: Medical Image Understanding Analysis. Springer (Jul 2018)
23. Deerinck, T.J., Bushong, E., Thor, A., Ellisman, M.H.: NCMIR - National Center
for Microscopy and Imaging Research. NCMIR methods for 3D EM: A new protocol
for preparation of biological specimens for serial block-face SEM microscopy (2010)
24. Jaccard, P.: Étude comparative de la distribution florale dans une portion des Alpes
et des Jura. Bull. del la Société Vaudoise des Sciences Naturelles 37, 547–579 (1901)
25. Etch A Cell. https://www.zooniverse.org/projects/h-spiers/etch-a-cell,
accessed: 2018-01-17You can also read