A Theoretical Framework for STD Epidemiology: From Transmission Dynamics to Program Design - Kimberley Fox, MD, MPH Director, Global AIDS Program ...
←
→
Page content transcription
If your browser does not render page correctly, please read the page content below
A Theoretical Framework for
      STD Epidemiology:
From Transmission Dynamics to
       Program Design

             Kimberley Fox, MD, MPH
          Director, Global AIDS Program
    Thailand MOPH—U.S. CDC Collaboration
                Bangkok, Thailand
Approaches to prevention of
     infectious diseases
• Biomedical
  – Examples: vaccines, preventive therapy
• Behavioral
  – Examples: handwashing, “self-quarantine”
    (ill persons avoid exposure to well persons)
• Structural
  – Examples: negative pressure air flow in
    rooms for TB patients, beer tax to lower
    STD rates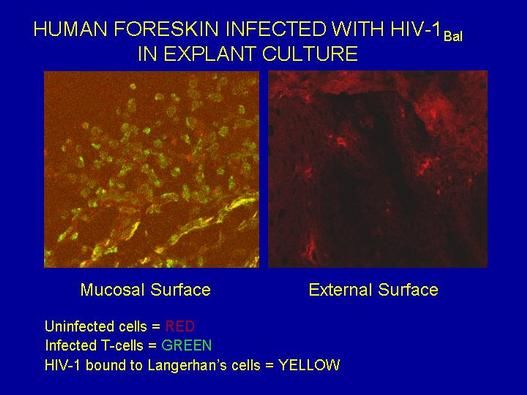
Approaches to STD prevention
        (examples)
• Biomedical
  – Screening and treatment
  – Vaccines
• Behavioral
  – Reduce risky sexual exposures (condoms,
    changes in norms for sexual behaviors,
    etc.)
• Structural
  – Ensuring that stores in high-risk areas sell
    condoms
Gonorrhea — Reported rates: United States, 1970–2000 and the
              Healthy People year 2010 objective

Rate (per 100,000 population)
 500
                                                                          Gonorrhea
                                                                          2010 Objective
 400

 300

 200

 100

    0
        1970      73      76       79      82       85      88       91       94    97     2000

           Note: The Healthy People 2010 (HP2010) objective for gonorrhea is 19.0
           cases per 100,000 population.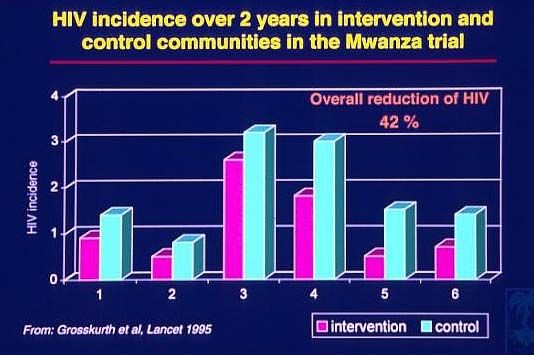
“Sir, the following paradigm shifts
  occurred while you were out.”

First we must consider…
Why do STDs persist in our communities?
            A mathematical model

  Ro = β c D
    • Ro = initial rate of secondary cases arising
      from a case
    • β = efficiency of transmission
    • c = measure of sexual behaviors related to
      partner change
    • D = duration of infectiousness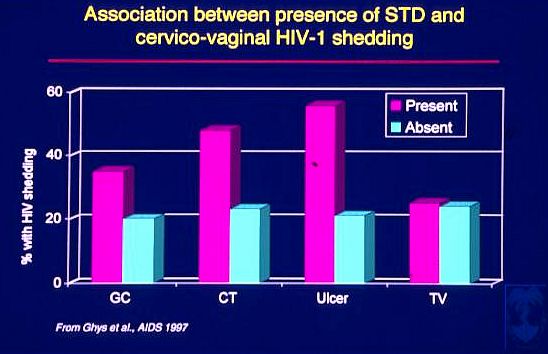
Determinants of Transmission Efficiency
                   (Ro=BcD)

 • Infectivity or organism load of pathogen

 • Co-infections

 • Circumcision, cervical ectopy
   (susceptibility of host)

 • Condoms, microbicides, other barriers
Estimates of Key Epidemiologic Parameters
Necessary to Sustain Transmission of Five Different
STDs (c=1/ßD)
AGENT DURATION OF TRANSMISSION MEAN PARTNER
INFECTIOUSNESS EFFICIENCY (ß) PER CHANGE RATE (c)
(D) IN YEARS PARTNERSHIP PER YEAR
N. gonorrhoeae
No control 0.5
Control 0.5
C. trachomatis 0.2
T. pallidum
No control 0.3
Control 0.3
HIV
African parameters 0.1
American parameters 0.01
Haemophilus ducreyi 0.8
Produced from data collected by Brunham and Plummer, 1990A model of sexual transmission of HIV
5
HIV RNA in Semen
1/500 -
(Log10 copies/ml)
1/3
Risk of Transmission 1/50
4
1/10,000 - 1/1000 -
1/1000 1/100
3
? Transmission
Threshold ?
2
io n at ic io n S
ve rs
tom gr e s s AID
o c on y mp
P ro
Se
r As H IV
Stage of DiseaseHigh viral load in primary infection:
a triple threat?
Early Chronic Late
Infection Infection Infection
Biologic: HIV viral load ++++ + ++++
Behavioral: unprotected sex ++++ +++ +
Social: networks of high-risk
++++ ++ +
persons
According to mathematical models (Fraser 2006), the
proportion of transmission that results from each stage
of the disease is:
• Primary infection: 12%
• Asymptomatic chronic infection: 71%
• AIDS: 17%
Although infectiousness is higher during early and late
infection, the asymptomatic period is much longer.Biologic evidence for STIs as
co-factors for HIV transmission
• Presence of STI
– Increase in HIV infectiousness
• Increase in viral load in genital secretions
– Increase in susceptibility to HIV
• Disruption of epithelial barrier
• Increase in HIV-receptive cells
• Increase in receptors expressed per cellMagnitude of the risk in
epidemiologic studies
• 2- to 10-fold increased risk of HIV infection
in persons with syphilis
• 2- to 8.5-fold increase in persons with
HSV-2
• 2- to 9-fold increase in persons with
gonorrhea, chlamydia, or trichomonasLevine, et al. J Infect Dis, 1998
A model of sexual transmission of HIV

                     5
HIV RNA in Semen

                                                   1/500 -
 (Log10 copies/ml)

                                                   1/3
                                                                  Risk of Transmission                      1/50
                     4
                                                             1/10,000 -                1/1000 -
                                                             1/1000                    1/100
                     3
                             ? Transmission
                               Threshold ?
                     2
                                          io   n                  at ic                          io   n       S
                                    ve rs
                                                               tom                    gr   e s s          AID
                           o c on                       y mp
                                                                                 P ro
                     Se
                          r                          As                   H IV
Stage of DiseaseEffect of other STDs on
sexual transmission of HIV (theoretical)
10 Antibiotic
HIV RNA in Semen
Therapy
(Log10 copies)
8
6 STD
4
2
n t ic io n S
rs io a
e ss I D
o n v e p tom o gr A
ro c y m P r
Se As H IV
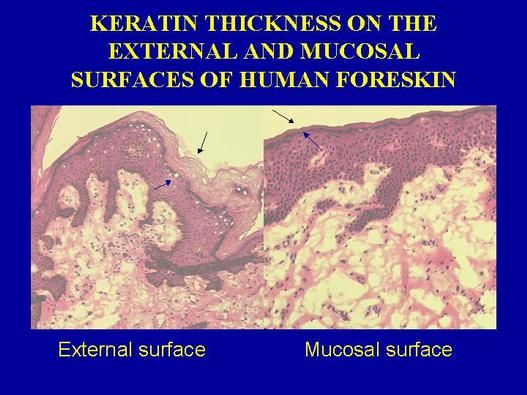
Stage of DiseaseBiological mechanisms for HIV transmission in uncircumcised men • Foreskin susceptible to tears and abrasions • Foreskin provides a mucosal environment conducive to survival of HIV and contains high densities of HIV target cells • Circumcised glans penis protected by keratinized epithelium
Determininants of Sexual Behaviors
                  (Ro=BcD)

 •   Cultural and contextual norms
 •   Substance use (alcohol, illicit drugs)
 •   Economic pressures
 •   Gender-based hierarchical relationships
Lifetime STIs, by Number of Sex Partners
since Age Eighteen (cases per 1,000)
Partners since age 18
0 1 2-4 5-10 11-20 21+
Gonorrhea 0 11 30 83 148 206
Syphillis 0 1 4 13 9 21
Chlamydia 0 14 20 44 64 70Distribution of Number of New Sexual
Partners in Last YearIndividual-Level Factors that May
Contribute to c
• Number of partners
• Rate of acquiring new partners
• Casual partners
• Sexual practices (dry sex, anal sex)Core Groups for Selected STDs
Chlamydia
Gonorrhea
Syphilis
Chancroid“Gonorrhea as a Social Disease”
J. Potterat
• It’s not how many partners, but who
they are that countsThe Network Matters… Source: MC Boily et al, 2000.
The Network Structure

     • Can accelerate risk or protective
       behaviors for some people
     • It can make the same behavior more or
       less risky depending on where an
       individual is located in the network.
     • Provides a roadmap for where infection
       is going to travel

Source: T. Valente, 2002.
Assortativeness Matters, Too Source: MC Boily et al, 2000.
And Then You Do the Calculations…

Source: MC Boily et al, 2000.
What do Asian HIV epidemics look like?

                                                FSW
                              Clients     MSM               IDUs
                         Low or no risk
                            males
                                           Low or no risk
    Multiple interlinked                      females
    epidemics in higher
     risk populations

Source: T. Brown, 2003
Males visiting sex workers in last year
Country Percent clients Year
Thailand 22% → 10% 1990/1993
Cambodia 13% 2000
Japan 11% 1999
Philippines 7% 2000
Hong Kong/ 5% Early 1990s
Singapore
Conclusion: from 7 to 25% at risk of HIV
Source: T. Brown, 2003The number of clients largely explains
differences in speed & severity
Asian Epidemic Model
10
Percent of adults living with HIV
8
6
4
2
0
85
90
95
00
05
10
15
20
25
30
20
20
20
20
19
19
19
20
20
20
5% 10% 20% male clients
Source: T. Brown, 2006Why were Thailand & Cambodia so serious?
Asian Epidemic Model: 20% male clients with 0.8% females FSW
80
By 2030,
60
23% of
males,
Percent HIV+
8.6% of
40 females
HIV+
20
0
85
90
95
00
05
10
15
20
25
30
19
19
19
20
20
20
20
20
20
20
IDU FSW Gen male Gen female MSM
Source: T. Brown, 2006Determinants of Duration of
Infectiousness (Ro=BcD)
• Natural history of infection
• Health care services
– quality
– accessibility
• Referral to services by partner or health care
provider
• Health care seeking behaviorsSTD Clinic Patient Survey, North Carolina:
Duration of Symptoms Before Visit
All
Male
Female
0 1 2 3 4 5 6 7
Median number of daysBarriers to Access:
STD Clinic in North Carolina
25
20
Percent of patients
15
10
5
0
Waiting Transp. Clinic Can't get Not Child
time hours appt. comf. careSTD Clinic Patient Survey, North Carolina
Waiting Time Before Talking to Nurse or
Doctor
45
40
Percent of patients
35
30
25
20
15
10
5
0
0-15 16-30 31-45 46-60 61-90 91-120 121- 181-
180 240
Median waiting time: 20 minutesSTD Clinic Patient Survey, North Carolina:
Duration of Symptoms According to
Mode of Transportation
Car Friend/Bus/Taxi/Walk
• Median 5 days • Median 7 days
• 27.9% waited • 38.5% waited more
more than one than one week
weekPrevalences of Gonorrhea, Chlamydia, Syphilis,
and HIV among NC Migrant Farmworkers
12
10
8
6
4
2
0
Gonorrhea Chlamydia Syphilis Syphilis, ever HIV
(RPR (FTA+)
&FTA+)Prevalences of Gonorrhea and
Chlamydial Infection among Incarcerated
Male Youth in NC
10
8
6
4
2
0
Gonorrhea Chlamydia Syphilis (RPR &
FTA+)Quality of Services • STD treatment with the wrong antibiotic doesn’t reduce D • Getting treatment right involves good history-taking, examination, and testing (when available), and using recommended treatment • Antibiotic resistance may need to be considered
Gonococcal Isolate Surveillance Project (GISP) — Percent of
       Neisseria gonorrhoeae isolates with decreased susceptibility or
                   resistance to ciprofloxacin, 1990–2000

Percent
 2.0
                Decreased susc.
 1.6            Resistance

 1.2

 0.8

 0.4

 0.0
          1990      91        92       93        94      95       96       97        98      99    2000
           Note: Resistant isolates have ciprofloxacin MICs >1 μg/mL. Isolates with decreased
           susceptibility have ciprofloxacin MICs of 0.125 - 0.5 μg/mL. There were sixty-one
           (61) resistant isolates: one in 1991, one in 1993, two in 1994, eight in 1995, two in
           1996, five in 1997, four in 1998, nineteen in 1999, and nineteen in 2000.
           Susceptibility to ciprofloxacin was first measured in GISP in 1990.
Estimates of Key Epidemiologic Parameters
Necessary to Sustain Transmission of Five Different
STDs (c=1/ßD)
AGENT DURATION OF TRANSMISSION MEAN PARTNER
INFECTIOUSNESS EFFICIENCY (ß) PER CHANGE RATE (c)
(D) IN YEARS PARTNERSHIP PER YEAR
N. gonorrhoeae
No control 0.5 0.5
Control 0.15 0.5
C. trachomatis 1.25 0.2
T. pallidum
No control 0.5 0.3
Control 0.25 0.3
HIV
African parameters 2.0 0.1
American parameters 8.0 0.01
Haemophilus ducreyi 0.8 0.8
Source: Brunham and Plummer, 1990Estimates of Key Epidemiologic Parameters
Necessary to Sustain Transmission of Five Different
STDs (c=1/ßD)
AGENT DURATION OF TRANSMISSION MEAN PARTNER
INFECTIOUSNESS EFFICIENCY (ß) PER CHANGE RATE (c)
(D) IN YEARS PARTNERSHIP PER YEAR
N. gonorrhoeae
No control 0.5 0.5 4
Control 0.15 0.5 13
C. trachomatis 1.25 0.2 4
T. pallidum
No control 0.5 0.3 7
Control 0.25 0.3 13
HIV
African parameters 2.0 0.1 5
American parameters 8.0 0.01 13
Haemophilus ducreyi 0.8 0.8 15
Source: Brunham and Plummer, 1990Without Antiretroviral Therapy
HIV incidence
HIV prevalence
HIV-related
deathsWith Antiretroviral Therapy
HIV incidence
HIV prevalence
HIV-related
deathsARV treatment scale-up (NAPHA) will
increase the prevalence of HIV
800,000
700,000
N u m b e r o f in fe c tio n
600,000
500,000
400,000
300,000
200,000
100,000
0
25
20
85
90
95
15
00
05
10
20
19
20
19
19
20
20
20
20
NO NAPHA Baseline (with NAPHA)
Source: T. Brown, 2006So now we’re back to…
Why do STDs persist in our communities?
(What makes Ro >1?)
Ro = β c D
• Ro = initial rate of secondary cases arising
from a case
• β = efficiency of transmission
• c = measure of sexual behaviors related to
partner change
• D = duration of infectiousnessCore Groups for Selected STDs
Chlamydia
Gonorrhea
Syphilis
ChancroidGeographic “Core” Areas
Source: J. Potterat, 1985Spatial Analysis
The Spread of Disease Is Unavoidably Spatial – EE Holmes
• Infection moves from individual to
individual following a network of
contacts within a population
– Local transmission
– Global (long-distance) transmission
• Bridge contactsGeographic Information Systems
• Spatial data are
stored in a map
layer
• Data referenced to
location on the
earth's surface
Source: D. Law, 2001Geographic Distribution of STDs
• Case distribution
– No context
Source: D. Law, 2001Source: D. Law, 2001
Source: D. Law, 2001
Syphilis Distribution

Source: D. Law, 2001
Demographic and Social Factors
Affecting c (behaviors) and D (services)

 • Age structure and sex ratio of
   population
 • Rapid demographic change
   – Population growth
   – Migration
   – Shift from agricultural to wage-based
     economy
 • Poverty
 • Unstable power hierarchies
OUTBREAK INVESTIGATION
Syphilis in Dade CountyInfectious Syphilis in
Miami-Dade County, Florida
1998-2001
175
150
125
MSM
100
Heterosexual men
75
Women
50
25
0
1998 1999 2000 2001
through
JuneOutbreak Investigation
• Objective(s)
• The investigation
– Case-control design: who are controls?
– What other sources of information might be
useful?
– Laboratory studies?
• Questionnaire: what do you want to know?A Theoretical Framework for
STD Epidemiology:
From Transmission Dynamics to
Program Design
Part IIRole of STD Outbreak Investigations
in STD Control
• Confirm the existence of a suspected outbreak
• Assess the extent of under reporting
• Determine risk factors for increased transmission
• Assess extent of emerging antimicrobial resistance
• Describe STD/HIV interrelationships in the setting of
acute increases in morbidity
• Provide data for improving local STD/HIV prevention and
control strategiesMethods for STD Outbreak
Investigations
• Patient interviews, focus groups, and qualitative community
assessment
• Detailed review of medical and laboratory records
• Retrospective and prospective case-control studies
• Intensive use of laboratory testing, including new diagnostic
testsUsing a Theoretical Framework
to Design STD and HIV
Prevention ProgramsApproaches to STD prevention:
Decreasing transmission efficiency
(Ro=βcD)
• Male condoms (HIV, gonorrhea)
• Female condoms (maybe)
– make condoms available, affordable, and
appealing (normative)
• Microbicides (maybe)
• Reduce vaginal douching, which washes
away normal flora
• Decrease efficiency of HIV transmission by
treating other STDsCondoms only work if they’re used
Must be:
• Available
• Affordable
• Appealing
(normative)Topical microbicides:
2nd generation products and the future
Viral Target Microbicide
Free virus Savvy
BufferGel
Fusion/Attachment PRO2000
Cellulose sulfate
Reverse transcription Tenofovir
• 30-40 candidates in preclinical development
• 14 products in early safety trials
• 5 products in large-scale efficacy trials (first results
expected in 2007)
• Microbicide could be commercially available by 2010Randomized trial of circumcision
in South Africa (ANRS trial)
Number of Number of Acquisition
subjects HIV rate per 100
(ages 15- acquisitions person-
24y) years
Control group 1590 49 2.1
Circumcision 1538 20 0.85
Relative risk = 0.4 (60% protection)
Aubert et al, 2005.Circumcision: Unresolved issues • Efficacy in other populations and settings • Impact of hygiene on transmission • Age at circumcision • Acceptability • Feasibility – Operations – Safety
Genital herpes (HSV-2) and HIV
             prevention
• HSV-2 may account for up to 74% of new HIV
  infections in men and 22% in women in some
  populations (del Mar Pujades Rodriguez M et
  al. AIDS 2002;16:451-62)

• Two large placebo-controlled trials of HSV
  suppression for HIV prevention are ongoing:
  – NIH study at 9 global sites, high-risk women and
    MSM, results 2007
  – Partners in Prevention, 14 sub-Saharan African
    sites, discordant couples, results 2008
Antiretroviral (ARV) therapy as
prevention
• Mechanisms
– In HIV-infected persons, reduces viral load
– In HIV-negative persons, prevents HIV
infection of cells or replication in cells
• Uses
– PMTCT (for mother and child)—proven
effective
– HIV-infected persons—some evidence
– Pre- and post-exposure prophylaxis—
under studyRationale for pre- and post-exposure
prophylaxis (PrEP) trials with tenofovir
• Nucleotide reverse transcriptase inhibitor
• Licensed by U.S. FDA for treatment of HIV
• Long half-life allowing once daily dosing
• Phase II/III studies – safe and effective
• Prevents HIV infection in animal models
• Minimal drug-drug interactions
• Few resistance mutations
• Studies underway
– USA: gay men
– Thailand: injecting drug users
– West Africa: high-risk womenWhat’s next for tenofovir PrEP?
• Combination tenofovir and FTC (Truvada) is
being studied in:
– Botswana (young men and women)
– Peru (gay men)
• Scale-up issues
– Expansion beyond motivated study participants (how
to find target group, adherence with/without DOT)
– Cost (who will benefit most from it?)
– Potential for resistance (how to treat persons who
become infected while on tenofovir PrEP?)Biomedical interventions:
A note of caution
• Randomized controlled trial in South Africa has shown
60% lower incidence of HIV in circumcised men
(reported 2005)
• According to transmission models, the benefit of
circumcision to the man would be overcome by a 30%
increase in risk behavior
• Similar concerns have been raised for other incompletely
protective interventions:
– vaccines
– pre-exposure prophylaxis (maybe)Approaches to STD prevention: Changing sexual behaviors (Ro= βcD) • Desirable behavior changes – increasing condom use – delaying initiation of sexual intercourse – reducing number of sexual partners • Types of interventions – individual-focused (enhanced counseling) – community-level (peer opinion leaders) – mass media messages
Increasing condom use turns
                                                       epidemics around
                                                  4
           Percent of adults living with HIV

                                                  3

                                                  2

                                                  1

                                                  0
                                                                              05

                                                                                      10

                                                                                                15

                                                                                                              25

                                                                                                                     30
                                                 85

                                                         90

                                                                95

                                                                       00

                                                                                                       20

                                                                                                            20

                                                                                                                   20
                                               19

                                                       19

                                                              19

                                                                     20

                                                                            20

                                                                                    20

                                                                                              20

                                                                                                     20
         30%                                          40%     50%    60%      70%          80% condom use in sex work

Source: T. Brown, 2006
In Thailand, focused prevention altered
the course of the HIV epidemic
10
C u rre n t H IV In fe c tio n s in m illio n s
Red line represents what
might have been if
8 behaviors had not changed
in Thailand
6 Infections
prevented
4
2
0
95
10
85
90
00
05
19
19
20
20
20
19
With behavior change Without prevention
Source: T. Brown, 2006Sexual Network:Syphilis Among
MSM in Miami-Dade County, Florida
H
H
Syphilis Status H
Uninfected
Primary
Secondary
Early Latent
H Known HIV positiveCan we use network information for
health promotion?
• With complete information we could
implement prophylaxis
• Can use it to change community norms
• Can use it to decide who should be the
focus of interventions and how to
segment the audience
Source: T. Valente, 2002.Network Data Types
Network Data Type Instrument Result
Had sex the past 6 Dichotomous Risk -
Survey
months? Yes/NO
Ego centric Provide first names Characterize sexual
of people had sex partners
with?
Sequential/ Contact trace recent Identify specific
snowballing sexual partners individuals at risk
Sociometric Ask for names of Map sexual/ social
sexual partners network
Locations Where had sex? Locate sites of
opportunity &
infectionOpinion Leaders: Individuals Who
Receive the Most Nominations
33 32 4
10 28
13 30
14
1
6
15
8
2
3
29
5
9
11
7
12
31Opinion Leaders Promoting Positive Behavior Change
Approaches to STD prevention:
Reducing duration of infectiousness (Ro=
                 βcD)
 • Treatment of infected patients
 • Treatment of sexual partners and suspects
 • Screening to identify asymptomatic or latent
   infections (better for curable bacterial
   infections than for viral infections)
 • Screening of pregnant women to prevent
   transmission to fetus/neonate
 • Health services must be:
    – high quality, accessible, affordable
Treatment of Exposed Persons
(Sexual Partners)
• Patient or health care provider tells
partner(s) that they need treatment
• Pre-emptive treatment
• Patient-provided partner therapy
reduces rates of reinfection
(azithromycin for chlamydial infection;
Schillinger et al)Screening Works…
…But Has LimitsRegion X– Chlamydia positivity in 15 – 24 year old women
in family planning clinics, 1988-2005
Percent Positive
15.1
15
11.811.4
AK
10 9.5
8.2
7.5 7.7 7.4
6.7
6.1 5.7 6.1 6.2
5.6 6.0
5.1 4.9 4.9
5
WA
0
OR 1988 89 90 91 92 93 94 95 96 97 98 99 2000 01 02 03 04 05
ID
Unadjusted AdjustedRescreening vs. Routine Testing of STD
Patients
Rescreening
hIn a recent study, 12% of rescreened patients had an STD
(gonorrhea, chlamydia, syphilis, or HIV)
hAnother large study found 15% rate of reinfection with
chlamydia among young women within 4 months (Schillinger
et al)
Routine testing
hGonorrhea positivity rates 0.1%-4.5% (young women)
hChlamydia positivity rates 2.8%-15.8% (young women)Source: D. Law, 2001
Applications of Kriging to STD
            Prevention
• Estimate rate of STD over a continuous
  surface
• Evaluate spatial spread of STD through
  time
• Refine geographic descriptions of
  “core”, “adjacent”, “periphery”, etc. in
  urban areas
• Identify locations for resource allocation
  and interventions
STD intervention in Mwanza trial • STD reference center in Mwanza town • Training of health workers in syndromic treatment, health education, condom promotion • Regular supply of effective STD drugs • Regular supervisory visits to health centers • Periodic visits to villages by health educators to promote treatment for symptomatic STDs
Factors possibly affecting impact of
  STI treatment on HIV infection

• Stage of the HIV epidemic
• Differences in proportional incidence of
  curable STIs (i.e., bacterial versus viral)
• Differences in incidence of STIs most
  strongly associated with HIV
  transmission (gonorrhea, syphilis,
  herpes, other ulcerative diseases)
• Symptomatic versus asymptomatic
  infection
Epidemics Evolve…
Extensive prevention alters the course & creates
    a moving target – HIV cases in Thailand
      100%
       90%
       80%                                                                          Extramarital

       70%                                                                          Female from
                                                                                    Husband
       60%                                                                          Sex worker

       50%                                                                          Male from wife
       40%                                                                          Male from sex
                                                                                    worker
       30%                                                                          Male sex with male
       20%
                                                                                    Injection Drug User
       10%
        0%
           88

                 90

                         92

                               94

                                     96

                                                       02
                                           98

                                                 00

                                                             04

                                                                   06

                                                                         08

                                                                               10
         19

                19

                      19

                              19

                                    19

                                          19

                                                20

                                                      20

                                                            20

                                                                  20

                                                                        20

Source: T. Brown, 2006                                                        20
Preventing STDs and Sexually
Transmitted HIV: Summary
• Three key factors maintain the circulation of STDs
and sexually transmitted HIV
– Efficiency of transmission
– Sexual behaviors
– Duration of infectiousness
• Interventions can be designed to address these
factors
– Biomedical interventions tend to address B
– Reducing risk behaviors and addressing access to
quality health services remain critical in controlling
STDs and preventing HIV spreadYou can also read