Forecasts, trends and what "Strategic" Leaders are doing to gain the upper-hand - 2015 TAUC Leadership Conference
←
→
Page content transcription
If your browser does not render page correctly, please read the page content below

Forecasts,
trends and what
“Strategic” Leaders
are doing to gain
the upper-hand

2015 TAUC Leadership Conference   Rusty Sherwood
May 13, 2015

Position for Growth

               Optimize Performance

               Build Capacity
  60 years
one industry

               Transition Successfully
Economic
     Drivers
Construction
   Forecasts
 “…U.S. Federal Reserve pressed
 ahead at its last policy-setting
 meeting with plans to begin
 raising interest rates later this
 year despite an apparently
 vigorous debate over how to
 communicate its intentions..”
         Reuters – January 7, 2015
Reasons for optimism

INTEREST RATES              EMPLOYMENT                 OIL

   © 2014 FMI Corporation     5          U.S. Markets Construction Overview 2015

And, reasons for caution…

                            GLOBAL INSTABILITY

   © 2014 FMI Corporation          6             U.S. Markets Construction Overview 2015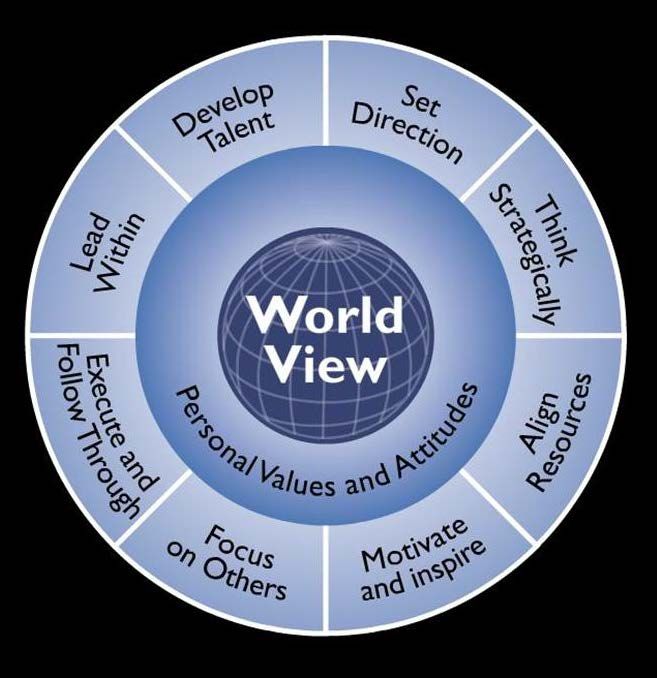
Economic
     Drivers
Construction
   Forecasts
“The combination of rapidly rising
employment, good prospects for
2015, and a depleted pool of
unemployed workers with
construction experience means
contractors may have a hard time
filling jobs with the workers they
need in coming months,"

- Ken Simonson, AGC's chief
economist
Architecture Billing Index (ABI)

                  Above 50             Below 50
80

70

60

50

40

30

20

10

 0

Source: AIA

              © 2014 FMI Corporation              8   U.S. Markets Construction Overview 2015
NRCI First Quarter 2015

                          9
Construction Spending Outlook

  Estimated Construction Put in Place

   © 2014 FMI Corporation    10         U.S. Markets Construction Overview 2015
Total Residential Construction

 •   We expect solid growth of 9% for 2015 and just a bit lower through 2019. The fast
     pace of multifamily construction is expected to slow to 9% in 2015
     and 7% to 8% through 2019.

 •   Factors impacting residential
     activity:                                  $500
      – Foreclosure rates                       $450
          slowing                               $400
      – Improving property                      $350
          values                                $300

                                     Billions
                                                $250
      – Affordability is lower                  $200
      – Mortgage rates still low                $150
      – Demographics                            $100
                                                 $50
      – Household formation low                    $
      – Job picture improving
                                                       2000
                                                       2001
                                                       2002
                                                       2003
                                                       2004
                                                       2005
                                                       2006
                                                       2007
                                                       2008
                                                       2009
                                                       2010
                                                       2011
                                                       2012
                                                       2013
                                                       2014
                                                       2015
                                                       2016
                                                       2017
                                                       2018
                                                       2019
      – Multifamily rents are up;
         vacancy rates are climbing again                           Single-Family                Multifamily

                                                 Source: FMI First Quarter Outlook 2015

     © 2015 FMI Corporation                      11                                       U.S. Markets Construction Overview 2015
Multifamily Housing Construction
• Construction put in place rose 29.0% in 2014 and will rise another
11.0% in 2015 to $55.9 billion.
• Rents rising as population shifts to the city and forgoes homeownership for
now.
$90
• Market drivers:
$80
– Children of baby boomers $70
forming fewer households
$60
– Immigration $50
Billions
– Foreclosure rates down $40
$30
– Potential homebuyers
deferring purchasing decisions $20
$10
– Hard to get credit even for
highly creditworthy borrowers $
2005
2006
2007
2008
2009
2010
2011
2012
2013
2014
2015
2016
2017
2018
2019
– Vacancies were
up slightly in the fourth quarter
2014, suggesting multifamily unit Source: FMI First Quarter Outlook 2015
growth is getting ahead of need.
© 2015 FMI Corporation 12 U.S. Markets Construction Overview 2015Lodging Construction
• Our latest forecast shows 18% growth in 2014 will slow to 16% growth
in 2015. Solid growth will continue through 2016 and slow to just 6%
through 2019.
• Market Drivers
– Baby boomers are the largest group of nonbusiness travelers.
$40
– Room starts are increasing.
$35
– Occupancy rates and RevPar are up.
$30
– Most hotels in the planning
$25
phase are upscale and large
Billions
luxury properties. $20
$15
$10
$5
$
2005
2006
2007
2008
2009
2010
2011
2012
2013
2014
2015
2016
2017
2018
2019
Source: FMI First Quarter Outlook 2015
© 2015 FMI Corporation 13 U.S. Markets Construction Overview 2015Office Construction
• Dropping unemployment rates and rising GDP have provided a lift for our office
forecast to 19% growth in 2014 and a forecast of 11% growth for 2015
to $49.5 billion.
• Market Drivers
$80
– New office space $70
absorbed at a faster rate than $60
existing office space; rent
$50
increases falling back .
Billions
$40
– Completion levels of new office
$30
space to improve in 2016.
$20
– According to JLL, “Rental growth
$10
is accelerating, with the annual
$
rate of growth on prime office 2005
2006
2007
2008
2009
2010
2011
2012
2013
2014
2015
2016
2017
2018
2019
assets increasing from 1.7% in
2013 to 3.1% in 2014 and another Source: FMI First Quarter Outlook 2015
4% rise projected for 2015.”
© 2015 FMI Corporation 14 U.S. Markets Construction Overview 2015Commercial Construction
• Commercial construction ended up 12% at year-end 2014, moderate growth
forecasted through 2019, after a 15% improvement in 2015 to $65.8
billion.
• Market Drivers:
– Vacant big-box stores renovated and
repurposed. $100
– Upscale urban power centers with $80
name-brand anchor stores show
continued strength. $60
Billions
– Grocery-anchored malls become $40
competitive.
$20
– Continued growth in residential
construction will help retail stores. $
2005
2006
2007
2008
2009
2010
2011
2012
2013
2014
2015
2016
2017
2018
– Online retail sales are increasing.
According to the U.S. Census Bureau,
non-store retail sales were up just Source: FMI First Quarter Outlook 2015
2.6% from last February 2014.
© 2015 FMI Corporation 15 U.S. Markets Construction Overview 2015Health Care Construction
• Health care construction decreased 6% in 2014, and forecasted to grow
just 4% in 2015 to $40.6 billion.
• Market Drivers
– Health care construction using more modern construction techniques such as
prefabrication, BIM and IPD (integrated project delivery).
$60
– ACA uncertainty remains
$50
– Trending toward more ambulatory
care centers. $40
– Trend toward rebuilding existing Billions
$30
facilities to use modern hospital $20
design and allow for greater use
of technology. $10
$
2005
2006
2007
2008
2009
2010
2011
2012
2013
2014
2015
2016
2017
2018
2019
Source: FMI First Quarter Outlook 2015
© 2015 FMI Corporation 16 U.S. Markets Construction Overview 2015Education Construction
• Education construction grew just 1% in 2014 to $78.5 billion and expected
to grow just 3% in 2015.
• Market Drivers:
– Rapidly increasing student populations, widespread overcrowding and antiquated
school facilities keep demand high, but funding difficulties continue.
$120
– New trends include increased green
building practices, an emphasis on $100
security considerations and increased
federal funding. $80
– Use of prefabricated/modular
school construction increasing. Billions
$60
– Distance learning and online courses $40
are on the rise.
$20
$
2005
2006
2007
2008
2009
2010
2011
2012
2013
2014
2015
2016
2017
2018
2019
Source: FMI First Quarter Outlook 2015
© 2015 FMI Corporation 17 U.S. Markets Construction Overview 2015Transportation Construction
• Transportation construction continues at a solid pace, registering 5% growth in
2014, and is expected to add 7% for 2015 to $44.7 billion.
• Market Drivers:
– Congress will need to pass a new or renewed transportation bill in 2015 to add some
stability as well as funds to the transportation sector.
– According to the American Association of Railroads rail traffic continues to grow
$70
– Record sales for Boeing are indicative
of a strong aviation market. $60
– Growth in container ports is recovering $50
from the recession. $40
Billions
– Intermodal transportation will be the $30
focus of new projects.
$20
$10
$
2005
2006
2007
2008
2009
2010
2011
2012
2013
2014
2015
2016
2017
2018
2019
Source: FMI First Quarter Outlook 2015
© 2015 FMI Corporation 18 U.S. Markets Construction Overview 2015Manufacturing Construction
• After a flat 2013, our forecast for manufacturing construction calls for 2014
to end up 6% and grow 8% in 2015 to $55.0 billion.
• Market Drivers:
– Improving energy supplies, a ready labor force and deteriorating geopolitical
situations around the globe make returning to U.S. a more desirable option.
$80
– Capacity utilization for
$70
manufacturing improved in
July to 79.2. (Federal $60
Reserve) $50
Billions
– Production for utilities has $40
seen gains, especially for $30
natural gas. $20
– Lower natural gas prices will $10
help manufacturing energy $
inputs.
2005
2006
2007
2008
2009
2010
2011
2012
2013
2014
2015
2016
2017
2018
– The Manufacturing ISM® Report
Source: FMI Third Quarter Outlook 2014
On Business® reports the ISM
index rose to 57.1 in July. That
represents 14 months of growth.
© 2014 FMI Corporation 19 U.S. Markets Construction Overview 2015Low cost energy and resource proximity creating a boom for
U.S. Energy Construction
petro-chemical Market
manufacturing – Pricing Drivers
expansion…
20Non-building Construction
$100
Highway and street construction managed to grow $80
Billions
$60
1% in 2013 and should manage to grow 2% in $40
2014 to reach $83.1 billion. $20
$
2005
2006
2007
2008
2009
2010
2011
2012
2013
2014
2015
2016
2017
2018
$140
Forecast pulled back from 5% to 3% growth for $120
$100
power industry construction put in place for 2014
Billions
$80
$60
with slower growth to continue through 2018 to $40
$20
$86.7 billion. $
2005
2006
2007
2008
2009
2010
2011
2012
2013
2014
2015
2016
2017
2018
•
Source: FMI Third Quarter Outlook 2014
© 2014 FMI Corporation 21 U.S. Markets Construction Overview 2015“History doesn’t repeat itself, but it rhymes…”
Source: Robert Murray, Chief Economist
Dodge Data and Analytics, 2015 Outlook
22Trends
Leadership
Response
“Everything that can be invented has
been invented.”
- Director - US Patent Office, 1899© 2013 FMI Corporation 25
Productivity Enablers

    Current
                      BIM and Virtual Imaging

                                                     Mobility & Rea -Time Connectivity
                      Pre-Fabrication &
      Market Impact

                      Modularization

                      Alternative Project Delivery

                      3-D Printing & ???
    Future

                                 26
BIM and Virtual Imaging
BIM and Virtual Imaging
Creates
Collaboration
Ensured Constructability
Schedule Precision
Waste Elimination
Pre-Fab
27Pre-Fabrication
Pre-Fab & Modularization
Creates
Job-site Efficiency
Quality
Skilled Labor Alternative
Waste Elimination
Greener Construction
28Alternative Delivery Methods
P3 / Integrated Project Delivery
Creates
Greater Collaboration
Project Funding
DBOM Options
Improved Schedules
Reduced29 Litigation3-D Printing and …
3-D Printing
Creates
Job-site Efficiency
Quality
Skilled Labor Alternative
Waste Elimination
????
30Disruptive Technologies…shift is happening. © FMI’s Center for Strategic Leadership 31 Source: Mckinsey Global Insitute Analysis
Disruptive Technologies…shift is happening.

© FMI’s Center for Strategic Leadership   32   Source: Mckinsey Global Insitute Analysis
“Downstream” - Unprecedented North America Investment

    © 2014 FMI Corporation    33              U.S. Markets Construction Overview 2015
Share
0%
10%
20%
30%
40%
50%
60%
Source: ENR, FMI
1965
1967
1969
1971
1973
1975
1977
1979
1981
1983
1985
1987
35
1989
1991
1993
1995
1997
1999
2001
2003
2005
2007
2009
ENR 400 Share of Total Construction Put in Place
2011
2013Megapolitans
Cascadia Ten megapolitan areas will have populations of at
least 10 million each by 2040.
Northeast
NorCal
Midwest
Southland
I-35 Corridor
Valley of the Piedmont
Sun
Gulf Coast
Peninsula
Source: Metropolitan Institute at Virginia Tech
© 2014 FMI Corporation 36 U.S. Markets Construction Overview 2015Supply and Demand – number of live births, 1920 - 2005 Source: National Center for Health Statistics, Center for Disease Control and Prevention Mitra Toossi, Monthly Labor Review, November 2006
Talent shortages…top growth impediment?

                61% believe the lack of skilled labor
                will impact competitiveness and / or
                         slow ability to grow

                                                                  Source: FMI - Craft Labor
                                                                  Recruiting & Retention
                                                                  2015 Survey Report

   © 2014 FMI Corporation            38                 U.S. Markets Construction Overview 2015
Talent shortages…top growth impediment?
Top Five Trade workers in Demand Top Five Trade workers expected to
for the next Five Years be the Hardest to Find in the next
Five years
• Craft helpers
• Operator (heavy equipment)
• Laborers
• Welders (boilermaker)
• Operators (heavy equipment)
• Carpenter
• Carpenters
• Pipefitter (all including plumbing)
• Ironworkers (reinforcing)
• Ironworker (reinforcing)
Source: FMI - Craft Labor
Recruiting & Retention
2015 Survey Report
© 2014 FMI Corporation 39 U.S. Markets Construction Overview 2015October 15, 2008
40Volatile Uncertain Complex Ambiguous
Trends
      Leadership
       Response

“Grant me the serenity to accept

the people I cannot change, the

courage to change the person I can

and the wisdom to know it is me.”

- Anonymous
Leadership Response
To provide vision and direction for the enduring
growth and success of an organization.
To overcome change and ambiguity by creating
common purpose and alignment across workgroups
supported by sound strategy, and an organization-
wide will to adapt.
Strategic Leadership
© FMI’s Center for Strategic Leadership 43Leadership Response
To provide vision and direction for the enduring
growth and success of an organization.
To overcome change and ambiguity by creating
common purpose and alignment across workgroups
supported by sound strategy, and an organization-
wide will to adapt.
Strategic Leadership
© FMI’s Center for Strategic Leadership 44Enduring
Success = V(ision) * T(alent) C(ulture)
© FMI’s Center for Strategic LeadershipVision
The Golden Circle

                      And, The Power of Why
                           © Simon Sinek - http://www.startwithwhy.com/
© Simon Sinek, Inc.
Visionary organizations significantly outperform
their closest rivals
Source:
Built to Last
Porras & Collins
by over 7x’s in return on shareholder value over
the course of 5 decades…
© FMI’s Center for Strategic LeadershipStrategic Leaders
(who drive growth regardless of forecasts)
Establish an organization’s why
that points to true purpose, reinvention and innovation
Challenge the status quo…
How well do we understand implications of broad industry trends and
less visible undercurrents to our long-range plans and strategic choices?
Create alignment between
Long term vision
Strategic priorities
Productivity initiatives
Talent & leader requirements
Vision
© FMI’s Center for Strategic LeadershipTalent
“   The first most important decisions are people decisions. The
    corporate leaders we studied who ignited transitions from good to
        “First
    great
    on thepeople
                 getthe
           practiced  the
            bus, the off the
                     wrong
                            right people
                         discipline
                               bus,offand
                            people
                                               on the
                                    of “First Who”:
                                              theand
                                        the bus,
                                                          bus,
                                                    first get
                                                  right
                                                              thethe
                                                           people
                                                      the right
                                                                  rightwrong
                                                                        people
                                                                peopleininto
                                                                          the
    the right seats and then figure out where to drive the bus. To be clear,
          right seats, then figure out where to drive the

                                                                                         ”
    the First Who principle is not the only requirement for building a great
    company. But until you have 90%bus.” to 100% of your seats filled with
    the right people, there is no more important priority.

    Jim Collins

                                                         © FMI’s Center for Strategic Leadership
Attracting Millennials
According to the Brookings Institute,
“Almost two-thirds (64 percent) of
millennials said they would rather make
$40,000 a year at a job they love than
$100,000 a year at a job they think is
boring….Millennials overwhelmingly
responded with increased trust (91
percent) and loyalty (89 percent), as well
as a stronger likelihood to buy from
those companies that supported
solutions to specific social issues (89
percent).”
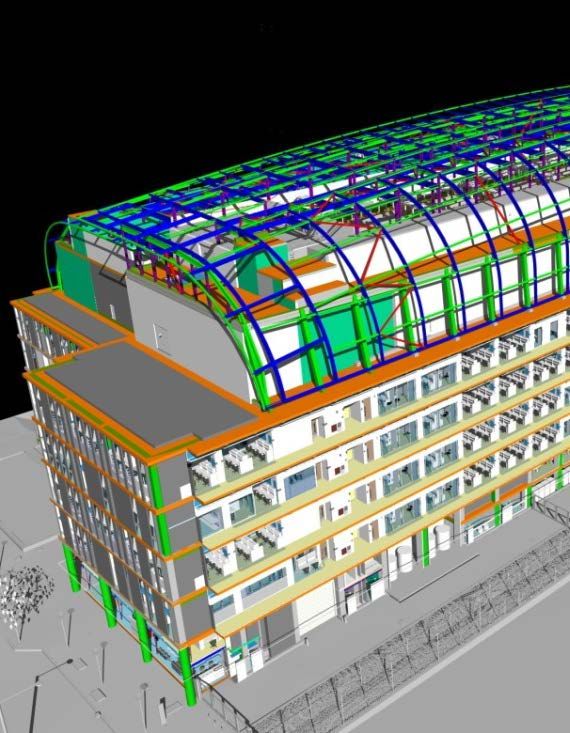
Source: To Win The War For Talent, Give Them Purpose, Not Just ATalent essential… Developing future leaders
Peak Leaders
Do more SAM,
less POC
Understand what
drives great
engagement and
results through
others
© FMI’s Center for Strategic LeadershipTalent essential… Strategic Thinkers at all levels
Business Impact
Productivity
New Markets
Better Processes
Innovative
Services
© FMI’s Center for Strategic LeadershipStrategic Leaders
(who drive growth regardless of forecasts)
Get and keep the right people on the bus
Build a “deep bench” of future strategic leaders
Create and reinforce the willingness and ability for teams to
effectively collaborate and think strategically
Focus on building consistent…
Mutual Trust
Respect
Constructive Debate
Results Bias
Talent
© FMI’s Center for Strategic LeadershipAdaptable Culture
“The way we do things
    around here.”
Adaptability
The power to
detect
and respond
to change in the
world, no matter how
surprising or
inconvenient
it may be.Obstacles to Increasing Organizational
Agility (top 6)
Conflicting goals/priorities of different departments 64.60%
Decision-making can take too long 57.60%
Necessary information resides in silos 50.30%
Difficulty in measuring the business impact of
learning 42.40%
Lack of budget flexibility 41.40%
“Culture is risk adverse and slow to adopt innovation”
Culture is risk-averse and slow to adopt innovation40.60%
0.00% 20.00% 40.00% 60.00% 80.00%
Source: HCM Advisory Group, Saba © FMI’s Center for Strategic LeadershipStrategic Leaders
(who drive growth regardless of forecasts)
Put the right rewards in place to shift / reinforce behaviors
Only recognize success based on exceeding expectations within
the intended values and culture of organization / company
Create an atmosphere of collective
genius
Create cultures that embrace VUCA
© FMI’s Center for Strategic Leadership
Culture1 Idea Bring together a cross-section of current
and future leaders…
Determine what TAUC member
organizations must do to become
more VUCA adaptive & attractive
to the next generation
Identify the top three cultural
impediments that prevent this
from happening
Enlist a consortium of senior
leaders and “rising-stars” to
eliminate these impediments
Culture
© FMI’s Center for Strategic LeadershipConnecting Lumpy recovery continues
the wires… Stage is set for long-term growth in
industrial & demographic driven
segments
Opportunities exist but showing up
in new ways
Trends creating opportunities or
obstacles depending on
understanding and ability to adapt
Strategic Leaders are setting
direction, better aligning limited
resources to drive sustained growth
and adjusting motivators to attract
and retain a diverse cross section of
talent and future leaders
© FMI Center for Strategic LeadershipRaleigh Denver Phoenix Tampa
Developing Exceptional Leaders One at a Time
About FMI Rusty Sherwood
FMI is the largest provider of management consulting, investment
banking and research to the engineering and construction Senior Consultant
industry. We work in all segments of the industry providing clients
with value-added business solutions, including: 210 University Blvd,
Suite 800
• Strategy Development
• Market Research and Business Development Denver, CO 80206
• Leadership and Talent Development
• Project and Process Improvement (303) 398-7257
• Mergers, Acquisitions and Financial Consulting
rsherwood@fminet.com
Founded by Dr. Emol A. Fails in 1953, FMI has professionals in
offices across the U.S. FMI delivers innovative, customized
www.fminet.com
solutions to contractors; construction materials producers;
manufacturers and suppliers of building materials and equipment; @FMI_Leadership
owners and developers; engineers and architects; utilities; and
construction industry trade associations. FMI is an advisor you
can count on to build and maintain a successful business, from
your leadership to your site managers.
64
© 2012 FMI CorporationYou can also read