2021 Drinking Water Quality Report - City of Liberty
←
→
Page content transcription
If your browser does not render page correctly, please read the page content below
2021 Drinking Water
Quality Report
Consumer Confidence Report Featuring Calendar
Year 2020 Water Quality Data

Dear valued City of Liberty water consumer,
This report presents important information
on City of Liberty drinking water quality.
                                                    WHY YOU
It also discusses our local raw water supply      SHOULD READ
and our commitment and methods to turn             THIS REPORT
the raw supply into drinking water you can
trust, delivered to your tap everyday.           This report is intended to
                                                provide you with important
You will find information on how to               information about your
participate in local sourcewater protection      drinking water and efforts
and actions you can take - like picking up         by the Liberty Utilities
after your pets and using lawn chemicals        Department to provide safe
sparingly - that help keep the water in our            drinking water.
storm drains clean. On behalf of the entire
City of Liberty Utilities Department, I look      Attencion! Este informe
forward to serving you each day!                contiene información muy
                                                 importante. Tradúscalo o
Please contact our office at 816.439.4517 for   prequntele a alguien que lo
more information or with any questions on             entienda bien.
this report.
Sincerely,

Andy Noll
City of Liberty Director of Utilities
                                                                              1
WATER QUALITY DO I NEED TO TAKE ANY
REPORT HIGHLIGHTS SPECIAL PRECAUTIONS
The Missouri Department of Natural A MESSAGE FOR
Resources regulates our water system and VULNERABLE
requires us to test our water on a regular POPULATIONS
basis to ensure its safety. Our system has
been assigned the identification number Some people may be more vulnerable
MO-1010466 for the purposes of tracking to contaminants in drinking
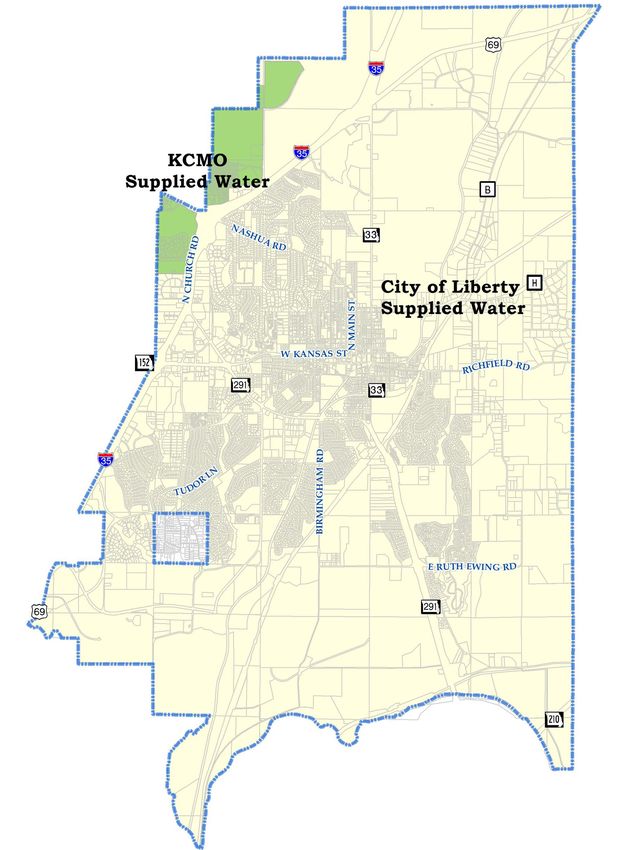
our test results. Some Liberty residents water than the general population.
receive water from the City of Kansas City, Immunocompromised persons, such as
Missouri water system (see map on page 6). persons with cancer undergoing chemotherapy,
The KCMO water system has been assigned persons who have undergone organ transplants,
the number MO-1010415 for the purposes people with HIV/AIDS or other immune system
of tracking test results. disorders, some elderly and infants can be
particularly at risk from infections.
Last year, we tested for a variety of
contaminants. You’ll find the detectable These people should seek advice about drinking
results of these tests on the following water from their health care providers. The
pages of this report. Any violations of State Environmental Protection Agency/Centers for
requirements or standards will be further Disease Control guidelines on appropriate means
explained later in this report. to lessen the risk of infection by Cryptosporidium and
other microbial contaminants are available from the Safe Drinking
The City of Liberty conducted water quality Water Hotline at 800.426.4791.
testing in 2020 as required by Federal and
State regulations. Over the course of the
year, Liberty Water Treatment Plant staff HOW CAN I GET INVOLVED?
performed thousands of laboratory tests
on water inside the plant, on treated water If you would like to observe the decision-making process that
leaving the plant and on drinking water affects drinking water quality or if you have any further questions
from several locations around Liberty to about this report, please call us at 816.439.4510 to inquire about
monitor water quality and ensure clean scheduled meetings or contact persons, or check the website at
safe drinking water is provided to Liberty www.libertymissouri.gov/utilities.
customers.
The City of Liberty is committed to providing its residents with a
The tables in this report present 2020 safe and reliable source of high-quality water.
results and corresponding water quality
standards for detected contaminants.
2
LEAD AND COPPER IN DRINKING WATER
Municipal drinking water is a unique
product — it is the only life-sustaining
resource reliably delivered by others
to your home around the clock for
your convenient use on demand.
This requires special infrastructure
including a valuable, extensive and
relatively expensive piping network.
Elements of this network, especially
residential plumbing systems, contain
lead. While the plumbing industry
has reduced the lead level in these
elements, it has not yet entirely
eliminated it. Homes built prior to
1986 are more likely to have plumbing
materials with greater lead levels, but
newer homes are also at risk.
If present, elevated levels of lead
can cause serious health problems,
especially for pregnant women and young children. Lead in drinking water is primarily from materials and
components associated with service lines and home plumbing. The Liberty Utilities Department is responsible
for providing high-quality drinking water, but cannot control the variety of materials used in plumbing
components. When your water has been sitting for several hours, you can minimize the potential for lead
exposure by flushing your tap for 30 seconds to two minutes before using water for drinking or cooking.
If you are concerned about lead in your water, you may wish to have your water tested. Information on lead
in drinking water, testing methods, and steps you can take to minimize exposure is available from the Safe
Drinking Water Hotline (800.426.4791) or at http://water.epa.gov/drink/info/lead/index.cfm
Contact Kevin Ash of the Liberty Utilities Department Water Division at 816.439.4571 for additional guidance.
You can also find sample results for all contaminants from both past and present compliance monitoring online
at the Missouri DNR Drinking Water Watch website www.dnr.mo.gov/DWW. To find Lead and Copper results
follow these steps:
   • Type “Liberty PWS” or “Kansas City PWS” in the box titled Water System Name and select Find Water
     Systems at the bottom of the page
   • The new screen will show you the water system name and number (Liberty: MO-1010466; Kansas City:
     MO-101415). Click the Water System Number.
   • At the top of the next page, under the Help column, click on Other Chemical Results by Analyte.
   • Scroll down alphabetically to Lead and click the blue Analyte Code (1030). A sample collection date range
     may need to be entered.
   • The Lead and Copper locations will be displayed under the heading Sample Comments. Scroll to find your
     location and click on the Sample No. for the results.
If you assisted the Utilities Department in taking a Lead and Copper sample from your home but cannot find
your location in the list, please contact the Liberty Utilities Department Water Division for your results.

                                                                                                                3
IF IT’S ON THE GROUND - IT’S IN OUR WATER
    Storm drains are the metal grates found on urban
    and suburban streets, often at corners and on
    the sides of curbs and gutters. They help prevent
    flooding by draining rainwater and melted snow
    off of streets and other paved surfaces.
    While storm drains were designed to divert
    water from streets, they can become dangerous
    water polluters when harmful substances from
    lawns and streets flow through them. During a
    rainfall, water runs down streets and through
    yards, picking up substances along the way. This
    “runoff ” often contains elements that pollute our
    waterways, can harm wildlife, and degrade water
    quality.
    Water that enters storm drains is not cleaned at a wastewater treatment plant before it flows directly to
    streams, rivers and lakes. Some common contaminants in stormwater include lawn chemicals, pet waste,
    household chemicals like paint and soaps used for washing cars.
    Is a Storm Drain System the same thing as a Sanitary Sewer System?
    Sewer systems and storm drain systems are not the same. The water that goes down a sink or toilet in your
    home or business flows through a sanitary sewer system to the wastewater treatment plant where it is
    treated and cleaned. Water that flows down a driveway or street and into a gutter goes into a storm drain
    which goes directly to a natural body of water, untreated.
    How can I help?
    There are several simple actions you can take that can save time, resources and money — all while
    protecting the health of residents, communities and the environment.
      •   Pick up after your pet. Pet waste is not a fertilizer – it contains harmful bacteria. Carry disposable
          bags while walking your dog to pick up and dispose of waste properly.
      •   Use lawn chemicals sparingly. Chemical fertilizers, pesticides and herbicides can contain
          ingredients harmful to human health and the environment. Improper application of these substances
          causes them to run off lawns and down storm drains.
      •   Go natural. Instead of using chemical products, consider compost or natural lawn-chemical
          alternatives.
      •   Landscape with native plants and rain gardens. Native plants have natural properties that often
          eliminate or reduce the need for mowing, fertilizing or using pesticides. Rain gardens catch
          stormwater and slowly filter it into the ground, meaning less water runs off lawns into our storm
          sewers, helping prevent flooding and erosion in our streams.
      •   Keep waste out of storm drains. Sweep driveways and sidewalks clean. Remove debris and residue
          that could end up in a storm drain from concrete and paved areas around your house. Never discard
          trash or yard waste down storm drains or in the street.
    For more information about how you can help keep our waterways clean, visit
    www.marc.org/environment/water-resources.

4
LIBERTY UTILITIES DEPARTMENT’S WATER SUPPLY
The Missouri Department of Natural Resources conducted a source water assessment to determine the
susceptibility of our water source to potential contaminants. This process involved the establishment of source
water area delineations for each well or surface water intake
and then a contaminant inventory was performed within those
delineated areas to assess potential threats to each source.
Assessment maps and summary information sheets are available at
www.drinkingwater.missouri.edu
To access the maps for your water system you
will need the State-assigned identification code. The code for
Liberty is MO1010466. Some Liberty residents receive water
from the City of Kansas City, Missouri water system (see map
on page 6). The code for Kansas City is MO1010415. The Source
Water Inventory Project maps and information sheets provide
a foundation upon which a more comprehensive source water
protection plan can be developed.

WHAT IS THE SOURCE OF MY WATER?
The sources of drinking water (both tap water and bottled water)
include rivers, lakes, streams, ponds, reservoirs, springs and
groundwater wells. As water travels over the surface of the land or
through the ground, it dissolves naturally-occurring minerals and, in some cases, radioactive material, and can
pick up substances resulting from the presence of animals or from human activity.

OUR WATER COMES FROM THE FOLLOWING SOURCES:
                       Liberty                                                     Kansas City
        Source Name                     Type                      Source Name                        Type
           Well #4                  Ground Water                  Missouri River                 Surface Water
           Well #5                  Ground Water                     Well #1                     Ground Water
           Well #6                  Ground Water                     Well #2                     Ground Water
           Well #8                  Ground Water                     Well #3                     Ground Water
           Well #9                  Ground Water                     Well #4                     Ground Water
          Well #10                  Ground Water                     Well #5                     Ground Water
          Well #11                  Ground Water                     Well #6                     Ground Water
          Well #13                  Ground Water                     Well #7                     Ground Water
          Well #14                  Ground Water                     Well #8                     Ground Water
                                                                     Well #9                     Ground Water
                                                                    Well #10                     Ground Water
                                                                    Well #11                     Ground Water
                                                                    Well #12                     Ground Water
                                                                    Well #13                     Ground Water
                                                                    Well #14                     Ground Water
                                                                                                                  5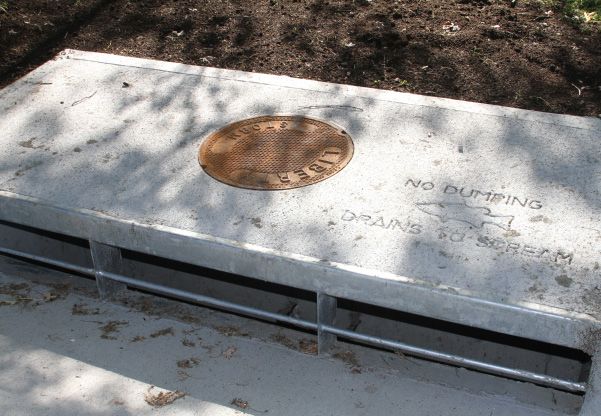
6
WHAT IS IN MY WATER?
Drinking water, including bottled water, may reasonably
be expected to contain at least small amounts of some
contaminants.
The presence of contaminants does not necessarily indicate
that water poses a health risk. More information about
contaminants and potential health effects can be obtained
by calling the EPA’s Safe Drinking Water Hotline at
800.426.4791.
Contaminants that may be present in raw water (source
water before we treat it) include:
 • Microbial contaminants, such as viruses and bacteria,
   which may come from sewage treatment plants, septic
   systems, agricultural livestock operations and wildlife.
 • Inorganic contaminants, such as salts and metals,
   which can be naturally occurring or result from urban stormwater runoff, industrial or domestic wastewater
   discharges, oil and gas production, mining or farming.
 • Pesticides and herbicides, which may come from a variety of sources such as agriculture, urban stormwater
   runoff and residential uses.
 • Radioactive contaminants, which can be naturally occurring or be the result of oil and gas production and
   mining activities.
 • Organic chemical contaminants, including synthetic and volatile organic chemicals, which are by-products
   of industrial processes and petroleum production, and can also come from gas stations, urban stormwater
   runoff and septic systems.
In order to ensure that tap water is safe to drink, the Department of Natural Resources prescribes regulations
that limit the amount of certain contaminants in water provided by public water systems. Department of Health
regulations establish limits for contaminants in bottled water, which must provide the same protection for public
health.

WATER QUALITY TESTING RESULTS - City of Liberty (#MO1010466)
The tables on page 8-9 of the report list all the drinking water contaminants detected during the 2020 calendar
year in water provided by the City of Liberty. The presence of these contaminants in the water does not
necessarily indicate that the water poses a health risk. Unless otherwise noted, the data presented in this table
is from testing done January 1 through December 31, 2020. The State has reduced monitoring requirements
for certain contaminants to less often than once per year because the concentrations of these contaminants are
not expected to vary significantly from year to year. Records with a sample year more than one year old are still
considered representative. No data older than five years need be included. If more than one sample is collected
during the monitoring period, the “range” will show the lowest and highest tested results. The “Highest LRAA”,
or highest value, must be below the maximum contaminant level (MCL) or the contaminant has exceeded the
level of health based on standards and a violation is issued to the water system.

The Liberty Utilities Department will provide a printed hard copy of this CCR upon request. To request a copy
be mailed, please call us at 816.439.4517. The CCR can also be found online »
www.dnr.mo.gov/ccr/MO1010466.pdf and www.libertymissouri.gov/WaterQualityReport

                                                                                                                    7
REGULATED CONTAMINANTS
Regulated Collection Highest
Range Unit MCL MCLG Typical Source
Contaminant Date Value
Discharge of drilling wastes; Discharge
Barium 4/14/2020 0.0678 0.0678 ppm 2 2 from metal refineries; Erosion of
natural deposits
Natural deposits; Water additive which
Fluoride 4/14/2020 0.84 0.84 ppm 4 4
promotes strong teeth
Runoff from fertilizer use; Leaching
Nitrate-Nitrite 4/14/2020 0.12 0.12 ppm 10 10 from septic tanks, sewage; Erosion of
natural deposits
BYPRODUCTS OF DRINKING WATER DISINFECTION
Disinfection Sample Monitoring Highest
Range Unit MCL MCLG Typical Source
Byproducts Point Period LRAA
Byproduct of drinking water
(HAA5) DBPDUAL-03 2020 1 1.18 - 1.18 ppb 60 0
disinfection
Byproduct of drinking water
TTHM DBPDUAL-01 2020 1 1.2 - 1.2 ppb 80 0
disinfection
Byproduct of drinking water
TTHM DBPDUAL-03 2020 1 1.18-1.18 ppb 80 0
disinfection
COPPER AND LEAD
Sites
Copper and 90th
Date Range Unit AL Over Typical Source
Lead Percentile
AL
0.00231-
Copper 2018 0.0266 ppm 1.3 0 Corrosion of household plumbing systems
0.0423
Lead 2018 2.93 0-5.37 ppb 15 0 Corrosion of household plumbing systems
VIOLATIONS & HEALTH EFFECTS
Compliance Period Analyte Type
No violations occurred in the calendar year of 2020.
8UNREGULATED CONTAMINANT MONITORING RULE
Unregulated Contaminant Monitoring Rule Collection Date of HV Highest Value (HV) Range Unit
Bromide 9/25/2019 66.5 64.8 - 66.5 ppb
HAA5 11/20/2019 2.46 1.6 - 2.46 ppb
HAA6Br 11/20/2019 1.06 0.59 - 1.06 ppb
HAA9 11/20/2019 3.16 2.19 - 3.16 ppb
Manganese 9/25/2019 10.5 3.6 - 10.5 ppb
Total Organic Carbon 3/8/2019 2410 2370 - 2410 ppb
SECONDARY CONTAMINANTS
(OPTIONAL MONITORING NOT REQUIRED BY THE EPA)
Secondary standards are non-enforceable guidelines for contaminants that may cause cosmetic effects
(such as skin or tooth discoloration) or aesthetic effects (such as taste, odor or color) in drinking water.
EPA recommends these standards but does not require water systems to comply.
Secondary Containment Collection Date Highest Value Range Unit SMCL
Alkalinity, CACO3 Stability 4/14/2020 137 137 MG/L
Bromide 9/25/2019 0.0665 0.0648 - 0.0665 MG/L 0.05
Calcium 4/14/2020 25 25 MG/L
Chloride 4/14/2020 24.9 24.9 MG/L 250
Hardness, Carbonate 4/14/2020 169 169 MG/L
Iron 4/14/2020 0.0605 0.0605 MG/L 0.3
Magnesium 4/14/2020 25.9 25.9 MG/L
Manganese 4/14/2020 0.00253 0.00253 MG/L 0.05
pH 4/14/2020 8.68 8.68 PH 8.5
Potassium 4/14/2020 6.35 6.35 MG/L
Sodium 4/14/2020 21.6 21.6 MG/L
Sulfate 4/14/2020 45 45 MG/L 250
TDS 4/14/2020 244 244 MG/L 500
9WATER QUALITY TESTING RESULTS - City of Kansas City (#MO-1010415)
The tables in this section of the report (pages 10-14) list all the drinking water contaminants detected during the
2020 calendar year in water provided by the City of Kansas City, Missouri. The presence of these contaminants
in the water does not necessarily indicate that the water poses a health risk. Unless otherwise noted, the data
presented in this table is from testing done January 1 through December 31, 2020. The State has reduced
monitoring requirements for certain contaminants to less than once per year because the concentrations of
these contaminants are not expected to vary significantly from year to year. Records with a sample year more
than one year old are still considered representative. No data older than five years need be included. If more
than one sample is collected during the monitoring period, the “Range” will show the lowest and highest tested
results. The “Highest LRAA”, or highest value, must be below the maximum contaminant level (MCL) or the
contaminant has exceeded the level of health based on standards and a violation is issued to the water system.
KC Water will provide a printed hard copy of the Kansas City Water CCR upon request. To request a copy be
mailed, please call 816.513.7000. The CCR can also be found online at www.dnr.mo.gov/ccr/MO1010415.pdf and
www.kcwater.us/about-us/reports.
REGULATED CONTAMINANTS
Regulated Collection Highest
Range Unit MCL MCLG Typical Source
Contaminant Date Value
Runoff from herbicide used on row
Atrazine 5/29/2020 2.35 ND - 2.35 ppb 3 3
crops
Discharge of drilling wastes; Discharge
0.006 -
Barium 7/24/2020 0.0382 ppm 2 2 from metal refineries; Erosion of
0.0382
natural deposits
Discharge from steel / metal factories;
Cyanide 3/4/2020 0.0058 ND - 0.0058 ppm 0.2 0.2 Discharge from plastic and fertilizer
factories
0.132 - Natural deposits; Water additive which
Fluoride 7/5/2020 1.05 ppm 4 4
1.05 promotes strong teeth
Runoff from fertilizer use; Leaching
Nitrate 5/29/2020 3.95 ND - 3.95 ppm 10 10 from septic tanks, sewage; Erosion of
natural deposits
Runoff from fertilizer use; Leaching
Nitrite 7/25/2020 4.38 ND - 4.38 ppm 1 1 from septic tanks, sewage; Erosion of
natural deposits
Selenium 4/27/2020 3.5 ND - 3.5 ppm 50 50 Erosion of natural deposits
DRINKING WATER DISINFECTION
Highest
Disinfectant Date Range Unit MRDL MRDLG Typical Source
Value
Chlorine, Total 9/3/2020 3.5 ND - 3.5 ppm 4 4 Disinfectant to control microbes
10BYPRODUCTS OF DRINKING WATER DISINFECTION
Disinfection Sample Monitoring Highest
Range Unit MCL MCLG Typical Source
Byproducts Point Period LRAA
Total Haloacetic Byproduct of drinking water
DBPDUAL-01 2020 22 10.5 - 15.2 ppb 60 0
Acids disinfection
Byproduct of drinking water
DBPDUAL-02 2020 16 11.2 - 18.6 ppb 60 0
disinfection
Byproduct of drinking water
DBPDUAL-03 2020 22 11.3 - 17.8 ppb 60 0
disinfection
Byproduct of drinking water
DBPDUAL-04 2020 21 10.7 - 16.7 ppb 60 0
disinfection
Byproduct of drinking water
DBPDUAL-05 2020 19 11 - 16.1 ppb 60 0
disinfection
Byproduct of drinking water
DBPDUAL-06 2020 23 11.2 - 13.9 ppb 60 0
disinfection
Total Byproduct of drinking water
DBPDUAL-01 2020 10 5.3 - 12.2 ppb 80 0
Trihalomethanes disinfection
Byproduct of drinking water
DBPDUAL-02 2020 9 5.1 - 10 ppb 80 0
disinfection
Byproduct of drinking water
DBPDUAL-03 2020 11 4.1 - 9.7 ppb 80 0
disinfection
Byproduct of drinking water
DBPDUAL-04 2020 11 6.1 - 11.3 ppb 80 0
disinfection
Byproduct of drinking water
DBPDUAL-05 2020 9 5.4 - 10.9 ppb 80 0
disinfection
Byproduct of drinking water
DBPDUAL-06 2020 9 6 - 9.4 ppb 80 0
disinfection
TOTAL ORGANIC CARBON
Highest
TOC Date Range Unit TT Typical Source
Value
Carbon, Total 6/1/2020 3.29 1.94 - 3.29 ppm 0 Naturally present in the environment
COPPER AND LEAD
Sites
Copper and 90th
Date Range Unit AL Over Typical Source
Lead Percentile
AL
Copper 2019 0.004 ND - 0.022 ppm 1.3 0 Corrosion of household plumbing systems
Lead 2019 2.1 ND - 35.8 ppb 15 0 Corrosion of household plumbing systems
11UNREGULATED CONTAMINANTS
Unregulated contaminant monitoring helps the EPA determine where certain contaminants occur and
weather the Agency should consider regulating those contaminants in the future.
HAA5 includes dibromoacetic acid, dichloroacetic acid, monobromoacetic acid, monochloroacetic acid
and trichloroacetic acid.
HAA6Br includes bromochloroacetic acid, bromodichloroacetic acid, dibromoacetic acid,
dibromochloroacetic acid, monobromoacetic acid, tribromoacetic acid.
HAA9 includes: bromochloroacetic acid, bromodichloroacetic acid, chlorodibromoacetic acid,
dibromoacetic acid, dichloroacetic acid, monobromoacetic acid, monochloroacetic acid, tribromoacetic
acid, trichloroacetic acid.
Unregulated Contaminant Federal Level Average
Monitoring Period Range Unit
Monitoring Rule Recommended Value
Manganese 2019 NA 0.7 ND - 0.7 ppm
Total HAA5 2019 NA 14.9 7.4 - 33.1 ppm
Total HAA6Br 2019 NA 1.85 1.0 - 3.2 ppm
Total HAA9 2019 NA 16.8 8.5 - 34.8 ppm
WATER CLOUDINESS (TURBIDITY)
Turbidity is a measure of cloudiness of water. KCMO monitors turbidity because it is a good indicator
of the effectiveness of its filtration system.
Highest
Percentage of Samples in Months Monitoring Month In
Single Sources
Compliance with Standard Occurred Violation Occurred Compliance
Measurement
October and
100 12 No 0.13 Soil Runoff Yes
December
MICROBIOLOGICAL CONTAMINANTS
Microbiological Result MCL MCLG Typical Source
In the month of November
Naturally present in the
Coliform (TCR) 0.45% of samples returned as 5% 0
environment
positive
VIOLATIONS & HEALTH EFFECTS
Compliance Period Analyte Type
No violations occurred in the calendar year of 2020.
12SECONDARY CONTAMINANTS
(OPTIONAL MONITORING NOT REQUIRED BY THE EPA)
Secondary standards are non-enforceable guidelines for contaminants that may cause cosmetic effects
(such as skin or tooth discoloration) or aesthetic effects (such as taste, odor or color) in drinking water.
EPA recommends these standards but does not require water systems to comply.
Secondary Containment Collection Date Highest Value Range Unit SMCL
Alkalinity, Total 12/11/2020 53 19 - 53 ppm
Aluminum 7/24/2020 0.601 ND - 0.061 ppm
Boron 12/4/2020 0.0717 ND - 0.0717 ppm
Bromide 2/21/2020 2.54 ND - 2.54 ppm
Calcium 3/31/2020 56.4 31.7 - 56.4 ppm
Chloride 1/29/2020 34.5 15.1 - 34.5 ppm 250
Copper 12/7/2020 4.04 ND - 4.04 ppm
Iron 7/24/2020 0.154 ND - 0.154 ppm 0.3
Magnesium 9/17/2020 10 2.29 - 10 ppm
Manganese 7/24/2020 0.0062 ND - 0.0062 ppm
Nickel 7/24/2020 0.0059 ND - 0.0059 ppm
pH - 10 9.99 - 10 SU 8.5
Potassium 3/31/2020 8.64 6.08 - 8.64 ppm
Silicon 1/31/2020 4.48 2.8 - 4.48 ppm
Sodium 10/7/2020 81.9 48.2 - 81.9 ppm
Strontium 6/30/2020 0.271 0.271 - 0.205 ppm
Sulfate 4/13/2020 229 111 - 229 ppm 250
Total Dissolved Solids 10/17/2020 463 200 - 463 ppm 500
Total Hardness 4/10/2020 176 98.6 - 176 ppm
Zinc 5/12/2020 0.001 ND - 0.001 ppm 5
13RESELLER INFORMATION
A very small amount of KCMO’s drinking water is supplied from another water system through a
Consecutive Connection (CC), as outlined here. Testing results from those sources are provided below.
Buyer Name Seller Name
Kansas City PWS Jackson County PWSD 2
Jackson County PWS 2 Independence PWS
RESELLER REGULATED CONTAMINANTS
Regulated Collection Water Highest
Range Unit MCL MCLG Typical Source
Contaminant Date System Value
Discharge of drilling wastes;
Independence Discharge from metal
Barium 6/5/2018 0.0416 0.0416 ppm 2 2
PWS refineries; Erosion of natural
deposits
Natural deposits; Water
Independence
Fluoride 6/5/2018 0.19 0.19 ppm 4 4 additive which promotes strong
PWS
teeth
Runoff from fertilizer use;
Independence Leaching from septic tanks,
Nitrate-Nitrite 5/18/2020 0.319 0.319 ppm 10 10
PWS sewage; Erosion of natural
deposits
RESELLER BYPRODUCTS OF DRINKING WATER DISINFECTION
Disinfection Monitoring Water Highest
Range Unit MCL MCLG Typical Source
Byproducts Period System LRAA
Jackson
Byproduct of drinking water
(HAA5) 2020 County 17 1.95 - 42.3 ppb 60 0
disinfection
PWSD 2
Independence Byproduct of drinking water
(HAA5) 2020 7 1.81 - 4 ppb 60 0
PWS disinfection
Independence Byproduct of drinking water
TTHM 2020 3 1.04 - 2.51 ppb 80 0
PWS disinfection
Jackson
Byproduct of drinking water
TTHM 2020 County 8 1.65 - 15 ppb 80 0
disinfection
PWSD 2
RESELLER VIOLATIONS & HEALTH EFFECTS
Compliance Period Analyte Type
No violations occurred in the calendar year of 2020.
14TERMS & ABBREVIATIONS
90th Percentile: For lead and copper testing. 10 percent of test ppb: Parts per billion or micrograms per liter.
results are above this level and 90 percent are below this level. ppm: Parts per million or milligrams per liter.
AL: Action Level, or the concentration of a contaminant which, RAA: Running Annual Average, or the average of sample
when exceeded, triggers treatment or other requirements which analytical results for samples taken during the previous four
a water system must follow. calendar quarters.
HAA5: Haloacetic Acids (mono-, di-, and tri-chloracetic acide Range: Range of Results, shows the lowest and highest levels
and mono- and di-bormoacetic acid) as a group. found during a testing period, if only one sample was taken,
HV: Highest test result or highest value then this number equals the Highest Rest Result or Highest
LRAA: Locational Running Annual Average, or the locational Value.
average of sample analytical results from samples taken during SMCL: Secondary Maximum Contaminant Level, or the
the previous four calendar quarters. secondary standards that are non-enforceable guidelines for
MCL: Maximum Contaminant Level, or the highest level of contaminants and may cause cosmetic effects (such as skin or
a contaminant that is allowed in drinking water. MCLs are tooth discoloration) or aesthetic effects (such as taste, odor or
set as close to the MCLGs as feasible using the best available color) in drinking water. EPA recommends these standards but
treatment technology. does not require water systems to comply.
MCLG: Maximum Contaminant Level Goal, or the level of a SU: Standard Units for pH
contaminant in drinking water below which there is no known TT: Treatment Technique, or a required process intended to
or expected risk to health. MCLGs allow for a margin of safety. reduce the level of a contaminant in drinking water.
MRDL: Maximum Residual Disinfectant Level, or the TTHM: Total Trihalomethanes (chloroform,
maximum level of a disinfectant added for water treatment that chomodichloromethane, dibromochloromethane and
may not be exceeded without an unacceptable possibility of bromoform) as a group.
adverse health effects.
MRDLG: Maximum Residual Disinfectant Level Goal, or the
level of a drinking water disinfectant below which there is no
known or expected risk to health.
NA: Not applicable.
ND: Not detectable at testing limits.
NTU: Nephelometric Turbidity Unit, used to measure
cloudiness in drinking water
Population: 31,507 in Liberty and 460,000 in KCMO. This is
the equivalent residential population served including non-bill
paying customers.
15You can also read