Statistics on Alcohol - England, 2018 Published 1 May 2018 - NHS Digital
←
→
Page content transcription
If your browser does not render page correctly, please read the page content below
Statistics on Alcohol
England, 2018

                        Published 1 May 2018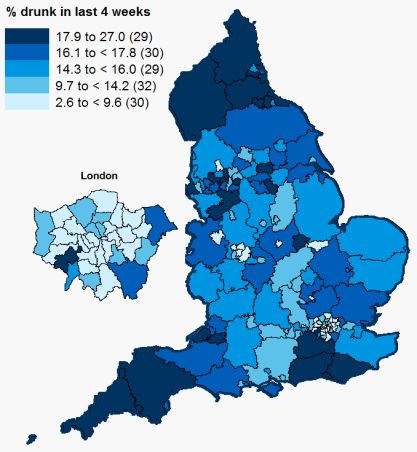
Key Facts

Key findings are shown
on this page.
                                        58%                                            337,000
                                        adults (16+) drank                             hospital
Report also includes                                                                   admissions in
information on:                         alcohol in the
                                        previous week in                               2016/17
• Alcohol-specific deaths
                                        2017
• Alcohol-related                                                       Admissions primarily due to alcohol
   prescriptions               Similar to 2016 but lower than 2007.      consumption (narrow measure).
• Drinking behaviours
   (adults and children)
• Alcohol expenditure
   and affordability
• Road accidents
                                             1%                                        5,507
   involving illegal alcohol                 lower than                                alcohol-specific
                                             2015/16                                   deaths in 2016
   levels.
                                  But 17% higher than 2006/07.        4% higher than 2015 and an increase of
                                                                                  11% on 2006.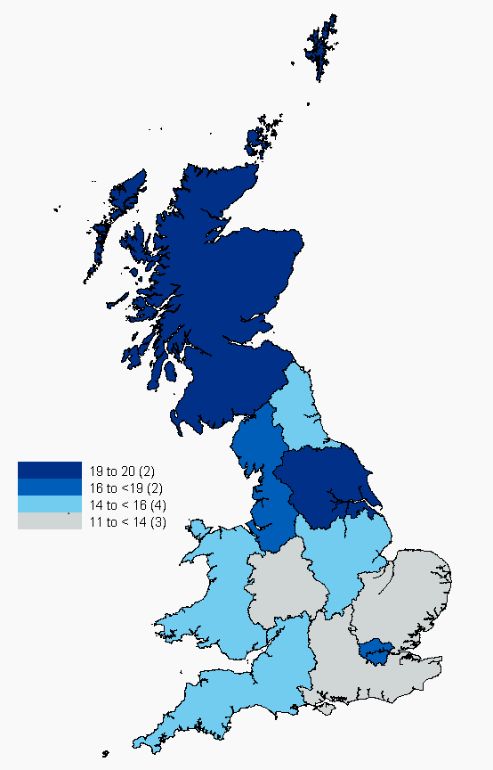
This is a National Statistics publication
National Statistics status means that official           concerns with the Authority promptly.
statistics meet the highest standards of                 National Statistics status can be removed at any
trustworthiness, quality and public value.               point when the highest standards are not
All official statistics should comply with all aspects   maintained, and reinstated when standards are
of the Code of Practice for Official Statistics. They    restored.
are awarded National Statistics status following         Find out more about the Code of Practice for
an assessment by the Authority’s regulatory arm.         Official Statistics at:
The Authority considers whether the statistics           www.statisticsauthority.gov.uk/assessment/code-
meet the highest standards of Code compliance,           of-practice
including the value they add to public decisions
and debate.
It is NHS Digital’s responsibility to maintain
compliance with the standards expected of                This report may be of interest to members of the
National Statistics. If we become concerned about        public, policy officials and other stakeholders to
whether these statistics are still meeting the           make local and national comparisons and to
appropriate standards, we will discuss any               monitor the quality and effectiveness of services.

                                                                                                              3
Contents
Introduction p5
Part 1: Alcohol related hospital admissions p6
Part 2: Alcohol specific deaths p12
Part 3: Alcohol related prescriptions p17
Part 4: Drinking behaviours among adults p21
Part 5: Drinking behaviours among children p28
Part 6: Road casualties involving illegal alcohol levels p36
Part 7: Expenditure and affordability p38
4Introduction
This statistical report1 presents a range of The latest information from already published sources
information on alcohol use and misuse by adults includes:
and children drawn together from a variety of • Alcohol-related hospital admissions published by
sources for England unless otherwise stated. PHE in their Local Alcohol Profiles for England
More information can be found in the source (LAPE) which uses data from NHS Digital’s
publications which contain a wider range of data Hospital Episode Statistics (HES).
and analyses. • Alcohol-specific deaths published by ONS.
Newly published data includes: • Health Survey for England (HSE).
• Adult Drinking Habits which is being published
by ONS on the same day as this report. • Smoking, Drinking and Drug Use (SDD).
• New analyses of data on affordability of • Road casualties involving illegal alcohol levels
alcohol using already published ONS data. published by Department for Transport.
• Information on the volume and cost of • Family Food report from the Living Costs and
prescriptions from NHS Digital. Food Survey (LCFS).
1. Most figures quoted in this report have been rounded. Unrounded data may be found in the associated data sources. 5Part 1: Alcohol-related hospital admissions
This section presents information on the number of • Broad measure – where the primary reason for
hospital admissions for diseases, injuries and hospital admission or a secondary diagnosis
conditions that can be attributed to alcohol was linked to alcohol.
consumption. The narrow measure estimates the number of
Estimates of the number of alcohol-related hospital hospital admissions which are primarily due to
admissions have been calculated by applying alcohol consumption and provides the best
alcohol-attributable fractions (AAFs)1 to Hospital indication of trends in alcohol-related hospital
Episode Statistics data. admissions.
Two measures for alcohol-related hospital The broad measure gives an indication of the full
admissions have been used: impact of alcohol on hospital admissions and the
• Narrow measure – where the main reason for burden placed on the NHS.
admission to hospital was attributable to
alcohol2.
1. An AAF is the proportion of a condition assessed to have been caused by alcohol. See appendix B for more details.
2. An alcohol-related disease, injury or condition was the primary reason for a hospital admission or an alcohol-related external cause was 6
recorded in a secondary diagnosis field.Estimated alcohol-related hospital admissions - narrow
measure
Hospital admissions – last 10 years
Thousands
400 Total number of admissions
In 2016/17 there were 337 thousand estimated
300
admissions where the main reason for admission
Partly attributable conditions
to hospital was attributable to alcohol (narrow
200
Wholly attributable conditions
measure).
100
0
This is 1% lower than 2015/16 and 17% higher
than 2006/07.
Percent
3
This represents 2.1% of all hospital admissions
2
which has changed little in the last 10 years.
1
0
For more information: Tables 1.4 and 1.5 of LAPE Statistical tables for England
Local Alcohol Profiles for England (LAPE), 2016/17 7Estimated alcohol-related hospital admissions - narrow
measure
Total number of admissions by age Total number of admissions by sex
The number of admissions rises with age up until More men than women were admitted.
45-54 and then falls. In total, 62% of the patients were male.
39% of patients were aged between 45 and 64.
75+
65 to 74
55 to 64
45 to 54 Male
35 to 44
25 to 34 Female
16 to 24
Under 16
0 20 40 60 80
Thousands
For more information: Tables 1.4 and 1.5 of LAPE Statistical tables for England
Local Alcohol Profiles for England (LAPE), 2016/17 8Estimated alcohol-related hospital admissions - narrow
measure
Admissions per 100,000 population Admissions by diagnosis
Blackpool Almost a quarter of admissions were for cancer.
had the 22% were for unintentional injuries.
highest rate
Mental and behavioural disorders due to alcohol…
at 1,150 per
attributable
Wholly
Other wholly attributable conditions
100,000 Alcoholic liver disease
population. Toxic effect of alcohol
Cancer
Redbridge
Unintentional injuries
had the
Partially attributable
Cardiovascular disease (CVD)
lowest rate Respiratory infections
at 390. Intentional injuries
Digestive disease
Diseases of the nervous system
Pregnancy and childbirth
Infectious and parasitic diseases
0 20 40 60 80
Thousands
For more information including lower tier LA figures: Tables 1.5 and 1.6 of LAPE Statistical tables for England
Local Alcohol Profiles for England (LAPE), 2016/17 9Estimated alcohol-related hospital admissions - broad
measure
There were 1.1 million estimated admissions where the primary reason for hospital admission or a
secondary diagnosis was linked to alcohol, which is 1% higher than 2015/16 (broad measure)1.
This represents 7.0% of all hospital admissions.
Total number of admissions by age Total number of admissions by sex
46% of patients were aged between 55 and 74. Just under two-thirds of patients were male.
75+
65-74
55-64
Male
45-54
35-44
25-34
Female
16-24
Under 16
0 50 100 150 200 250 300
Thousands
1. Changes over a longer time period will partly reflect improvements in recording of secondary diagnoses.
For more information: Tables 1.1 and 1.2 of LAPE Statistical tables for England 10
Local Alcohol Profiles for England (LAPE), 2016/17Estimated alcohol-related hospital admissions - broad
measure
Admissions per 100,000 population Admissions by diagnosis
Salford had 51% of admissions were for CVD.
the highest
17% were for mental and behavioural disorders due to
rate at 3,500
alcohol.
per 100,000
Mental and behavioural disorders due to alcohol use
population.
attributable
Wholly
Alcoholic liver disease
Rutland had Toxic effect of alcohol
Other wholly attributable conditions
the lowest
Cardiovascular disease (CVD)
rate at Cancer
1,390.
Partially attributable
Diseases of the nervous system
Unintentional injuries
Digestive disease
Respiratory infections
Intentional injuries
Pregnancy and childbirth
Infectious and parasitic diseases
0 200 400 600
Thousands
For more information including lower tier LA figures: Tables 1.2 and 1.3 of LAPE Statistical tables for England
Local Alcohol Profiles for England (LAPE), 2016/17 11Part 2: Alcohol-specific deaths
Alcohol misuse can be directly attributed to deaths It is a change to previous NS definition of alcohol-
from certain types of disease such as alcoholic liver related deaths. Alcohol-related deaths also
disease. This section presents information on the included diseases where only a proportion of the
number of deaths that are specific to alcohol deaths were caused by alcohol (that is, partially-
consumption. attributable deaths), such as cancers of the mouth,
The data source is the Office for National Statistics oesophagus and liver.
(ONS) which uses the new National Statistics (NS) Public Health England (PHE) produces estimates
definition of alcohol-specific deaths1. This definition for both alcohol-specific and alcohol-related deaths
only includes conditions where each death is a direct at local authority level2. Alcohol-related estimates,
consequence of alcohol misuse. The definition is which include partially attributable deaths, are
primarily based on chronic (longer-term) conditions higher than the ONS figures for alcoholic specific
associated with continued misuse of alcohol and, to a deaths
lesser extent, acute (immediate) conditions. More information on the impact of the new
definition is available on the ONS website3
1. Alcohol-specific deaths – Office for National Statistics 3. The impact of using the new definition of alcohol-specific deaths
2. Local Alcohol Profiles for England (LAPE) – Public Health England 12Alcohol-specific deaths
Alcohol-specific deaths – last 10 years
Thousands
In England in 2016, there were 5,507 alcohol-
6
specific deaths1.
4
The number of deaths is 4% higher than 2015 and
2
an increase of 11% on 2006.
0
2006 2007 2008 2009 2010 2011 2012 2013 2014 2015 2016
Rate per 100,000 population
The alcohol-specific age-standardised death rates
20 per 100,000 population were 14.5 for males in
Male
15 2016 which is over twice the rate for females (6.8).
10
Female
The rates for both males and females has
5
remained broadly similar since 2006.
0
2006 2007 2008 2009 2010 2011 2012 2013 2014 2015 2016
1. A further 1,982 deaths were also due to unspecified hepatitis and cirrhosis of the liver. These deaths are not included in the alcohol-specific slides
because they are defined as only being partially attributable to alcohol. See annex A for more details.
13
For more information: Alcohol-specific deaths in England: registered in 2016 – Office for National StatisticsAlcohol-specific deaths
Alcohol-specific deaths by age Alcohol-specific deaths by sex
The number of deaths increases with age up to 50- Just over twice as many men died as women.
59 and then decreases. In total 67% of the deaths were for men.
57% of deaths were in the age range 50-69.
80+
70-79
60-69
50-59
Male
40-49
30-39
Female
20-29
Under 20
0 500 1,000 1,500 2,000
For more information: Alcohol-specific deaths in England: registered in 2016 – Office for National Statistics
14Alcohol-specific and alcohol-related deaths
Alcohol-specific and alcohol-related deaths by condition
Thousands Alcoholic liver disease
Alcohol-specific deaths
5 accounted for 82% of the 5,507
alcohol-specific deaths. A further
4 8% were from mental and
behavioural disorders due to the
3 use of alcohol.
2
A further 1,982 deaths were due
1
to unspecified hepatitis and
fibrosis and cirrhosis of the liver.
0
These deaths are not defined as
Alcoholic Mental and Accidental Alcoholic Alcohol Other Unspecified alcohol-specific deaths1.
liver behavioural poisoning by cardiomyopathy -induced categories hepatitis
disease disorders due and exposure acute combined and fibrosis
to alcohol use to alcohol pancreatitis and cirrhosis
of the liver
1. Alcohol-specific deaths cover conditions known to be exclusively caused by alcohol (wholly attributable) and excludes conditions where only a
proportion of the deaths are caused by alcohol (partially attributable). See annex A for more details.
15
For more information: Alcohol-specific deaths in England: registered in 2016 – Office for National StatisticsAlcohol-specific deaths
Alcohol-specific deaths by region Alcohol-specific deaths by deprivation quintile
Age-standardised death rates were highest in the Death rates were highest in the most deprived
North and lowest in London, the South East and areas and lowest in the least deprived areas.
East of England.
Male | Female Male | Female
Most
North East deprived
North West
West Midlands
Yorkshire & Humber
East Midlands
South West
London
South East
Least
East of England deprived
30 20 10 0 10 20 30
40 30 20 10 0 10 20 30 40
Rate per 100,000 population Rate per 100,000 population
For more information: Alcohol-specific deaths in England: registered in 2016 – Office for National Statistics
16Part 3: Alcohol-related prescriptions
This section presents information on the number of The two main drugs prescribed for the treatment of
prescriptions for drugs used to treat alcohol alcohol dependence are Acamprosate Calcium
dependence and the Net Ingredient Cost (NIC) of (Campral) and Disulfiram (Antabuse). In May 2013
these prescriptions. The data source is Prescription a new drug Nalmefene (Selincro) was launched.
Analysis and Cost (PACT) data from NHS Naltrexone is also prescribed for alcohol
Prescription Services which is collected by NHS dependence. It is not included here however, as it
Digital. can also be used to treat drug dependence and the
The number of prescriptions is not the same as the condition that Naltrexone is prescribed to treat is
volume of drugs prescribed. There will also be not available within the PACT data.
different practice locally on the duration of supply
for a prescription.
The NIC is the basic cost of a drug as listed in the
Drug Tariff or price lists; it does not include
discounts, dispensing costs, prescription charges
or fees.
17Alcohol-related prescription items
Total prescription items dispensed – last 10 years
Thousands
200 Total The number of prescription items
Acamprosate Calcium dispensed in England in 2017 was 173
150
thousand which was 8% lower than the
100 188 thousand prescription items in 2016
Disulfiram
but 41% higher than 2007.
50
This is the second successive year on
Nalmefene
0 year decrease.
2007 2008 2009 2010 2011 2012 2013 2014 2015 2016 2017
Type of prescription items dispensed
135 thousand items of Acamprosate Calcium were dispensed in 2017 which is similar to 2016 but 78%
higher than the number dispensed ten years ago.
36 thousand items of Disulfiram were dispensed in 2017 which is 28% lower than 2016. The peak was 61
thousand in 2012.
2,500 items of Nalmefene (introduced in 2013) were dispensed in 2017 which is 26% lower than 2016.
For more information: Table 1, Statistics on Alcohol, England, 2018
18
Prescription Analysis and Cost (PACT) data, 2017Alcohol-related prescription items
Prescription items dispensed by region Prescription items dispensed by CCG, per
North of England dispensed 75 thousand 100,000 population
prescription items (44% of all items). Salford dispensed
London dispensed the lowest number of items the highest number
(17 thousand). of items (1,403 per
100,000).
North of Horsham and Mid
England
Sussex dispensed
Midlands
and East of
the lowest number
England of items (24 per
South of 100,000).
England
London
0 25 50 75 100
Thousands
For more information: Table 2, Statistics on Alcohol, England, 2018
Prescription Analysis and Cost (PACT) data, 2017 19Cost of alcohol-related prescription items
Total cost of prescription items dispensed The total Net Ingredient Cost (NIC)1 for items
Millions (£)
5
Total prescribed for alcohol dependence in 2017
was £4.42 million.
4
This is 9% lower than in 2016 and breaks the
3 Acamprosate Calcium recent trend of successive year on year
2 increases.
Disulfiram
The decrease in cost has been mainly driven
1
Nalmefene by reduced prescription items for Disulfiram.
0
2006 2007 2008 2009 2010 2011 2012 2013 2014 2015 2016 2017
Average NIC per item Total
The average NIC per item for all Nalmefene
pharmacotherapy items was £26. Disulfiram
The average per item was £20 for Acamprosate Acamprosate
Calcium
Calcium, £44 for Disulfiram (up from £22 in 0 10 20 30 40 50 60
2015) and £55 for Nalmefene. (£)
1. The Net Ingredient Cost NIC is the basic cost of a drug as listed in the Drug Tariff or price lists; it does not include discounts, prescription charges or fees.
For more information: Table 1, Statistics on Alcohol, England, 2018 20
Prescription Analysis and Cost (PACT) data, 2017Part 4: Drinking behaviours among adults
This section presents a range of information on Information is also summarised from the Health
drinking behaviours among adults including drinking Survey for England (HSE) which is published by
prevalence, consumption and trends among NHS Digital and has been carried out since 1994.
different groups of society and geographical areas. The survey is designed to measure health and
The main source of data for drinking behaviours health-related behaviours in adults and children in
among adults is the Opinions and Lifestyle Survey England.
(OPN): Drinking Habits Amongst Adults carried out Adult substance misuse statistics from the National
by the Office for National Statistics. This is an Drug Treatment Monitoring System (NDTMS)
annual survey covering adults aged 16 and over provides information on the number of people
living in private households in Great Britain, and being treated for alcohol problems.
concerns self-reported consumption on the heaviest Health at a Glance, published by the Organisation
drinking day in the week prior to interview. for Economic Co-operation and Development
Data have been provided for England unless (OECD), provides international comparisons on
otherwise stated. GB data is available from the alcohol consumption.
source publication.
21Drinking prevalence1 for adults2
Drinking prevalence – last 10 years Drinking more than 8/6 units3 by age – last 10
58% of survey respondents reported drinking years
alcohol in the previous week in 2017 which is a fall The proportion drinking more than 8/6 units on their
from 65% in 2007. heaviest drinking day has fallen in the last 10 years
This equates to 25.6 million adults in England. for those aged 16-24 and 25-44. There has been
Those who drank more than 8/6 units3 on their little change for those aged 45-64 and 65 and over.
heaviest day in the last week fell from 20% to Percent
15%. 40
Percent
80
30 16-24
Drank alcohol in the last week
60
25-44
20
40 45-64
Drank more than 8/6 uinits2 on heaviest
10
20
drinking day in the last week 65 and over
0
0
1. The proportions are for all respondents. See source data for these proportions expressed as a percentage of those who had drunk in the last week.
2. Adults have been defined as persons aged 16 and over. 3. More than 8 units for men and more than 6 units for women. 22
For more information: Opinions and Lifestyle Survey: Adult drinking habits 2017Drinking prevalence1 for adults2
Drinking more than 8/6 units2 on heaviest drinking Drinking more than 8/6 units2 on heaviest
day in the last week by sex and age drinking day, by region and country
The proportion of men drinking more than 8/6 units was A higher proportion
similar by age apart from 65 and over where it was of drinkers in
significantly lower. For women the proportion northern regions
decreased with age. drank at least 8/6
Male | Female
units in one day on
their heaviest
16 to 24
drinking day of the
25 to 44 previous week.
45 to 64
65+
All 16+
30 20 10 0 10 20 30
Percent
1. The proportions are for all respondents. See source data for these proportions expressed as a percentage of those who had drunk in the last week.
2. Adults have been defined as persons aged 16 and over. 3. More than 8 units for men and more than 6 units for women. 23
For more information: Opinions and Lifestyle Survey: Adult drinking habits 2017Drinking prevalence for adults1
Type of drink amongst those drinking more Drinking by annual income
than 8/6 units2 Higher earners were more likely to drink alcohol.
Normal strength beer was the most popular choice 79% of those earning over £40,000 drank alcohol
for men, while wine (including champagne) was in the last week compared to 47% of those earning
most popular with women on the heaviest drinking up to £9,999.
day in the week before interview3.
Male | Female
Normal strength beer / Up to £9,999
stout / lager / cider
£10,000 up to £14,999
Wine / champagne
£15,000 up to £19,999
Spirits or liqueurs
Strong beer / £20,000 up to £29,999
stout / lager / cider
£30,000 upto £39,999
Alcopops
Sherry or martini £40,000 or more
90 60 30 0 30 60 90 0 25 50 75 100
Percent Percent
1. Adults have been defined as persons aged 16 and over. 3. Respondents could choose more than one drink.
2. “More than 8/6 units” means more than 8 units for men and more than 6 units for women. 24
For more information: Opinions and Lifestyle Survey: Adult drinking habits 2017Drinking prevalence for adults1
Weekly consumption by gender Weekly consumption by age
31% of men and 16% of women drank at a level Those aged 55-64 were the most likely to be
indicating increased or higher risk of harm (more drinking at higher or increasing risk levels2.
than 14 units per week). Younger and older adults were the most likely
to be non-drinkers.
Male | Female Percent Non drinker Low risk Increasing risk Higher risk
100
Non drinker/did not drink in last 12
months
Up to 14 units per week 80
More than 14, up to 21 60
More than 21, up to 35
40
More than 35, up to 50
20
More than 50 units
0
60 40 20 0 20 40 60 16-24 25-34 35-44 45-54 55-64 65-74 75+
Percent
1. Adults have been defined as persons aged 16 and over. 2. Low risk = up to 14 units, increasing risk = more than 14 and up to 35 for
25
For more information: Health Survey for England, 2016 women and 50 for men, higher risk = over 35 for women and over 50 for men.Drinking prevalence for adults – international comparisons
UK alcohol consumption has decreased between 2000 and 2015. Lithuania and Belgium have the
highest alcohol consumption.
Litres per capita (15 years +) Most recent (2013-2016) 2000
16
14
12
10
8
6
4
2
0
1. Uses most recently available annual figure during the period 2013 to 2016. UK data is for 2015. More details are available in the source data.
2. Organisation for Economic Co-operation and Development Health Statistics. 26
For more information: Organisation for Economic Co-Operation and Development.Adult substance misuse
Numbers in treatment for alcohol problems – last 10 years
Thousands
100
Alcohol only
In 2016/17, 80 thousand were treated for
80
problematic drinking alone which was a
60
5% decrease on the previous year.
40
28 thousand were treated for non-opiate
Non-opiate and alcohol
and alcohol problems.
20
The 2016/17 report presents further
0 analyses of these two groups.
For more information: Adult substance misuse statistics from the National Drug Treatment Monitoring System (NDTMS), 2016-2017
27Part 5: Drinking behaviours among children
This section presents a range of information on The question used in SDD to establish whether a
drinking behaviours among children including pupil had drunk alcohol changed in 2016 to
drinking prevalence, consumption, age of first improve the estimate of drinking prevalence.
alcoholic drink, prevalence and frequency of However the new estimate is not comparable with
drunkenness, and consequences of drinking. This previous surveys. More information is available in
information has been taken from two NHS Digital the appendices of the SDD report.
publications. Information is also summarised from What About
Information is provided from Smoking, Drinking and YOUth? (WAY) which surveyed 15 year olds with
Drug use among Young People in England (SDD) questions about their health, diet, exercise,
which surveys pupils in secondary schools across bullying, alcohol, drugs and smoking.
England to provide national estimates and The SDD survey is completed at school in exam
information on the smoking, drinking and drug use conditions without the involvement of parents or
behaviours of young people aged 11 - 15. teachers, but WAY is completed at home and
therefore could involve parents. This will affect
comparability between the two surveys as children
are less likely to admit to risky behaviours when
completing surveys in the home environment.
28Drinking prevalence1
Ever had an alcoholic drink, by year Ever had an alcoholic drink, by sex and age
Between 2003 and 2014 there was a decline in the 46% of girls and 43% of
proportion of pupils who had ever drunk an alcoholic boys said they had ever 43% 46%
drink. had a drink3.
In 2016, 44% of pupils said they had ever drunk an Whether a pupil had drunk alcohol was related to their
alcoholic drink2. Data prior to 2016 is not comparable age, increasing from 15% of 11 year olds to 73% of 15
due to a change in the survey question. year olds.
Percent Old question New question
80
Mar 2012: Alcohol strategy 11 years
aims to reduce no. of 11-15
year old drinkers
60 12 years
40 13 years
14 years
20 Dec 2009: First official April 2014: Ban on
guidance on alcohol aimed at the sale of alcohol
children and young people at below cost price 15 years
0
0 20 40 60 80
Percent
1) In 2016 the question used to establish whether a pupil had drunk alcohol changed making the results of the 2016 survey not comparable with previous years. See appendix A (page 5)
of the source publication for further details. 2) This is an estimate and subject to a margin of error: the proportion in the population is likely to be somewhere between 41% and 47%.
3) Not a statistically significant difference.
For more information: Tables 6.1 and 6.2, Chapter 6, Smoking, drinking and drug use among young people, 2016 29Drinking in the last week1
When pupils drink How much pupils drink (mean units)2, by age
Pupils were most likely to drink at weekends. Pupils who drank alcohol in the last week consumed
Of pupils who had drunk in the last week, 68% drank an average (mean) of 9.6 units that week3.
on Saturday, 42% drank on Friday, and 28% drank on Mean consumption was lowest among 11 to 13 year
Sunday. On other days of the week, between 5% and olds (6.9 units), and highest among 14 year olds (11.1
7% of pupils drank. units).
Monday
11-13 years
Tuesday
Wednesday
14 years
Thursday
Friday 15 years
Saturday
Sunday Total (11-15)
0 20 40 60 80
Percent
0 3 6 9 12
Mean units in last week
1) Based only on pupils who said they had a drink in the last week (10% of all pupils) 2) Quantities of alcohol were converted into units of alcohol, using a standard method described
in Appendix B6 (page 25) of the source publication. 3) This is an estimate and subject to a margin of error: the proportion in the population is likely to be somewhere between 8.7 and
10.5. For more information: Tables 6.11 and 6.12, Chapter 6, Smoking, drinking and drug use among young people, 2016 30Prevalence of drunkenness
Pupils who were drunk in the last four weeks, Pupils who were drunk in the last four weeks,
by sex by age
9% of pupils said they had been drunk in the last four The proportion of pupils who reported having been
weeks, including 7% of pupils who had been drunk drunk in the last four weeks increased with age.
once or twice, and 2% more often. 23% of 15 year olds reported having been drunk in the
Girls (11%) were more likely to have been drunk in the last four weeks.
last four weeks than boys (7%).
Been drunk once or twice
Been drunk once or twice Been drunk 3+ times
11 years Been drunk 3+ times
Boys 12 years
13 years
Girls
14 years
Total
15 years
0 3 6 9 12 0 10 20 30
Percent Percent
For more information: Tables 6.21 and 6.22, Chapter 6, Smoking, drinking and drug use among young people, 2016
31Where pupils get alcohol
How obtained alcohol in the last four weeks1 Where current drinkers usually buy alcohol
Of pupils who obtained alcohol in the last four weeks, Current drinkers were most likely to buy it from friends
the most common sources were to be given it by or relatives (22%), someone else (16%), an off-licence
parents or guardians (70%), given it by friends (54%), (10%) or a shop or supermarket (8%).
or to take it from home with permission (41%). 61% of current drinkers said they never buy alcohol.
Given by parents
Friend/relative
Given by friends
Taken from home Someone else
Bought by someone else
Off-licence
Given by other relatives
Taken from friend’s home Shop or supermarket
Given by other people
Given by siblings Pub or bar
Stolen from home
Club or disco
Bought from shop
Stolen from somewhere else Off the street
Stolen from friend’s home
Bought from pub Garage forecourt
0 20 40 60 80 0 10 20 30
Percent Percent
1) Based on pupils who obtained alcohol in the last four weeks. Pupils could give more than one answer.
For more information: Tables 7.2 to 7.5, Chapter 7, Smoking, drinking and drug use among young people, 2016 32Pupils’ attitudes towards drinking
Attitudes to drinking by people of pupils’ age, by year
Pupils’ attitudes towards someone of their age drinking or getting drunk have become less tolerant.
In 2016, 50% agreed that it was ok to try Percent OK to try drinking alcohol to see what it's like
alcohol to see what it’s like, down from 80 OK to drink alcohol once a week
67% in 2003. OK to try getting drunk to see what it's like
OK to get drunk once a week
25% said it was OK to drink alcohol once
60
a week, down from 46% in 2003.
40
Getting drunk was seen as less
acceptable than drinking.
In 2016, 19% said it was OK to try getting 20
drunk to see what it was like, down from
31% in 2003.
0
Only 7% thought it was OK to get drunk
once a week, down from 20% in 2003.
For more information: Tables 8.9 to 8.12, Chapter 8, Smoking, drinking and drug use among young people, 2016
33Alcohol consumption by other household members
When last drank alcohol, by number of people who drink alcohol that pupil lives with
Drank alcohol in the last week
Has drunk alcohol but not in the last week
Pupils who lived with people who drank Never drunk alcohol
alcohol were more likely to drink alcohol
themselves. Lives with no drinkers
Only 3% of pupils who lived with only non-
drinkers had drunk alcohol in the last week,
Lives with one drinker
and 79% had never drunk alcohol.
Among pupils who lived with three or more
people who drank, the proportion who had Lives with two drinkers
drunk alcohol in the last week rose to 21%,
whilst the proportion who had never drunk fell Lives with three or more
to 31%. drinkers
0 20 40 60 80 100
Percent
For more information: Table 8.1, Chapter 8, Smoking, drinking and drug use among young people, 2016
34Drinking prevalence for 15 year olds
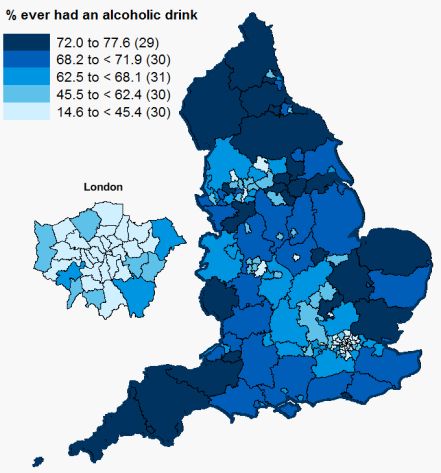
Drinking prevalence by LA Drunkenness by LA
Barnsley District (77.6%), Devon (76.9%) and Brighton and Hove (27.0%), North Tyneside
Cornwall (76.6%) had the highest prevalence of 15 (24.6%) and Richmond upon Thames (24.5%) had
year olds who have ever drunk alcohol. the highest prevalence of drunkenness in the last 4
weeks.
The Borough of Tower Hamlets (14.6%) had the
lowest. Tower Hamlets (2.6%) and Newham (3.1%) had
the lowest.
For more information: Tables 6.13 and 6.36, Chapter 6, WAY Survey 2014
35
What About YOUth? Survey 2014Part 6: Road casualties involving illegal alcohol levels
The Department for Transport publishes Reported A drink-drive accident is defined as one where
road casualties in Great Britain: Estimates for someone is killed or injured, and either one or
accidents involving illegal alcohol levels which more drivers involved either failed a roadside
provides estimates of casualties arising from breath test, refused to give a specimen or died
reported accidents involving at least one motor within 12 hours and was found to have a level of
vehicle driver or rider over the legal alcohol limit for alcohol in their blood.
driving More information on these tests and the
Figures are derived from the STATS19 forms differences in the allowable limits between
completed by the police plus toxicology data for England, Wales and Scotland can be seen in the
road fatalities from coroners and procurators fiscal. source report.
These statistics, especially the number of fatalities,
are subject to considerable uncertainty which means
that it is impossible to be sure of the precise number
of casualties, so ranges and confidence intervals
are used.
36Reported drink-drive accidents – the last 10 years (GB)
Fatalities in reported drink-drive accidents Casualties in reported drink-drive accidents
Provisional estimates for 2016 show that between 200 An estimated 9,050 people were killed or injured when
and 280 people were killed in accidents in Great at least one driver was over the drink-drive limit. This is
Britain where at least one driver was over the drink- 5% of all reported road casualties and is the highest
drive limit, with a central estimate of 240 deaths. This number since 2012.
is 13% of all deaths in reported road accidents.
16,000
600
14,000
500 12,000
400 10,000
8,000
300
6,000
200
4,000
100
2,000
0 0
2006 2007 2008 2009 2010 2011 2012 2013 2014 2015 2016 2006 2007 2008 2009 2010 2011 2012 2013 2014 2015 2016
1. Provisional central estimates. Final 2016 estimates, based on more complete data, will be published in August 2018.
For more information: Reported road casualties in Great Britain: Estimates for accidents involving illegal alcohol levels: 2016 (provisional)
37Part 7: Expenditure and affordability
Information on purchases and expenditure on alcohol have been taken from Family Food which is
published by Department for Environment, Food & Rural Affairs (DEFRA), and is based on data collected
by the Living Costs and Food Survey.
The affordability of alcohol uses information on alcohol price and retail price indices taken from the ONS
publication: Focus on Consumer Price Indices and households’ disposable income data published by
ONS in the Economic and Labour Market Review.
38Purchases and expenditure on alcohol
£43 per person was spent on food and drink (including alcoholic drinks and food eaten out) per week in
2016/17 in the UK. Taking inflation into account, this was 1.1% more than 2015, and 0.1% more than
2013.
Total expenditure
£43.18
Household Eating out
£29.71 £13.48
Food and
Alcohol
Alcohol
£3.36
£3.07
Food and drink
drink
£26.34
£10.40
In real terms, between 2013 and 2016/17 spending on all household food and drink fell by 0.5% and
eating out expenditure rose by 9.4%. Household spending on alcoholic drinks rose by 2.8% over the
same period, and that bought for consumption outside the home also rose by 1.7%.
1. ‘Household’ covers all food that is brought into the household. ‘Eating out’ covers all food that never enters the household.
2. There is a range of evidence to suggest that self reported alcohol consumption in surveys is less than actual consumption. 39
For more information: Department of Environment, Food and Rural Affairs (DEFRA): Family FoodPurchases and expenditure on alcohol
Alcohol intake rose 7.7% in 2016/17 to 9.7 grams of alcohol per person per day. Eating out purchases
accounted for 28% of total alcohol intake in 2016/17.
In 2016/17, eating out intakes of alcohol were 38% higher than in 2013 and up until 2014 showed a
significant downward trend.
Alcohol intake from eating out purchases declined 35% between 2001-02 and 2016/17.
grams of alcohol per person per day
Household
8
6
4
2
Eating out
0
For more information: Department of Environment, Food and Rural Affairs (DEFRA): Family Food 40Affordability of alcohol1
Long term trend Alcohol affordability index
170
In the UK since 150
1980 alcohol
has become 130
64% more
110
affordable. 1980 = base year
90
Last ten years (2007 to 2017)
Over the last ten years the price of alcohol has increased by 33%2.
The price of alcohol increased by 0.8%3 relative to retail prices, whilst real disposable income per adult
increased by 1.9% over the same period.
As a result, alcohol has become 1.1% more affordable since 20074.
1) For more information see Appendix B: Technical Notes 2) Based on Alcohol Price Index
3) Based on Alcohol Price Index Relative to Retail Price Index (all items) 4) Based on Affordability of Alcohol Index 41
For more information: Table 4 of Statistics on Alcohol, England, 2018Expenditure on off-trade1 alcohol purchases
Expenditure on alcohol compared to total expenditure2
Percent
UK household expenditure on alcohol has Billions Household expenditure on alcohol
20 5
more than doubled to £19.9 billion in 2017,
16 4
from £9.3 billion in 1985.
12 3
However, alcohol expenditure as a 8 2
proportion of total household expenditure 4
Expenditure as a percent of total household
1
expenditure
has fallen to 1.5% over the same period, 0 0
from 3.8% in 1985.
Average weekly expenditure on alcohol3
£ per week
Average weekly household expenditure on alcohol 12
was £8.20 in 2016/17. 9
People in the 50-64 age group spent the most, with 6
an average of £11.00 a week.
3
The lowest weekly expenditure was by those aged
0
under 30 and 75+ with an average of £5.00. Under 30 30-49 50-64 65-74 75 and over
1. Includes purchases at supermarkets, off licences etc. Excludes purchases in pubs, bars, restaurants etc.
2. Current Prices 3. Across all households. 42
For more information: Table 5 Statistics on Alcohol, England, 2018 , Detailed household expenditure: Table A11Provide feedback
We would welcome feedback from users on the content and style of this report.
Please send your feedback to enquiries@nhsdigital.nhs.uk and quote “Feedback on Statistics on Alcohol
Report” in the subject heading.
43Author: Stats Team, NHS Digital Responsible Statistician: Paul Niblett This publication may be requested in large print or other formats. Published by NHS Digital, part of the Government Statistical Service Copyright © 2018 Health and Social Care Information Centre. The Health and Social Care Information Centre is a non-departmental body created by statute, also known as NHS Digital. You may re-use this document/publication (not including logos) free of charge in any format or medium, under the terms of the Open Government Licence v3.0. To view this licence visit www.nationalarchives.gov.uk/doc/open-government-licence or write to the Information Policy Team, The National Archives, Kew, Richmond, Surrey, TW9 4DU; or email: psi@nationalarchives.gsi.gov.uk
www.digital.nhs.uk
  @nhsdigital
enquiries@nhsdigital.nhs.uk
0300 303 5678
You can also read