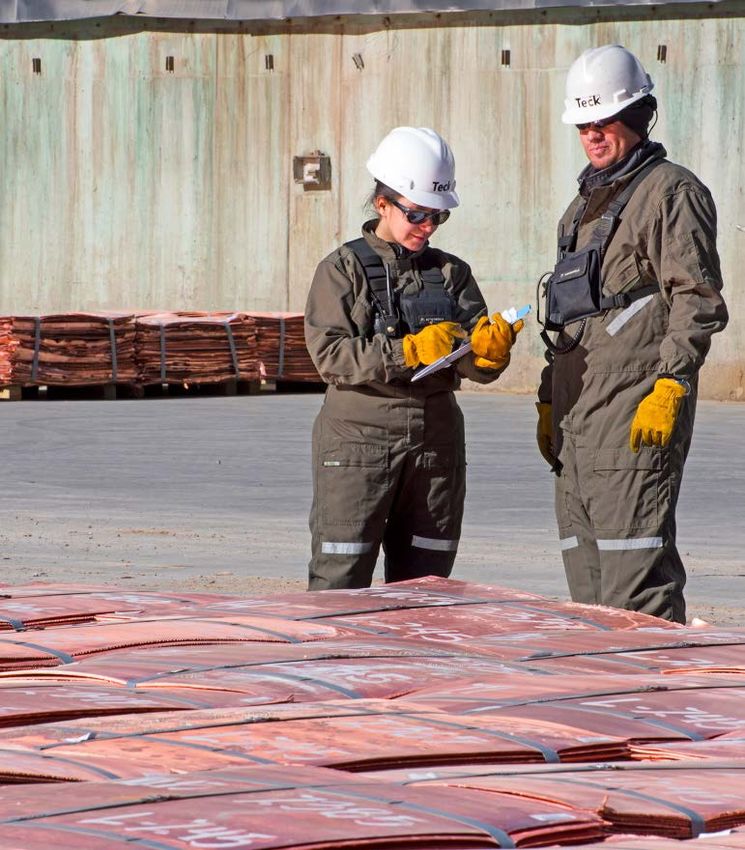
Base Metals Markets April 3, 2019 Andrew Stonkus, Senior Vice President, Marketing and Logistics - Teck Resources Limited
←
→
Page content transcription
If your browser does not render page correctly, please read the page content below

Base Metals Markets April 3, 2019 Andrew Stonkus, Senior Vice President, Marketing and Logistics
Caution Regarding Forward-Looking Statements
Both these slides and the accompanying oral presentations contain certain forward-looking statements within the meaning of the United States Private Securities
Litigation Reform Act of 1995 and forward-looking information within the meaning of the Securities Act (Ontario) and comparable legislation in other provinces
(collectively referred to herein as forward-looking statements). Forward-looking statements can be identified by the use of words such as “plans”, “expects” or “does
not expect”, “is expected”, “budget”, “scheduled”, “estimates”, “forecasts”, “intends”, “anticipates” or “does not anticipate”, or “believes”, or variation of such words
and phrases or state that certain actions, events or results “may”, “could”, “should”, “would”, “might” or “will” be taken, occur or be achieved. Forward-looking
statements involve known and unknown risks, uncertainties and other factors which may cause the actual results, performance or achievements of Teck to be
materially different from any future results, performance or achievements expressed or implied by the forward-looking statements. These forward-looking
statements include statements relating to expectations regarding copper and zinc supply and demand; forecast global copper production; expectations with respect
to new mine production and scrap availability; Chinese copper demand expectations and smelter capacity; global trends enhancing copper demand; expectations
with respect to the zinc market and forecast Chinese zinc demand, Chinese zinc mine production and expected constraints and depletion; and expectations relating
to future global zinc mine production and inventories.
These forward-looking statements involve numerous assumptions, risks and uncertainties and actual results may vary materially. These statements are based on a
number of assumptions, including, but not limited to, assumptions regarding general business and economic conditions, interest rates, the supply and demand for,
inventories and deliveries of, and the level and volatility of prices of our base metals, the timing of the receipt of regulatory and governmental approvals for our
development projects and other operations, acts of foreign or domestic governments, our production and productivity levels, as well as those of our competitors, the
timing of development of our competitors’ projects, market competition, conditions in financial markets, the future financial performance of the company, and our
ongoing relations with our employees and business partners and joint venturers. Assumptions are also included in the footnotes to various slides. The foregoing list
of assumptions is not exhaustive.
Factors that may cause actual results to vary materially include, but are not limited to, changes in commodity and power prices, changes in market demand for our
products, changes in interest and currency exchange rates, acts of domestic or foreign governments and the outcome of legal proceedings, changes in the financial
market in general, unanticipated increases in costs to construct our or our competitors’ development projects, changes in tax benefits or tax rates, and changes or
deterioration in general economic conditions. We assume no obligation to update forward-looking statements except as required under securities laws. Further
information concerning assumptions, risks and uncertainties associated with these forward-looking statements and our business can be found in our most recent
Annual Information Form, as well as our management’s discussion and analysis of quarterly results and other subsequent filings, all filed under our profile on
SEDAR (www.sedar.com) and on EDGAR (www.sec.gov).
Scientific and technical information regarding our material mining projects in this presentation was approved by Mr. Rodrigo Alves Marinho, P.Geo., an employee of
Teck. Mr. Marinho is a qualified person, as defined under National Instrument (NI) 43-101.

 2

BASE METALS
Copper Market Highlights
•       Reported copper cathode stocks have fallen to
        historically low levels
•       Despite recent announced mine supply increases,
        medium-to-long-term market still in structural
        deficit
•       Environmental restrictions on global scrap flows
        are impacting copper unit availability, increasing
        demand for concentrates & cathodes
•       Even at low demand growth rates, market still in
        deficit to 2025
•       Global trends positive for long term copper
        demand

    3
Copper Supply                                                                                                          BASE METALS

Mine production rising and scrap availability falling
Sanctioned Projects Since 20171                                         China Copper Scrap Imports Decline2
(Thousand tonnes)                                                       (Copper content, kt)
                                                                        2,000
2,500
                                                                        1,500
2,000
                                                                        1,000

1,500                                                                    500

1,000                                                                      0
                                                                                 2013    2014     2015       2016      2017     2018
 500
                                                                        Chinese Imports Shift to Concentrates3
                                                                        (Copper content, kt)
     0
         2017   2018   2019   2020   2021   2022   2023   2024   2025   10,000

         Pumpkin Hollow       Spence               Mirador               8,000
         Dikuluwe             OT UG                Sierrita              6,000
         Lone Star            Aktogay              Anto Exp
                                                                         4,000
                                                                         2,000
New mines commissioned will add                                             0
                                                                                 2013     2014    2015       2016      2017     2018
2.3 million tonnes from 2017-2025.                                                 Concentrates    Blister     Scrap      Cathode

 4
Copper Metal Stocks                                                                                                     BASE METALS

  Better than expected demand; smelter disruptions
  Daily Copper Prices & Stocks1.2
  (US$/mt)
                                                                                    • Production cuts at Asian smelters combined with
           12,000                                            1,800
                                                                                      lower scrap availability has contributed to a
                                                                                      drawdown in cathode
                                                             1,600
           10,000
                                                             1,400                  • Exchange stocks have fallen 425,000 tonnes
               8,000                                         1,200
                                                                                      since March 2018, equivalent to just over 1

                                                                     Thousands Mt
                                                                                      week’s global consumption.
US$ / Mt

                                                             1,000
               6,000
                                                             800                    • In mid-March stocks reached lowest level since
               4,000                                         600
                                                                                      late 2014. Including bonded stocks, lowest since
                                                                                      2009
                                                             400
               2,000
                                                             200                    • Stocks are building in China, however in
                  0                                          0
                                                                                      Q2 2019, several large planned smelter
                                                                                      maintenance shutdowns will occur

               LME Stocks   Comex   SHFE   Bonded Estimate           Price

           5
Copper Supply / Demand Balance                                                                                                   BASE METALS

Projects available to fill low demand scenario gap

Existing and Fully Committed Supply1                                                           Probable Projects Sufficient
(Thousand tonnes)                                                                              Only to Fill Low Gap Scenario2
 28,000                                                                                        (Thousand tonnes)
                                                                                       3,500
 27,000
                                                                                       3,000
 26,000                                                                                                                                    Gap to

                                                                   Metal Requirement
                                                                                       2,500                                                high
 25,000                                                                                                                                     case
                                                                                       2,000
 24,000                                                                                                                                    Gap to
                                                                                       1,500                                                base
 23,000                                                                                                                                     case
                                                                                       1,000
 22,000                                                                                                                                     Gap
                                                                                        500                                                to low
 21,000                                                                                                                                     case
           2019      2020       2021   2022     2023        2024                          0
           Refined Production                 Base Demand                                      2019   2020   2021    2022    2023   2024
           Low Demand                         High Demand                                               Brownfield Probable
                                                                                                        Greenfield Probable
 Assumed average growth to 2024:                                                                        SXEW Projects
 • High Demand (2.7%): 3.1 million tonne gap                                                            Unannounced Extensions
 • Base Demand (2.0%): 2.0 million tonne gap
 • Low Demand (1.5%): 1.0 million tonne gap

 6
BASE METALS
 Zinc Market Highlights
• Large drawdowns of refined zinc exchange stocks, bringing
  exchange inventory to critical levels
• Global concentrate market moved to surplus due to
  decreased refined production in China and rest of world
• Environmental policy and poor profit margins limited buying
  by Chinese smelters in 2018
• Zinc market is currently estimated to be moving into a
  smelter bottleneck in 2019, with concentrate surpluses and
  continued refined deficits
• Reduced mine guidance, flooding in Queensland, and
  environmental restrictions on small mines in China is putting
  the concentrate surplus at risk
• Additional mine and smelter production needed to satisfy
  the zinc market or risk demand destruction

  7
Zinc Supply                                                                                                                 BASE METALS

Mine Production Missed forecast in 2018
Zinc Mine Production1                                             • Teck originally forecast global mine production would grow 7.9% or
(Thousand tonnes contained)                                         over 800,000 tonnes in 2018
16,000                                                                 ‒   Due to start up of large mines, Dugald River, Gamsberg, New
                                                                           Century and restarts by Glencore
14,000
                                                                  • Global mine production in 2018 missed Teck’s forecast by almost
12,000                                                              600,000 tonnes
                                                                       ‒   Slow or delayed start-ups at New Century, Gamsberg, and several
10,000
                                                                           smaller mines
                                                                       ‒   China originally expected to increase 250,000 tonnes contained in
 8,000
                                                                           2018, but now estimated to be down 150,000 tonnes contained in
                                                                           2018
 6,000

 4,000                                                            • Today, Teck forecasts an 8.1% increase in mine production in 2019,
                                                                    but significant risks continue
 2,000                                                                 ‒   Mine guidance has already decreased around 120 thousand
                                                                           tonnes in Q1 2019
     0                                                                 ‒   Queensland flooding has put several large operations there at risk
          2017   2018     2019    2020    2021    2022   2023              of meeting 2019 guidance
         ROW Others     China         Glencore     Dugald River        ‒   Chinese environmental inspections continue at domestic mines
         Gamsberg       New Century   New Mines
                                                                           and may restrict production into H2 2019

 8
Chinese Zinc Mine Projects Delayed                                                                             BASE METALS

Impacted by inspections and low zinc ore grades
Estimated Chinese Zinc Mine Growth Rarely Achieved1                     Chinese Mine Growth 2019-2021 Heavily Dependent
(Thousand tonnes contained)                                             On Single Project2
                                                                        (Thousand tonnes contained)
600                                                                     600

                                                                        400
400
         360      350                                                   200
                            270              300
                                                      250        237
200               200                 180                                 0
         100                                                     128
                                      60
     0
                                             -50

-200
                                                      -150              Zinc Ore Grades Falling at Chinese Mines3
                                                                        (Ore grade, zinc %)
-400
                                                                        Ore
                                                                        4.0 Grade, Zinc %
                                                                        3.9
                                                                        3.8
-600                                                                    3.7
                            -630
                                                                        3.6
-800                                                                    3.5
         2013     2014      2015      2016   2017    2018        2019   3.4

                Early-year estimate          Adjusted estimate

 9
Zinc Metal Stocks BASE METALS
Consecutive deficits decreasing zinc inventories
Daily Zinc Prices & Stocks1.2
(US$/lb)
• Deficits in past 5 years have driven down
stocks
$5,000 2,500 • LME refined zinc stocks have decreased
$4,500 70,000 tonnes year-to-date in 2019
$4,000 2,000 • Less than 60,000 tonnes of refined zinc
$3,500 remaining on LME
• SHFE stocks have increased 95,000 tonnes
Thousands Mt
$3,000 1,500
US$D / Mt
$2,500
year-to-date in 2019
• Decreased Chinese refined production is
$2,000 1,000
increasing demand for refined imports into
$1,500
China
$1,000 500
• Smelter cuts announced in Q1 2019:
$500 ‒ Elektrozinc Russia (80,000 tonnes): permanently
closed due to safety infractions following a fire at the
$0 0
smelter
2006
2007
2008
2009
2010
2011
2012
2013
2014
2015
2016
2017
2018
2019
‒ Skorpion: closing for 5 weeks, strike at mine reduces
oxide stockpiles
LME Stocks Bonded SHFE Price ‒ Queensland Townsville zinc smelter: at risk due to
flooded rail lines
10Zinc Supply/Demand Balance BASE METALS
Zinc mine production peaks in 2021
Existing and Fully Committed Supply1 Probable Projects
(Thousand tonnes) Sufficient to Fill Gap2
17,000 (Thousand tonnes)
2,500
16,000
Gap to
2,000
high
Metal Requirement
15,000 demand
1,500 Gap to
base
14,000 demand
1,000
13,000 Gap to
500 low
2019 2020 2021 2022 2023 2024
demand
Refined Production Base Demand 0
Low Demand High Demand 2019 2020 2021 2022 2023 2024
Assumed average growth to 2024: Greenfield Brownfield/Restart
• High Demand (2.0%): 2.0 million tonne gap
• Base Demand (1.6%): 1.7 million tonne gap
• Low Demand (1.2%): 1.0 million tonne gap
11Appendix
Notes: Base Metals Markets
Slide 4: Copper Supply
1. Source: Wood Mackenzie, Teck, Company Reports. Announced Project Sanctioning Decisions since January 2018, Based on Corporate Guidance and/or Wood Mac forecasts to Q4 2018.
2. Source: Wood Mackenzie, GTIS, SMM.
3. Source: Wood Mackenzie, GTIS, NBS, SMM.
Slide 5: Copper Metal Stocks
1. Source: LME, Comex, SHFE, SMM
Slide 6: Copper Supply / Demand Balance
1. Source: Wood Mackenzie, CRU, ICA, Yale, Teck. Low Demand based on Wood Mackenzie forecast demand outlook. Base Case Demand based on Teck copper demand model. High Demand based on
    combination of ICA study done for long term Copper Demand and a Yale University study done based on IEA forecasts for 2DS on Climate reduction goals.
2. Source: Wood Mackenzie, CRU, ICA, Yale, Teck. Forecasts based on projects from Wood Mackenzie Probable list of projects from Q4 2018 flexed at their historic rates of probable projects entering
    production (70% of Probable Brownfields, 50% of Probable Greenfield projects and an allowance for unidentified mine extensions based on historic precedent that 20% of capacity projected to close will stay
    open through such extensions).
Slide 8: Zinc Supply
1. Source: Teck, Wood Mackenzie, company reports.
Slide 9: Chinese Zinc Mine Projects Delayed
1. Source: Antaike, BGRIMM, Teck. Early Year Estimates from consolidation of several Analyst views in the year preceding.
2. Source: Antaike, BGRIMM, Teck.
3. Source: CNIA, NBS.
Slide 10: Zinc Metal Stocks
1. Source: LME, SHFE, SMM, CRU.
2. Source: LME, Fastmarkets, Argus, Acuity, company reports.
Slide 11: Zinc Supply / Demand
1. Source: Wood Mackenzie, CRU, Teck. Low Demand based on CRU, Base Case Demand based on Teck Zinc demand model. High Demand based long term historical averages and view on improved
    Trade Outlook flexed into Base Demand Model.
2. Source: Wood Mackenzie, CRU, Teck. Forecasts based on projects from Wood Mackenzie Probable list of projects from Q4 2018 flexed at their historic rates of probable projects entering production (only
    50% – 60% of probable zinc projects and zinc mine life extensions historically are brought to market).

  13
Steelmaking Coal Markets April 3, 2019 Réal Foley, Vice President, Marketing, Coal and Base Metals
Caution Regarding Forward-Looking Statements
Both these slides and the accompanying oral presentations contain certain forward-looking statements within the meaning of the United States Private Securities Litigation Reform Act of 1995 and forward-looking information within the meaning
of the Securities Act (Ontario) and comparable legislation in other provinces (collectively referred to herein as forward-looking statements). Forward-looking statements can be identified by the use of words such as “plans”, “expects” or “does not
expect”, “is expected”, “budget”, “scheduled”, “estimates”, “forecasts”, “intends”, “anticipates” or “does not anticipate”, or “believes”, or variation of such words and phrases or state that certain actions, events or results “may”, “could”, “should”,
“would”, “might” or “will” be taken, occur or be achieved. Forward-looking statements involve known and unknown risks, uncertainties and other factors which may cause the actual results, performance or achievements of Teck to be materially
different from any future results, performance or achievements expressed or implied by the forward-looking statements. These forward-looking statements include statements relating to management’s expectations with respect to production,
demand and outlook regarding steelmaking coal for Teck and global markets generally, Teck’s strong financial position, the long life and value of our projects and operations, operating cost expectations, steelmaking coal supply and demand
relating to China, India, Southeast Asia, and globally, steelmaking coal pricing, benefits of our marketing and logistics strategy and associated opportunities, all guidance including but not limited to production guidance, sales and unit cost
guidance, capital expenditures guidance, commodity price leverage, timing expectations, expectations regarding the benefits of our innovation strategy and initiatives, our steelmaking coal operating strategy and the benefits of the strategy,
projected capital spending, projected water sustaining capital spending, potential benefits of saturated rock fills, our expectation to maintain 27 Mt of production or grow the business, including our current and future growth potential, and
expectation that will be able to produce approximately 27 Mt per year or more for decades, the expectation that our steelmaking coal projects will have significant free cash flow even at lower prices.

These forward-looking statements involve numerous assumptions, risks and uncertainties and actual results may vary materially. These statements are based on a number of assumptions, including, but not limited to, assumptions regarding
general business and economic conditions, interest rates, the supply and demand for, inventories and deliveries of, and the level and volatility of prices of steelmaking coal, as well as steel, oil, natural gas and petroleum and related products, the
timing of the receipt of regulatory and governmental approvals for our development projects and other operations, our costs of production and production and productivity levels, as well as those of our competitors, power prices, continuing
availability of water and power resources for our operations, market competition, the accuracy of our mineral reserve and resource estimates (including with respect to size, grade and recoverability) and the geological, operational and price
assumptions on which these are based, conditions in financial markets, the future financial performance of the company, our ability to attract and retain skilled staff, our ability to procure equipment and operating supplies, positive results from the
studies on our expansion projects, our coal and other product inventories, our ability to secure adequate transportation for our products, our ability to obtain permits for our operations and expansions, our ongoing relations with our employees
and business partners and joint venturers. Mineral reserve and resource life estimates assume the mine life of longest lived resource in the relevant commodity is achieved, assumes production at planned rates and in some cases development
of as yet undeveloped projects. Assumptions are also included in the footnotes to various slides.

Management’s expectations of mine life are based on the current planned production rates and assume that all mineral reserves and resources described in this presentation are developed. Certain forward-looking statements are based on
assumptions disclosed in footnotes to the relevant slides. Statements regarding future production are based on the assumption of project sanctions and mine production. Payment of dividends is in the discretion of the board of directors. Our Elk
Valley Water Quality Plan statements are based on assumptions regarding the effectiveness of current technology, and that it will perform as expected. The foregoing list of assumptions is not exhaustive.

Factors that may cause actual results to vary materially include, but are not limited to, changes in commodity and power prices, changes in market demand for our products, changes in interest and currency exchange rates, acts of foreign
governments and the outcome of legal proceedings, inaccurate geological and metallurgical assumptions (including with respect to the size, grade and recoverability of mineral reserves and resources), unanticipated operational difficulties
(including failure of plant, equipment or processes to operate in accordance with specifications or expectations, cost escalation, unavailability of materials and equipment, government action or delays in the receipt of government approvals,
industrial disturbances or other job action, adverse weather conditions and unanticipated events related to health, safety and environmental matters), union labour disputes, political risk, social unrest, failure of customers or counterparties
(including but not limited to rail, port and other logistics providers) to perform their contractual obligations, changes in our credit ratings or the financial market in general, unanticipated increases in costs to construct our development projects,
difficulty in obtaining permits or securing transportation for our products, inability to address concerns regarding permits of environmental impact assessments, changes in tax benefits or tax rates, resolution of environmental and other
proceedings or disputes, and changes or deterioration in general economic conditions. We will not achieve the maximum mine lives of our projects, or be able to mine all mineral reserves at our projects, if we do not obtain relevant permits for our
operations. Unanticipated technology or environmental interactions could affect the effectiveness of our Elk Valley Water Quality Plan strategy. Statements concerning future production costs or volumes are based on numerous assumptions of
management regarding operating matters and on assumptions that demand for products develops as anticipated, that customers and other counterparties perform their contractual obligations, that operating and capital plans will not be disrupted
by issues such as mechanical failure, unavailability of parts and supplies, labour disturbances, interruption in transportation or utilities, adverse weather conditions, and that there are no material unanticipated variations in the cost of energy or
supplies.
Statements concerning future production costs or volumes are based on numerous assumptions of management regarding operating matters and on assumptions that demand for products develops as anticipated, that customers and other
counterparties perform their contractual obligations, that operating and capital plans will not be disrupted by issues such as mechanical failure, unavailability of parts and supplies, labour disturbances, interruption in transportation or utilities,
adverse weather conditions, and that there are no material unanticipated variations in the cost of energy or supplies. Statements regarding anticipated steelmaking coal sales volumes and average steelmaking coal prices depend on timely arrival
of vessels and performance of our steelmaking coal-loading facilities, as well as the level of spot pricing sales.
We assume no obligation to update forward-looking statements except as required under securities laws. Further information concerning assumptions, risks and uncertainties associated with these forward-looking statements and our business
can be found in our most recent Annual Information Form, as well as our management’s discussion and analysis of quarterly results and other subsequent filings, all filed under our profile on SEDAR (www.sedar.com) and on EDGAR
(www.sec.gov).

  15
STEELMAKING COAL

Strong Fundamentals in Steelmaking Coal Market

Slower but more sustainable global growth
• Allows economies to grow for longer
• Supports steel demand and pricing

Steel: Healthy industry and growing production
• India: Secular demand supported by brownfield and
  greenfield projects
• Ex. India: Southeast Asia drives growth

Steelmaking coal: Limited supply growth
• Seaborne: Supply disruptions continue, investment
  remains modest, permitting is challenging
• China: Safety checks restrict domestic production
16
Demand Growth Forecast                                                                     STEELMAKING COAL

Growth drivers: Western Europe, India and Southeast Asia
                            Seaborne Steelmaking Coal Imports1
     330                                 (Change 2019 vs. 2018)
                                                                                               314-318
     320                         1                    315          3         2         1
                                             1
            310       4
     310
Mt

     300

     290

     280
           2018    W. Europe S.E. Asia    Others    2019, ex.     India   E. Europe   China     2019
                                                     India, E
                                                    Europe &
Includes:                                             China
• Western Europe: Growth mostly from Italy,         • Eastern Europe: Analyst views on Ukraine and
  France, Turkey, Germany                             Poland ranging from -3 Mt to +1 Mt3
• Southeast Asia: Growth mostly from Vietnam        • China: Analyst views ranging from -1 Mt to -2 Mt3
• India: Analyst views ranging from +2 Mt to +4 Mt2
17
Supply Growth Forecast STEELMAKING COAL
Most growth comes from Australia
Seaborne Steelmaking Coal Exports1
330 (Change 2019 vs. 2018)
1 4
320 6 1 1 318 312-318
310
310
Mt
300
290
280
2018 Australia Mozambique Canada 2019, ex. Indonesia USA 2019
Indonesia &
USA
Includes:
• Australia: Growth from existing mines (Caval • Canada: Restarted mines ramp up
Ridge/Peak Downs, Grosvenor, Appin, Byerwen) • Indonesia: Analyst views ranging from +0.5 Mt to
and mine restarts (Burton, Russel Vale) +2 Mt2
• Mozambique: Vale Moatize ramp up • USA: Analyst views ranging from -8 Mt to flat3
18Demand / Supply Balance STEELMAKING COAL
Coal gap is developing unless projects progress
Supply & Demand from Existing Mines1
Possible Restarts
~30-55 Mt needed from
and Projects1
restarts and projects by 2024 60
375
50
355 40 Additional
gap to
30 high case
Mt
335
20
Mt
Gap to
315 10 base case
0
295
275 Highly probable projects Possible restarts
2018 2019 2020 2021 2022 2023 2024 Probable projects
USA: Analyst views ranging from -8Mt to flat 2 Includes: • Highly probable projects: Russia (~45%), Australia
Existing mines (~30%), USA (~25%)
Demand: base case (WoodMac) • Possible restarts: Australia (~60%), Canada (~20%),
Demand: high case (AME) ROW (~20%)
Includes: • Probable projects: Australia (~45%), Canada (~35%),
• Existing mines: expansion (~35Mt) and depletion (~40Mt) ROW (~20%)
• Expansions: Australia (~50%),
Indonesia/Russia/Mozambique/Canada/ROW (~10% each)
• Depletion: Australia (~50%), USA (~30%), ROW (~20%)
192nd Largest Seaborne Steelmaking Coal Supplier STEELMAKING COAL
Competitively positioned to supply steel producers worldwide
Sales Distribution
China
2013: ~30% North America Europe
2017: ~15% ~5% 2013: ~15%
India 2017: ~20%
2018: ~10%
2013: ~5% 2018: ~15%
2017: ~10%
2018: ~15%
Asia excl. China & India
2013: ~40% Latin America
2017: ~45% ~5%
2018: ~50%
Sales to India exceeded China from 2018
20Coal Price Supported by Strong Fundamentals STEELMAKING COAL
Volatility has declined
Coal Price Assessments1
(US$/tonne)1
Long-term average price of US$182/tonne,
300 or US$197/tonne on an inflation-adjusted basis
250
200
150
100
50
Argus FOB Australia 12-Month Moving Average
Coal pricing stabilizing due to:
• Strong demand / supply fundamentals
• Permitting and financing challenges (impact supply response)
• Better price transparency (reduces uncertainty)
21Appendix
Notes: Steelmaking Coal Markets
Slide 4: Demand Growth Forecast
1. Source: Wood Mackenzie.
2. Source: Wood Mackenzie, AME.
3. Source: Wood Mackenzie, CRU.
Slide 5: Supply Growth Forecast
1. Source: Wood Mackenzie. Exports include disruption allowance that is based on the difference between Wood Mackenzie’s Q4 forecast and actual exports over the period 2015 to 2017.
2. Source: Wood Mackenzie, CRU.
3. Source: Wood Mackenzie, Seaport Global Securities LLC.
Slide 6: Demand / Supply Balance
1. Source: Wood Mackenzie, AME. High case demand is based on AME for India’s imports and Wood Mackenzie for imports by other countries. Exports include disruption allowance that is based on the
    difference between Wood Mackenzie’s Q4 forecast and actual exports over the period 2015 to 2017.
2. Source: Wood Mackenzie, Seaport Global Securities LLC.
Slide 8: Steelmaking Coal Price Exceeding Expectations
1. Long-term steelmaking coal prices are calculated from January 1, 2008. Inflation-adjusted prices are based on Statistics Canada’s Consumer Price Index. Source: Argus, FIS, Teck. Plotted to March 25,
    2019.

  23
Energy Marketing April 3, 2019 Glenn Burchnall, Director, Energy Marketing and Logistics Kieron McFadyen, Senior Vice President, Energy
Caution Regarding Forward-Looking Statements
Both these slides and the accompanying oral presentations contain certain forward-looking statements within the meaning of the United States Private Securities Litigation Reform Act of 1995 and forward-
looking information within the meaning of the Securities Act (Ontario) and comparable legislation in other provinces (collectively referred to herein as forward-looking statements). Forward-looking statements can
be identified by the use of words such as “plans”, “expects” or “does not expect”, “is expected”, “budget”, “scheduled”, “estimates”, “forecasts”, “intends”, “anticipates” or “does not anticipate”, or “believes”, or
variation of such words and phrases or state that certain actions, events or results “may”, “could”, “should”, “would”, “might” or “will” be taken, occur or be achieved. Forward-looking statements involve known
and unknown risks, uncertainties and other factors which may cause the actual results, performance or achievements of Teck to be materially different from any future results, performance or achievements
expressed or implied by the forward-looking statements. These forward-looking statements include statements relating to the demand and markets for our product; expectations regarding infrastructure
development, including pipelines; sales contracts and expectations; production rates and capacity; and expectations regarding the Western Canadian Select differential.

These forward-looking statements involve numerous assumptions, risks and uncertainties and actual results may vary materially. These statements are based on a number of assumptions, including, but not
limited to: assumptions regarding general business and economic conditions; market prices of blended bitumen, as well as diluent and related products; the accuracy of our mineral and oil and gas reserve and
resource estimates (including with respect to size, grade and recoverability) and the geological, operational and price assumptions on which these are based; the impact of changes in Canadian-U.S. dollar and
other foreign exchange rates on our costs and results; acts of foreign or domestic governments; the timing of the receipt of regulatory and governmental approvals for our development projects and operations;
our costs of production and our production and productivity levels, as well as those of our competitors; our ability to secure adequate transportation and pipeline services for our products; changes in conditions
in financial markets generally; our ability to procure equipment and operating supplies in sufficient quantities and on a timely basis; our ability to attract and retain skilled staff; interest rates; our ability to procure
equipment and operating supplies; and our ongoing relations with our employees and business partners and joint venturers. Management’s expectations of mine life are based on the current planned production
rates and assume that all reserves and resources described in this presentation are developed. Assumptions are also included in the footnotes to various slides. The foregoing list of assumptions is not
exhaustive.

Factors that may cause actual results to vary materially include, but are not limited to: changes in commodity prices; changes in market demand for our products; changes in interest and currency exchange
rates; acts of governments; inaccurate geological and metallurgical assumptions (including with respect to the size, grade and recoverability of mineral reserves and resources); changes in our relationships with
our partners; unanticipated operational difficulties (including failure of plant, equipment or processes to operate in accordance with specifications or expectations, cost escalation, unavailability of materials and
equipment, government action or delays in the receipt of government approvals, industrial disturbances or other job action, adverse weather conditions and unanticipated events related to health, safety and
environmental matters); union labour disputes; social unrest; failure of customers or counterparties (including but not limited to rail, pipeline and other logistics providers) to perform their contractual obligations;
changes in our credit ratings or the financial market in general; unanticipated increases in costs to construct our development projects; difficulty in obtaining permits or securing transportation for our products;
changes in tax benefits or tax rates; resolution of environmental and other proceedings or disputes; and changes or deterioration in general economic conditions. Our Fort Hills project is not controlled by us and
construction and production schedules may be adjusted by our partners.

We assume no obligation to update forward-looking statements except as required under securities laws. Further information concerning assumptions, risks and uncertainties associated with these forward-
looking statements and our business can be found in our most recent Annual Information Form, as well as our management’s discussion and analysis of quarterly results and other subsequent filings, all filed
under our profile on SEDAR (www.sedar.com) and on EDGAR (www.sec.gov).

Scientific and technical information regarding our material mining projects in this presentation was approved by Mr. Rodrigo Alves Marinho, P.Geo., an employee of Teck. Mr. Marinho is a qualified person, as
defined under National Instrument (NI) 43-101.

  25
ENERGY
Market Fundamentals in Transition

Crude oil demand supported by global economic growth
• Demand growth drivers in transition
• Positive for heavy sour crudes

2019-2021: Canadian heavy pricing volatility
• Limited pipeline export capacity, crude by rail increasing
• Government mandated production curtailments
• IMO bunker fuel sulphur specification change

2021+: Growing market for Canadian heavy blends
• Market access critical for Canadian heavy price upside

26
ENERGY
Export Capacity Needed To Meet Global Demand

Near term (2019-2021):                      Western Canada Supply & Markets1
• Canadian export capacity lagging          (Mbpd)
                                            7.0
• Reliant on rail (400-500 Kbpd)
                                            6.5                                                        Rail
Pipeline development progressing:
                                            6.0                                                       TransMountain
• Enbridge: 370 Kbpd (2020-2021)                                                                      TMX
• Keystone XL: 800 Kbpd (2021-2022)         5.5            Reliant on rail
                                                            2019-2020                                 Keystone XL
• TMX: 600 Kbpd (2022)                      5.0
                                                                                                      Enbridge
Longer term:                                4.5                                                       Line 3
• Global heavy refining capacity increase   4.0
• US, India and China largest markets              2018        2019   2020     2021     2022       2023
                                                  Production     Local Demand & Current Pipeline    Rail

          Existing pipeline/rail sufficient to meet takeaway capacity through 2023
27
ENERGY
Fort Hills Blend Widely Accepted In Market
We produce a high quality refinery feedstock Teck Blend: Delivery Location
49.5 Kbpd
Low GHG intensity:ENERGY
Diverse Portfolio of Sales
Blend Sales By Delivery Point Revenue Calculation (US $/bbl)
Location Nymex WTI Western Canadian
Select Differential Basis
20% US Gulf Coast Calendar average Monthly contracted spot
(Pipeline) (Pipeline) monthly WTI differential at US Gulf Coast
60%
(Pipeline) Hardisty: Calendar average Weighted average
20% Pipeline & Rail monthly WTI WTI/WCS indexed
(Rail) Transfers differential at Hardisty
Fort Hills blend sales subject to crude quality
differential vs Western Canadian Select:
US Gulf Coast Hardisty • Estimated at minus US$2-$3/bbl for 2019
29Appendix
Notes: Energy Marketing
Slide 4: Export Capacity Needed To Meet Global Demand
1. Sources: IHSMarkit, Lee & Doma, Teck Energy.

  31
Commodity Outlook
April 3, 2019
Andrew Stonkus, Senior Vice President, Marketing and Logistics
Réal Foley, Vice President, Marketing, Coal and Base Metals
Glenn Burchnall, Director, Energy Marketing
You can also read