Australian Real Estate Quarterly Review - Office markets to benefit from a surge in jobs growth Q1 2018 - Dexus
←
→
Page content transcription
If your browser does not render page correctly, please read the page content below

Australian Real Estate
Quarterly Review

Office markets to benefit from a
surge in jobs growth
Q1 2018

In summary

Investment Climate ..................................................................................................... 3

Transactions ............................................................................................................... 4

Performance ............................................................................................................... 5

Office markets............................................................................................................. 6

Industrial ..................................................................................................................... 8

Retail…………….. ..................................................................................................... 10

Dexus Research ....................................................................................................... 11

Investment Climate
Job surge to boost demand
Over 400,000 full time jobs were created in               Figure 1. Jobs growth by state
Australia last year, the highest in 12 years and
double the long term average. As Figure 1 shows,          Per annum                                            NSW            VIC             QLD              WA

the big turnaround story was Queensland showing             6.0%

the strongest growth in the country, with NSW,              5.0%

Victoria and WA close behind.
                                                            4.0%

                                                            3.0%

Australia looks like becoming a ‘one-speed’                 2.0%

economy again as growth rebalances between                  1.0%

                                                            0.0%
the states. Mining investment is no longer a               -1.0%
significant drag on growth and the Queensland              -2.0%

and WA economies are beginning to respond.                 -3.0%
                                                               Dec-14                      Dec-15                           Dec-16                             Dec-17

NSW and Victoria continue to grow solidly due to          Source: ABS
population growth and infrastructure investment.
Business conditions are positive, helped by
                                                          Figure 2. Consumer & business confidence
subdued wages costs, low financing costs and an
improving global growth outlook. As a result,                Index                                  Business Confidence            Consumer Confidence (RHS)

businesses are hiring again.                                  25                                                                                                    125

                                                              20                                                                                                    120

While softening housing construction is still the             15
                                                                                                                                                                    115

major risk to growth, the effects appear likely to            10
                                                                                                                                                                    110

be offset by improving business and public
                                                                                                                                                                    105
                                                               5
                                                                                                                                                                    100
investment.                                                    0
                                                                                                                                                                    95
                                                               -5

Service sector activity will remain a growth driver
                                                                                                                                                                    90

                                                              -10                                                                                                   85
for the economy in 2018 led by education, health,             -15                                                                                                   80

and IT. The professional services and finance                  Dec-08   Dec-09   Dec-10   Dec-11     Dec-12    Dec-13     Dec-14     Dec-15    Dec-16    Dec-17

industries are growing solidly, but with a more           Source: Westpac, NAB

subdued level of job creation. Agribusiness and
tourism are also buoyant.
                                                          Table 1. Australian economic forecasts: Q1 2018
All of these trends will be positive for occupier
                                                                                                              Jun-17               Jun-18               Jun-19
demand in FY18 and FY19, particularly for the office
                                                           Real GDP %pa                                          1.9%                  2.7%                    3.2%
and industrial sectors.

The strategic theme is that the office and                 Final demand %pa                                     2.4%                   2.5%                    2.8%
industrial sectors will be relatively stronger than        Employment %pa                                       2.0%                   2.5%                    1.4%
the retail and residential sectors in the year
                                                           Goods imports %pa                                     7.2%                   1.7%                   2.1%
ahead.
                                                           Retail sales %pa (real)                              2.5%                   2.6%                    3.4%
Over time, retail spending should benefit from
improved consumer sentiment and the prospect               CPI %pa                                               1.9%                   1.9%                   2.1%
of stronger wages growth.
                                                           90 Day bill %                                         1.7%                   1.8%                   2.2%
The improving global growth outlook is expected            10yr Bond %                                          2.6%                   2.5%                    3.1%
to lead to bond yields rising slowly towards more
normalised levels in the medium term. However,             AUD/USD                                               0.77                   0.76                   0.75
weak inflation pressure should keep Australian
                                                          Source: Deloitte Access Economics
official cash rates relatively flat over the next year,
rising towards the end of FY19.
Transactions
Foreign buyers remain active
The fourth quarter of 2017 saw the highest             Figure 3. Transaction volumes – quarterly
transaction volume of the year, accounting for a
third of all transactions during. Annual transaction
activity was up 3% from $23.3bn in 2016.

Unlisted property trusts were the major domestic
buyers for the third consecutive year in 2017,
followed by A-REITs and privates.

Foreign transaction volumes stablised following
Chinese capital restrictions. In the last quarter,
31.4% of transactions were from foreign sources,
the lowest level since June 2015. That said, non-      Source: JLL Research, Dexus Research Transaction Database
Chinese foreign buyers remained active indicating
that they still see value in the Australian market     Figure 4. Gross transaction volume by buyer type
relative to offshore jurisdictions.

The most significant transaction of the quarter
was the acquisition of Indooroopilly Shopping
Centre by funds associated with AMP.

The next largest retail transaction was the 50%
interest in Chatswood Chase, purchased by GIC
for $562.3m. There were relatively few significant
industrial transactions this quarter, despite Allied
Pinnacle’s portfolio sale to Qualitas for $204m.
                                                       Source: JLL Research, Dexus Research. Includes portfolio sales.
Two key metropolitan sales in Sydney were Telstra
House for $342m to Charter Hall Direct Property
Fund (CHDPF) and Blackstone’s 1 Castlereagh            Table 2. Q4 2017 top transactions
Street to Early Light International for $218m at an
undisclosed cap rate.                                   Price     Asset/portfolio           Buyer
                                                        ($m)
Investment yields have tightened in the Sydney          800.0     Indooroopilly             AMP Capital Diversified
and Melbourne CBDs to average 4.8% and 5.1%                       Shopping Centre           Property Fund (50%) /
respectively. Brisbane and Perth continue to trade                                          AMP Capital Shopping
at a wider spread to Australia’s largest cities.                                            Centre Fund (50%)
However, despite an apparent arbitrage, there           562.3     Chatswood Chase           GIC
has been relatively little transactional activity in
these two markets.                                      370.0     Santos Place              GIC

The pricing cycle for real estate is mature. In the     342.0     Telstra House             Charter Hall Direct
absence of an unforeseen capital market shock,                                              Property Fund (CHDPF)
cap rates are expected to remain low and                301.2     Queen Victoria            Vicinity Centres
investment demand strong over the next year.                      Building
                                                        300.0     Rockingham                AMP Capital
From here, trends in pricing are more likely to be
                                                                  Centre
driven by the fundamental growth outlook for
                                                        289.3     Trust Capital             PA Realty (MEC and
markets (e.g., office supply/demand dynamics)
                                                                  Advisors Portfolio        CLSA Real Estate)
rather than by interest rates or bond yields.
                                                        218.0     1 Castlereagh             Early Light International
                                                                  Street
                                                        204.0     Allied Pinnacle           Qualitas Food
                                                                  Portfolio                 Infrastructure
                                                       Source: Dexus Research Transaction Database, JLL Research

dexus.com                                                                                                                4
Performance
Office returns climb higher
A-REITs underperformed the broader Australian         Figure 5. Unlisted property returns by sector
sharemarket by 6.1 percentage points in 2017,
following three consecutive years of
outperformance. However, A-REITs finished the
year well, returning 7.6% in Q4 2017.

Performance going forward will be influenced by
continued income growth and robust occupancy
rates on the one hand, offset by a perceived
maturing of the price cycle for underlying property
and sentiment around structural changes in the
retail sector on the other.

The prospect of rising bond yields could be           Source: Mercer/IPD (NAV Pre-Fee), Dexus Research
another headwind for A-REITs. Figure 6 shows the
sensitivity of A-REIT pricing to bond yield
movements. Government bonds and bond                  Figure 6. A-REIT prices vs Bond yields
proxies, such as property stocks, tend to be highly
correlated. Any further tightening of monetary
policy by central banks around the world over the
next few years which leads to higher bond yields
could influence pricing of high yielding defensive
assets.

Unlisted property returns also ended the year on a
positive note, remaining at the top of the asset
class return table with an annual return of 13.5%.

Office remains the best performing sector with
                                                      Source: RBA, Bloomberg, Dexus Research
strong fundamentals, widening re-leasing
spreads, and a subdued supply pipeline in the
short term. However, as the pricing cycle matures,    Table 3. Index returns to 31 December 2017
total returns are expected to ease over the next
two years with capitalisation rates flattening,                        Qtr.     1 yr      3 yr
leading to a softening in capital growth.                                %     %p.a.     %p.a.

                                                                                                   Mercer/IPD Aust.
Australian equities have continued to                  Unlisted
                                                                         3.7     13.5      12.9    Unlisted
                                                       property*
underperform global markets despite a                                                              Wholesale PFI*
commendable 11.8% return in the year to                Australian                                  S&P/ASX 200
                                                                         7.6     11.8       8.6
December 2017. Persistent structural issues plague     shares                                      Accumulation
the market, such as a dearth of technology stocks                                                  S&P/ASX 200
that have driven growth internationally. The           A-REITs           7.9      5.7       11.0
                                                                                                   Property
                                                                                                   Accumulation
Australian sharemarket’s high weighting to                                                         Index
banking and retail stocks has also held back           Australian
performance.                                           fixed             1.4      3.7        3.1   BACM0 Index
                                                       interest

                                                       Australian
                                                                        0.4       1.7        2.1   BAUBIL Index
                                                       cash

                                                      The indices are copyrighted by and proprietary to the relevant
                                                      Source issuers: Mercer/IPD Aust. Unlisted Wholesale PFI;
                                                      Standard and Poor’s Australian Securities Exchange
                                                      Accumulation Index; Bloomberg/UBS Composite and Bank Bill
                                                      Indices. *NAV Pre-Fee

dexus.com                                                                                                              5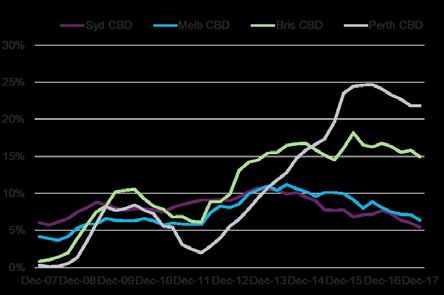
Office markets
Strong performance to continue in 2018

The eastern seaboard office markets experienced      Figure 7. Vacancy by market
a stellar year in 2017. Effective rents grew by
double digits across most markets (Table 4) with
Sydney and Parramatta CBDs leading the charge,
up +26% and +25% respectively for prime assets.
Both markets are expected to perform strongly in
2018 as they continue to benefit from low vacancy
and positive demand supported by infrastucture
investment.

Melbourne continued to lead the office markets in
terms of occupier demand, recording +91,100sqm
in net absorption for the year on the back of a
powering Victorian economy and robust
population growth. Brisbane and Perth also           Source: JLL Research, DEXUS Research

proved they were on the mend, recording very
                                                     Figure 8. Net effective rents ($/sqm) by market
strong net absorption of +33,200sqm and
+41,800sqm respectively in 2017.

Vacancy levels declined across the major CBD
markets (Figure 7), with vacancy levels below the
longterm average. Sydney and Melbourne
delivered strong rental growth in 2017 (Figure 8).
Brisbane and Perth rents were relatively flat as
high vacancy remained an issue.
We remain positive on the outlook for office
markets in the year ahead as they continue to
benefit from growth in the service sector and
minimal supply.
                                                     Source: JLL Research, DEXUS Research
Our key predictions for 2018 include:

- Sydney markets (especially the CBD,                Table 4. Q4 2017 office snapshot
  Parramatta and North Sydney) to outperform
  with strong rental growth benefiting from a                               Vacancy      Prime net    Prime net
                                                                                  %    face rental    eff. rental
  robust NSW economy and minimal supply                                                     growth       growth
                                                                                             % p.a.        % p.a.
- Melbourne will continue to record the strongest
  take-up in 2018 helped by population growth of      Parramatta               3.9%          16.1%        25.0%
  2.7%pa. While supply is expected to ramp up         Sydney CBD               5.4%           9.6%        26.0%
  from FY19+, strong demand should continue to        Melbourne CBD            6.4%           9.5%        13.4%
  support rental growth over the next 6-12 months     North Sydney             7.6%           7.3%         11.9%

- Brisbane and Perth will see a return to rental      Macquarie Park           7.8%           4.5%        10.4%
  growth (albeit mild) in 2018 due to improving       Canberra                 13.3%          3.4%         5.3%
  state economies, positive demand and falling        Brisbane CBD            15.0%           2.5%        -2.7%
  vacancy rates
                                                      Adelaide CBD             15.1%         0.3%         -7.4%
                                                      Perth CBD                21.8%          -1.3%         1.3%

                                                     Source: JLL Research

dexus.com                                                                                                      6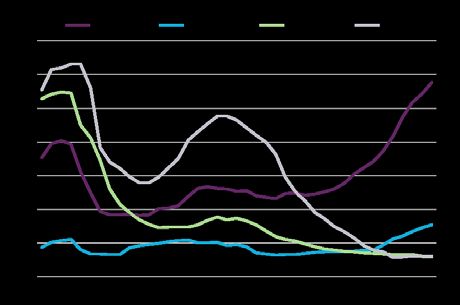
Office market wrap
  Market           Comments                                                                                         Direction of trend
                                                                                                                    for next 12 months

  Sydney           Sydney is expected to outperform in the shortterm driven by growth in the service sector         Vacancy         -1.0
                   and minimal supply. With below average vacancy of 5.4%, prime and secondary gross
                                                                                                                    Rents            2.0
                   effective rents have risen +20.5% and +13.3% over the year. Rising secondary rents and
                   withdrawals are driving strong take-up of prime space with c104,200sqm of net absorption         Incentives      -1.0
                   recorded in 2017. A constrained supply pipeline and expectations of falling vacancy will         Yields           0.0
                   continue to support strong rental growth in 2018.

  North Sydney     Despite subdued demand and vacancy remaining relatively steady in North Sydney, prime            Vacancy         -1.0
                   net effective rents grew by 11.9% over the year with net incentives declining to 25%. A more
                                                                                                                    Rents            2.0
                   positive demand outlook is expected for 2018 as the market benefits from a strong NSW
                   economy and overflow of demand from the CBD. Stronger demand should help to support              Incentives       0.0
                   a further uplift in rents over the year ahead.                                                   Yields           0.0

  Macquarie Park   Stronger demand and withdrawal of stock for residential conversion has seen vacancy              Vacancy         -1.0
                   rates fall below average to 7.8%. Prime net effective rents have grown strongly up 10.4%
                                                                                                                    Rents            2.0
                   over the year as net incentives fell to 24%. A relatively subdued supply pipeline and positive
                   demand is expected to support further rental growth in the year ahead.                           Incentives       0.0
                                                                                                                    Yields           0.0
  Parramatta       Parramatta is expected to perform solidly in the shortterm, having one of the lowest total       Vacancy          0.0
                   vacancy rates (3.9%) and no immediate supply risks. The tight prime vacancy (0.4%) will
                                                                                                                    Rents            2.0
                   continue to support rental growth and low incentives for prime assets. Supply risks will mount
                   over the mediumterm with the exit of CBA and development of Parramatta Square;                   Incentives       0.0
                   however most new supply should be largely pre-committed and the market will benefit from         Yields           0.0
                   government decentralisation and significant infrastructure investment.

  Melbourne        Melbourne is benefiting from strong economic fundamentals, recording the strongest net           Vacancy         -1.0
                   absorption across the CBD office markets, and a fall in vacancy to 6.4%. In line with
                                                                                                                    Rents            2.0
                   improving vacancy, prime net effective rents have increased by 14.4% over the year (largely
                   driven by increases in Face rents). Limited new supply and a solid demand outlook will see       Incentives      -1.0
                   vacancy tighten and support further rental growth over the next 6-12 months.                     Yields           0.0

  Brisbane         The latest numbers continue to support a recovery story for Brisbane over the next year or       Vacancy         -1.0
                   two with positive net absorption of +33,208sqm recorded for the year. While prime gross
                                                                                                                    Rents            2.0
                   face rents have improved, growing 2.5% over the year, incentives remain elevated (38%
                   gross) as a result of high vacancy and speculative supply. Prime rental growth is expected       Incentives       0.0
                   to improve over the mediumterm, as vacancy levels move back towards the long run                 Yields           0.0
                   average with a flight to quality absorbing prime space.

  Perth            The Perth market appears to be on the mend. Demand has improved with net absorption              Vacancy          0.0
                   of +41,781sqm recorded for the year and vacancy rates have declined by -2.3 percentage
                                                                                                                    Rents            2.0
                   points. Prime net effective rents have experienced mild growth of +1.3% over the last 12
                   months as net incentives declined by -80bps. Rental growth is expected to remain                 Incentives      -1.0
                   subdued shortterm, improving over the mediumterm as market conditions slowly recover in          Yields           0.0
                   the absence of new supply.

  Adelaide         Conditions in the Adelaide market appear to be improving with net absorption of                  Vacancy         -1.0
                   +20,850sqm recorded for the year and vacancy trending lower. Prime incentives have
                                                                                                                    Rents            0.0
                   remained stable at 37% (gross) while face rents have increased slightly. Rental growth is
                   expected to remain subdued over the short to medium term as the market works through             Incentives      -1.0
                   elevated vacancy.                                                                                Yields           0.0

  Canberra         The demand outlook remains subdued given Federal Government budget constraints,                  Vacancy         -1.0
                   which will continue to weigh on public service job growth over the short to medium term.
                                                                                                                    Rents            2.0
                   Limited availability of prime space (prime vacancy is currently 5.6%) is helping to support
                   rental growth in prime assets. Positive demand for prime assets should support an uplift in      Incentives       0.0
                   rents over the next 12 months.                                                                   Yields           0.0

dexus.com                                                                                                                           7
Industrial
Sydney leading the charge
Occupier demand is running just ahead of supply Figure 9. Average existing prime industrial rents
in Sydney and Melbourne, leading to pockets of Outer West Sydney West Melbourne
$/sqm
rental growth. In 2017, Sydney recorded almost 140
South Brisbane East Perth
920,000sqm of industrial take-up, the highest 130
level in more than 10 years and 60% more than the 120
10 year average. Tenant demand remained solid 110
in Melbourne. 100
90
Industrial conditions appear to be improving in
80
Brisbane after 2017 recorded the highest level of
70
take-up in five years, supported by several large
60
pre-lease and owner-occupier deals. Demand in
50
Perth remained subdued. Dec-07 Dec-09 Dec-11 Dec-13 Dec-15 Dec-17
Solid population growth and large infrastructure Source: JLL Research, Dexus Research
pipelines will support industrial conditions in the
Eastern states over the next couple of years. Figure 10. Average industrial land values (1ha)
2017 also saw key industrial markets in Sydney and $/sqm Outer West Sydney West Melbourne
South Brisbane East Perth
Melbourne record rental growth for the first time in 650
several years on the back of favourable 550
conditions. These markets are likely to continue to
450
witness upward pressure on rents in the near term,
particuarly in land constrained areas in the inner 350
city.
250
Industrial supply is projected to remain in-line with
150
the 10 year average in 2018; as institutions
continue to build new stock despite increasingly 50
Dec-07 Dec-09 Dec-11 Dec-13 Dec-15 Dec-17
limited serviced land supply in some core markets.
Source: JLL Research, Dexus Research.
Demand for investment stock and development
sites remains strong and highly competitive due to
limited availability of product, driving up prices for Table 5. Q4 2017 industrial snapshot
all asset types and industrial land. Land values
Ave prime Existing prime
have lifted by 11% in Outer West Sydney over the cap rate net face rental
past year. change growth % p.a.
from Q4
2016
Outer West Sydney -0.25 4.2
Southern Brisbane -0.25 -4.6
East Perth 0.00 -9.7
South Sydney -0.25 6.8
West Melbourne 0.00 2.9
Source: JLL Research, Dexus ResearchOuter West Sydney 10 year average but below the 360,000sqm
completed in 2017. Reflecting the provision of
2017 was a record year for industrial take-up in cleared, zoned land in West Melbourne, the supply
Outer West Sydney, with some 370,000sqm figure may increase as new developments are
recorded, well above the 10 year average and the announced.
highest level since 2007. Demand is projected to
remain solid in the medium term, benefitting from The largest lease deal in Q4 2017 was a pre-lease
positive economic conditions. to CTI Logistics (15,000sqm) at Truganina.
Supply in 2017 was below the 10 year average and Figure 12. West Melbourne gross take-up
the reduced supply, combined with strong tenant ‘000 sqm
demand, helped to drive rental growth in the 350
Outer West. Supply is projected to bounce back in 300
2018 with around 384,000sqm of industrial stock 10yr average = 255,000sqm p.a.
likely to be developed, significantly above the 10 250
year average of 290,000sqm. 200
Rental growth is likely to continue in the short term 150
but at a more subdued rate, taking into account 100
the supply pipeline. 50
The largest lease deal in Q4 2017 was Miele pre- 0
2007 2008 2009 2010 2011 2012 2013 2014 2015 2016 2017
committing to a 17,000sqm warehouse at Calibre
in Eastern Creek. Source: JLL Research (gross take-up), Dexus Research.
Figure 11. Outer West Sydney gross take-up Brisbane
‘000 sqm
Total take-up in Brisbane reached almost
450
480,000sqm in 2017, the highest level since 2012
400
and suggesting industrial conditions are
350
10yr average = 260,000sqm p.a.
improving.
300
250 The industrial supply pipeline for Brisbane is
200 currently projected at 160,000sqm in 2018, well
150 below the 10 year average and the 340,000sqm
100 completed in 2017. The reduced supply pipeline
50 may help to support rents in Brisbane in the short
0 term.
2007 2008 2009 2010 2011 2012 2013 2014 2015 2016 2017
Source: JLL Research (gross take-up), Dexus Research. There were no pre-lease deals in Brisbane in Q4
2017, with the largest lease being to Toll
West Melbourne (20,000sqm) at Acacia Ridge.
West Melbourne recorded 43,000sqm of industrial Figure 13. South Brisbane and ATC gross take-up
take-up in Q4 2017, leading to 325,000sqm of
‘000 sqm Southern Brisbane ATC
take-up in 2017, substantially higher than the 10 500
year average of 255,000sqm.
400
The Victorian economy is projected to remain 10yr average = 340,000sqm p.a.
strong over the medium term and as such, 300
industrial demand in West Melbourne is likely to
remain solid. 200
2017 saw industrial rents in West Melbourne 100
increase slightly. It is likely that some mild upward
pressure on rents will continue in the short term. 0
2007 2008 2009 2010 2011 2012 2013 2014 2015 2016 2017
Around 230,000sqm of industrial stock is
Source: JLL Research (gross take-up), Dexus Research.
projected to be developed in 2018, in-line with the
Dexus.com 9Retail
Will consumers come to the rescue?
Consumers appear to be shrugging off a range of
headwinds such as weak wages growth and a
softening housing market. Consumer sentiment Figure 14. Consumer confidence
has risen over the past few months to reach its Index Consumer Confidence
highest level in four years in January. The key 115
question is ‘will it be sustained?’. 110
Retail turnover growth remains below trend on an 105
annual basis at 2.8% per annum. While the retail 100
environment remains challenging, the retail sector
appears to have benefitted from improving
95
sentiment. 90
Retail turnover growth jumped a record 1.2% in the 85
Jan-13 Jan-14 Jan-15 Jan-16 Jan-17 Jan-18
month of November 2017 based on ABS data, well
Source: Westpac, Dexus Research
above the typical average for that time of year.
The results was helped by sales of new electronics Figure 15. Retail sales growth and cash rate
such as the release of the iPhone 8 and iPhone X MAT growth Retail Turnover Interest rate
7% 6%
as well as discounting events like Black Friday.
6%
5%
At a category level, food catering continues to
perform well, along with pharmaceuticals and 5%
4%
cosmetics, while department stores are still 4%
contracting.
3%
3%
The outlook is for mild improvement in retail sales
2%
2%
in the medium term as solid jobs growth flows 1%
1%
through to wages and an improvement in
household incomes. 0%
Nov-14 May-15 Nov-15 May-16 Nov-16 May-17
0%
Nov-17
The outlook for rents is relatively flat in the short to Source: ABS, RBA, Dexus Research
medium term given slow sales growth and high Table 6. Q4 2017 retail snapshot
occupancy costs.
Specialty Cap rate State retail
Key topics this quarter include:
rental change sales
- Amazon officially commenced trading in growth % from Q4 growth %
p.a. 2016 p.a.
Australia in December following a soft opening
in late November; Amazon will continue its Sydney 3.2
steady rollout in the coming years Regional 0.63 -0.50
Sub-regional 0.88 -0.25
- Landlords should expect some negative re-
Neighbourhood 1.00 -0.25
leasing spreads for physical retail stores in the
Melbourne 3.8
near term as retailers adjust business models to
compete with international and online retailers Regional 0.25 -0.25
Sub-regional 0.12 -0.25
- The latest physical retailers to face difficulties
Neighbourhood 0.37 0.00
include Oroton, which was recently placed into
SE QLD 1.9
administration; while Specialty Fashion Group
Regional 0.00 -0.50
(Millers, Katies, Rivers, City Chic) and Mountain
Sub-regional 0.00 0.00
Designs have both announced plans to close
Neighbourhood 0.00 -0.50
some of their physical stores
Source: JLL Research, ABS, Dexus Research
Dexus.com 10Dexus Research
Peter Studley Kimberley Slow
Head of Research Research Manager
d: +61 2 9017 1345 d: +61 2 9017 1287
e: peter.studley@dexus.com e: kimberley.slow@dexus.com
Lee Cikuts Karl Sarich
Research Manager Research Associate
d: +61 2 9017 1268 d: +61 2 9017 1299
e: lee.cikuts@dexus.com e: karl.sarich@dexus.com
This report makes reference to historical property data sourced from JLL Research (unless otherwise stated), current as at ‘Q4/2017’. JLL accepts
no liability for damages suffered by any party resulting from their use of this document. All analysis and views of future market conditions are solely
those of Dexus.
Issued by Dexus Funds Management Limited ABN 24 060 920 783, Australian Financial Services Licence holder. This is not an offer of securities or
financial product advice. The repayment and performance of an investment is not guaranteed by Dexus Funds Management Limited, any of its
related bodies corporate or any other person or organisation. This document is provided in good faith and is not intended to create any legal
liability on the part of Dexus Funds Management Limited.
This economic and property analysis is for information only and Dexus Funds Management Limited specifically disclaims any responsibility for any
use of the information contained by any third party. Opinions expressed are our present opinions only, reflecting prevailing market conditions, and
are subject to change. In preparing this publication, we have obtained information from sources we believe to be reliable, but do not offer any
guarantees as to its accuracy or completeness. This publication is only intended for the information of professional, business or experienced
investors.
dexus.com 11You can also read