#WESTERNUSRI2021 CONFERENCE: RESEARCH OUTPUT SHOWCASE
←
→
Page content transcription
If your browser does not render page correctly, please read the page content below
8/22/2021                                            #WesternUSRI2021 Conference: Research Output Showcase

                          #WesternUSRI2021
                          Conference: Research
                          Output Showcase
                          General Transit Feed Specification (GTFS) data in
                          transportation research: A review of applications and
                          methods

                          Stanley Ho
                          August 22, 2021

                          Introduction
                          (This is a printout of a Storymap that some interactive content
                          maybe only visible on the webpage, for the latest version please
                          visit here.)

                          This research falls under the discipline of Urban Geography/
                          Geographic Information Science (GIS). The objective of this research
                          is to sharing knowledge of a public transportation dataset named
                          General Transit Feed Specification (GTFS). Transportation research
                          using GTFS and other open source data can be easily reproduced in
                          many cities and to answer many urban geography questions that
                          involves public transportation. Readers can find that GTFS and
https://storymaps.arcgis.com/stories/bb048b3e875f4bafabb5d810c1bcccab/print                                  1/15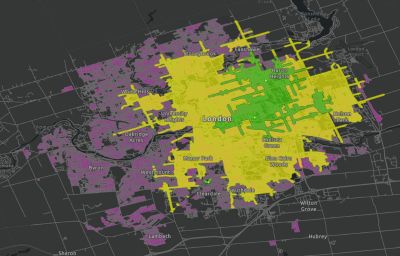
8/22/2021                                            #WesternUSRI2021 Conference: Research Output Showcase

                          related research are conducted globally through the selected
                          collection of journal articles. The demonstration aims to showcase
                          that research using GTFS is feasible and easy to learn by public with
                          little amount of open data.

                          GTFS Brief and Demonstration

                          Brief History of GTFS
                          GTFS is developed by TriMet (a public transit agency from Portland,
                          Oregon) and Google in 2005, it was originally branded as Google
                          Transit Feed Specification for the purpose of visualizing the city’s
                          public transportation network and trip-planning by Google Maps
                          (McHugh, 2013). It is renamed in 2010 as General Transit Feed
                          Specification as this dataset format is not exclusively used by Google
                          products, where it can be used by third-party developers for trip
                          planning, creating timetable, data visualization, accessibility and
                          urban planning analysis, as well as real-time information systems
                          (GTFS.org, 2021b). GTFS is published and maintained by public
                          transit agencies voluntarily, where they are open, free, and
                          accessible to the public (OpenMobilityData, 2021; Transitland,
                          2021). The GTFS standard has gained popularity worldwide, where
                          the World Bank also advocates for it and provides resources to help
                          countries to adopt it internationally (Antrim et al., 2017).

                          Data Structure of GTFS
                          GTFS is a set of text files enclosed in a zipped folder that contains
                          necessary information for the purpose of routing. They are
                          subjected to update when agencies update their transit services due
                          to operational needs, such as seasonal changes or service cut during
                          the COVID-19 pandemic. GTFS dataset can be used offline (static)
                          or online (GTFS-Realtime, where available) for real-time service
                          information (GTFS.org, 2021a).

                          Below are the format of static GTFS:
https://storymaps.arcgis.com/stories/bb048b3e875f4bafabb5d810c1bcccab/print                                  2/15
8/22/2021 #WesternUSRI2021 Conference: Research Output Showcase
Required (Must be included in the
dataset.):
• agency.txt (Representation of transit
agencies in the dataset.)
Diagram Attribution: Martin Davis
• stops.txt (Stops for vehicles to pick up
or drop off riders. Definition for
stations and station entrances.)
• routes.txt (Transit routes, where a route is a group of trips
displayed as a single service.)
• trips.txt (Trips for each route, where a trip is a sequence of at
least two stops that occur during a specific time period.)
• stop_times.txt (Stops' arrival and departure time for a vehicle for
each trip.)
Conditionally Required (Required under certain conditions.):
• calender.txt (To specify service dates using a weekly schedule
with start and end dates. Required unless calendar_dates.txt has
defined all dates of services.)
• calender_dates.txt (Exceptions for the services defined in the
calendar.txt, such as holidays or scheduled reroute or downtime.
Required and must contain all dates of service if calendar.txt is
omitted.)
Optional (Can be omitted or empty strings in some field.):
• fare_attributes.txt (Fare information for a transit agency's
routes.)
• fare_rules.txt (Rules to apply fares for itineraries.)
• shapes.txt (Rules for mapping vehicle travel paths, sometimes
referred to as route alignments.)
• frequencies.txt (Headway (time between trips) for headway-
based service or a compressed representation of fixed-schedule
service.)
• transfers.txt (Rules for making connections at transfer points
between routes.)
https://storymaps.arcgis.com/stories/bb048b3e875f4bafabb5d810c1bcccab/print 3/158/22/2021 #WesternUSRI2021 Conference: Research Output Showcase
• pathways.txt (Pathways linking together locations within
stations.)
• levels.txt (Levels within stations.)
• translations.txt (Translations of customer-facing dataset values.)
• feed_info.txt (Dataset metadata, including publisher, version,
and expiration information.)
• attributions.txt (Dataset attributions.)
Case Study: Finding Bus Route to Mass Vaccination Clinics
in London, ON
The most well known usage of GTFS is for planning trip via public
transportation. For example, when a London resident is interested
in booking an appointment for COVID-19 vaccination through one
of the three mass vaccination clinics in the city. They can access
information of the suggested routes and time expectation by
inputting their origin, destination, desired departure/arrival time, as
well as preference like minimizing transfers, minimizing walking
distances, or accessibility needs for wheelchair users. As London
Transit provides Realtime vehicle positions, this can update riders
with the latest transit information and to make plans accordingly.
Google Transit trip planner. For a trip that the passenger wish to arrive by 3pm.
Demonstration on GIS Method and Application: How GTFS
can be used by Public Health Officials to study Transit
https://storymaps.arcgis.com/stories/bb048b3e875f4bafabb5d810c1bcccab/print 4/158/22/2021 #WesternUSRI2021 Conference: Research Output Showcase
Accessibilities of the Chosen Mass Vaccination Clinic
Locations.
But for public health officials (i.e. Middlesex London Health Unit/
London Health Sciences Centre), one of the possible GTFS usages
for them can be studying the transit-based accessibility of their
chosen clinics through a service area analysis. In the field of human
geography, accessibility is defined as the person's ability to access
economical and social opportunities in the area, where
opportunities can be anything like employment, healthcare services,
recreations, and other amenities (Wachs & Kumagai, 1973).
For this demonstration, we are specifically looking for residents who
are able to arrive any of the mass vaccination clinics from their
home within a 30-minute and 60-minute threshold by public transit
and walking only.
The GTFS dataset can be obtained from London Transit's website or
from OpenMobiltyData. Roads, sidewalks, zoning information is
obtained from the Open Data database from the City of London.
The map above showcase the service area of the Mass Vaccination
Clinics (Green = 30-min threshold; Yellow = 60-min threshold),
where residential areas are colored in purple. The assumption is
https://storymaps.arcgis.com/stories/bb048b3e875f4bafabb5d810c1bcccab/print 5/158/22/2021 #WesternUSRI2021 Conference: Research Output Showcase
that on Sunday, residents living within the threshold zones will be
able to arrive the clinics in the said time threshold if they leave at
2pm.
As we can see here many residential areas are not covered by the
clinics, which means they will spend more times to travel via public
transportation. At this moment, public health officials can make
decision to make the vaccine to be more accessible by strategies
like:
• Pop-up Clinics
• Participating pharmacies
• Mobility On Demand services
• Bus Mobile Clinics
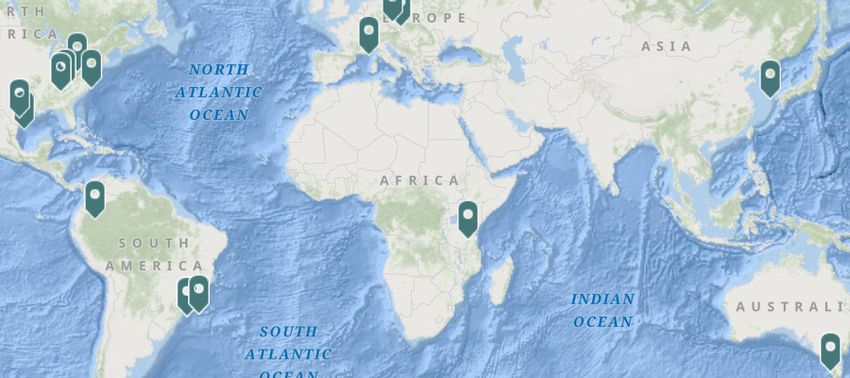
Literature Review: A Global Study
20 journal articles have been reviewed to showcase that research
have been conducted globally using GTFS dataset. Highlights of the
studies can be read through selecting the point of interest on the
interactive map below.
Esri, GEBCO, DeLorme | Esri, FAO, NOAA Powered by Esri
(Jomehpour Chahar Aman & Smith-Colin, 2020)
City: Dallas, Texas
https://storymaps.arcgis.com/stories/bb048b3e875f4bafabb5d810c1bcccab/print 6/158/22/2021 #WesternUSRI2021 Conference: Research Output Showcase
(Karner & Rowangould, 2021)
City: Harris County, Texas
(Farber et al., 2014)
City: Cincinnati, Ohio
(Widener, 2017)
City: Hamilton County, Ohio
(Goliszek et al., 2020)
City: Szczecin, Poland
(Li & Dodson, 2020)
City: Melbourne, Australia
(Kim et al., 2021)
City: Seoul, Korea (1936)
(Eberhart et al., 2015)
City: Philadelphia, PA
(Madill et al., 2018)
City: Melbourne, Australia
(Hyder et al., 2021)
City: Franklin County, Ohio
(Pereira 2018)
https://storymaps.arcgis.com/stories/bb048b3e875f4bafabb5d810c1bcccab/print 7/158/22/2021 #WesternUSRI2021 Conference: Research Output Showcase
(Pereira, 2018)
City: Rio de Janeiro, Brazil
(Pereira, 2019)
City: Rio de Janeiro, Brazil
(Pritchard et al., 2019)
City: São Paulo, Brazil
(Slovic et al., 2019)
City: São Paulo, Brazil
(Williams et al., 2015)
City: Nairobi, Kenya
(Brussel et al., 2019)
City: Bogotá, Colombia
(Lee & Miller, 2018)
City: Columbus, Ohio
(Radzimski & Dzięcielski, 2021)
City: Poznań, Poland
(Sieber et al., 2020)
City : Switzerland (Homburgertal, Boncourt, Thunersee, Tösstal)
(Young et al., 2020)
City: Toronto, Ontario
https://storymaps.arcgis.com/stories/bb048b3e875f4bafabb5d810c1bcccab/print 8/158/22/2021 #WesternUSRI2021 Conference: Research Output Showcase
Discussion
For this part we will discuss on the themes for GTFS research.
1. Social Equity
We found that lots of research papers were discussing on the theme
of inequalities. Given that GTFS is a standardized, open dataset
widely used by cities around the world to showcase its public
transportation services, it makes measurements and comparison of
transit-based accessibility viable (Bok & Kwon, 2016). Some
research are focused on the inequalities between automobile users
and public transit users (Brussel et al., 2019; Eberhart et al., 2015;
Karner & Rowangould, 2021; Li & Dodson, 2020; Widener, 2017).
Some are focused on the disparities between neighbourhood
(Farber et al., 2014; Jomehpour Chahar Aman & Smith-Colin, 2020;
Kim et al., 2021; Madill et al., 2018).
On the other hand, the areas of research interest can be varied:
• Job Accessibility (Brussel et al., 2019; Goliszek et al., 2020;
Jomehpour Chahar Aman & Smith-Colin, 2020; Kim et al., 2021;
Lee & Miller, 2018; Li & Dodson, 2020; Pereira, 2019; Pritchard et
al., 2019; Slovic et al., 2019)
• Healthcare (Eberhart et al., 2015; Hyder et al., 2021; Madill et al.,
2018; Pereira, 2018)
• Food Security (Farber et al., 2014; Widener, 2017)
• Voting Rights (Karner & Rowangould, 2021)
2. Global South
https://storymaps.arcgis.com/stories/bb048b3e875f4bafabb5d810c1bcccab/print 9/158/22/2021 #WesternUSRI2021 Conference: Research Output Showcase
There are disparities in GTFS dataset availability, Where most of the
participating agencies are from the Global Norths (North America
and Europe) , meanwhile very few were from the Global Souths
(Central/South America and Africa) (Bok & Kwon, 2016). Since one
of the United Nation’s Sustainability Goals (SDG) is to increase the
accessibility of transit services in developing countries, it is
worthwhile to put focus into the implementation of GTFS and to
explore its potential to assist human development research (Brussel
et al., 2019; Slovic et al., 2019). One of the focus can be in studying
how transportation investment and planning can facilitate local
residents (Pereira, 2018, 2019). For planning, feasibility of
multimodal transportation can also be discussed such as improving
cycle networks to encourage more bike-and-ride behaviors instead
of driving (Pritchard et al., 2019). Also, GTFS dataset maybe
unavailable due to the nature of semi-formal transit system. By
developing methods to capture data necessary for building a GTFS
dataset through public participation, it is possible to overcome
technical barriers and to facilitate transportation research in the
Souths (Williams et al., 2015).
3. Future of Mobility
With technological advancement, public transportation may face
many challenges and opportunities. To retain and to increase
ridership, transport authorities need to investigate the latest
developments in mobility studies. In current settings, policy makers
from both developed and developing cities should be open-minded
to introduce Rapid Transit System into their transit network, given
that Rapid Transit can largely improve the performance of their
services, as well as reducing inequalities in their cities (Lee & Miller,
2018; Pereira, 2019). Secondly, improving connectivity, as known as
the first mile/last mile problem, can help to increase the utilization
of public transit and reduce road traffic by cars. Multimodal
transportation involving bike, walk, and transit is not applicable to
Global South only, it can also be adopted in Global Norths, where
there are potentials in integrating bike-sharing system into the city’s
transportation system, under the model of mobility-as-a-service
(MaaS) (Radzimski & Dzięcielski, 2021). For Mobility-on-Demand
https://storymaps.arcgis.com/stories/bb048b3e875f4bafabb5d810c1bcccab/print 10/158/22/2021 #WesternUSRI2021 Conference: Research Output Showcase
(MoD) or ride hailing services like Uber and Lyft, while it may be
competitive with public transport in some circumstances, focus can
be put on their complementary effects to improve the mobility
situation in areas that are remote and having low public transit
demand (i.e. suburbs), that public transport may be comparative
expensive and inefficient to operate (Young et al., 2020). With the
development of autonomous vehicles, the operation cost of
mobility-on-demand can be even lower as they can be operated
without drivers, making autonomous mobility-on-demand services
to be a feasible solution to solve mobility problems in rural areas
(Sieber et al., 2020).
Conclusion
We have discussed on the purpose of GTFS in public transport and
its value in transportation research. Our demonstration also
showcased that pressing urban questions can be translated into
research easily thanks to the availability of open data like GTFS and
map data. Our review collection serves as a glimpse of possibilities
that GTFS can offer to researchers. We hope that more cities can
open their data to the public, so it can help researchers, students
and citizen science enthusiasts to study and to improve their cities.
References
Antrim, A., Qu, L., & Krambeck, H. (2017). Link repository for
international GTFS training materials. GitHub.
https://github.com/WorldBank-Transport/GTFS-Training-
Materials/wiki/Link-repository-for-international-GTFS-training-
materials
Bok, J., & Kwon, Y. (2016). Comparable measures of accessibility to
public transport using the general transit feed specification.
Sustainability (Switzerland), 8(3).
https://doi.org/10.3390/su8030224
Brussel, M., Zuidgeest, M., Pfeffer, K., & Van Maarseveen, M. (2019).
https://storymaps.arcgis.com/stories/bb048b3e875f4bafabb5d810c1bcccab/print 11/158/22/2021 #WesternUSRI2021 Conference: Research Output Showcase
Access or accessibility? A critique of the urban transport SDG
indicator. ISPRS International Journal of Geo-Information, 8(67), 1–
23. https://doi.org/10.3390/ijgi8020067
Eberhart, M. G., Share, A. M., Shpaner, M., & Brady, K. A. (2015).
Comparison of geographic methods to assess travel patterns of
persons diagnosed with HIV in Philadelphia: How close is close
enough? Journal of Biomedical Informatics, 53, 93–99.
https://doi.org/10.1016/j.jbi.2014.09.005
Farber, S., Morang, M. Z., & Widener, M. J. (2014). Temporal
variability in transit-based accessibility to supermarkets. Applied
Geography, 53, 149–159.
https://doi.org/10.1016/j.apgeog.2014.06.012
Goliszek, S., Połom, M., & Duma, P. (2020). Potential and cumulative
accessibility of workplaces by public transport in Szczecin. Bulletin
of Geography. Socio-Economic Series, 50, 133–146.
https://doi.org/10.2478/bog-2020-0037
GTFS.org. (2021a). General Transit Feed Specification Reference.
https://gtfs.org/reference/static
GTFS.org. (2021b). GTFS Background. https://gtfs.org/gtfs-
background/
Hyder, A., Lee, J., Dundon, A., Southerland, L. T., All, D., Hammond,
G., & Miller, H. J. (2021). Opioid Treatment Deserts: Concept
development and application in a US Midwestern urban county.
PLoS ONE, 16(5), 1–20.
https://doi.org/10.1371/journal.pone.0250324
Jomehpour Chahar Aman, J., & Smith-Colin, J. (2020). Transit
Deserts: Equity analysis of public transit accessibility. Journal of
Transport Geography, 89(March), 102869.
https://doi.org/10.1016/j.jtrangeo.2020.102869
Karner, A., & Rowangould, D. (2021). Access to Secure Ballot Drop-
https://storymaps.arcgis.com/stories/bb048b3e875f4bafabb5d810c1bcccab/print 12/158/22/2021 #WesternUSRI2021 Conference: Research Output Showcase
off Locations in Texas. Transport Findings, May, 1–5.
https://doi.org/10.32866/001c.24080
Kim, Y., Lee, J., Kim, J., & Nakajima, N. (2021). The Disparity in
Transit Travel Time between Koreans and Japanese in 1930s
Colonial Seoul. Transport Findings, July, 1–7.
https://doi.org/10.32866/001c.25226
Lee, J., & Miller, H. J. (2018). Measuring the impacts of new public
transit services on space-time accessibility: An analysis of transit
system redesign and new bus rapid transit in Columbus, Ohio, USA.
Applied Geography, 93, 47–63.
https://doi.org/10.1016/j.apgeog.2018.02.012
Li, T., & Dodson, J. (2020). Job growth, accessibility, and changing
commuting burden of employment centres in Melbourne. Journal of
Transport Geography, 88(102867), 1–11.
https://doi.org/10.1016/j.jtrangeo.2020.102867
Madill, R., Badland, H., Mavoa, S., & Giles-Corti, B. (2018).
Comparing private and public transport access to diabetic health
services across inner, middle, and outer suburbs of Melbourne,
Australia. BMC Health Services Research, 18(286), 1–13.
https://doi.org/10.1186/s12913-018-3079-9
McHugh, B. (2013). Pioneering Open Data Standards: The GTFS
Story. Beyond Transparency.
https://beyondtransparency.org/chapters/part-2/pioneering-open-
data-standards-the-gtfs-story/
OpenMobilityData. (2021). About OpenMobilityData.
http://transitfeeds.com/about
Pereira, R. H. M. (2018). Transport legacy of mega-events and the
redistribution of accessibility to urban destinations. Cities, 81, 45–60.
https://doi.org/10.1016/j.cities.2018.03.013
Pereira, R. H. M. (2019). Future accessibility impacts of transport
https://storymaps.arcgis.com/stories/bb048b3e875f4bafabb5d810c1bcccab/print 13/158/22/2021 #WesternUSRI2021 Conference: Research Output Showcase
policy scenarios: Equity and sensitivity to travel time thresholds for
Bus Rapid Transit expansion in Rio de Janeiro. Journal of Transport
Geography, 74, 321–332.
https://doi.org/10.1016/j.jtrangeo.2018.12.005
Pritchard, J. P., Tomasiello, D. B., Giannotti, M., & Geurs, K. (2019).
Potential impacts of bike-and-ride on job accessibility and spatial
equity in São Paulo, Brazil. Transportation Research Part A: Policy
and Practice, 121, 386–400.
https://doi.org/10.1016/j.tra.2019.01.022
Radzimski, A., & Dzięcielski, M. (2021). Exploring the relationship
between bike-sharing and public transport in Poznań, Poland.
Transportation Research Part A: Policy and Practice, 145, 189–202.
https://doi.org/10.1016/j.tra.2021.01.003
Sieber, L., Ruch, C., Hörl, S., Axhausen, K. W., & Frazzoli, E. (2020).
Improved public transportation in rural areas with self-driving cars:
A study on the operation of Swiss train lines. Transportation
Research Part A: Policy and Practice, 134, 35–51.
https://doi.org/10.1016/j.tra.2020.01.020
Slovic, A. D., Tomasiello, D. B., Giannotti, M., Andrade, M. de F., &
Nardocci, A. C. (2019). The long road to achieving equity: Job
accessibility restrictions and overlapping inequalities in the city of
São Paulo. Journal of Transport Geography, 78, 181–193.
https://doi.org/10.1016/j.jtrangeo.2019.06.003
Transitland. (2021). Transitland Operators.
https://www.transit.land/operators
Wachs, M., & Kumagai, T. G. (1973). Physical accessibility as a social
indicator. Socio-Economic Planning Sciences, 7(5), 437–456.
https://doi.org/10.1016/0038-0121(73)90041-4
Widener, M. J. (2017). Comparing Measures of Accessibility to
Urban Supermarkets for Transit and Auto Users. The Professional
https://storymaps.arcgis.com/stories/bb048b3e875f4bafabb5d810c1bcccab/print 14/158/22/2021 #WesternUSRI2021 Conference: Research Output Showcase
Geographer, 69(3), 362–371.
https://doi.org/10.1080/00330124.2016.1237293
Williams, S., White, A., Waiganjo, P., Orwa, D., & Klopp, J. (2015).
The digital matatu project: Using cell phones to create an open
source data for Nairobi’s semi-formal bus system. Journal of
Transport Geography, 49, 39–51.
https://doi.org/10.1016/j.jtrangeo.2015.10.005
Young, M., Allen, J., & Farber, S. (2020). Measuring when Uber
behaves as a substitute or supplement to transit: An examination of
travel-time differences in Toronto. Journal of Transport Geography,
82(102629), 1–11. https://doi.org/10.1016/j.jtrangeo.2019.102629
Acknowledgement
This project output is funded by Undergraduate Student Research Internships
(USRI) Program of Western University. The author would like to thanks Dr.
Jinhyung Lee (Assistant Professor, Geography) for his supervision.
https://storymaps.arcgis.com/stories/bb048b3e875f4bafabb5d810c1bcccab/print 15/15You can also read