Investor Presentation - March / April 2017 - The site can't be reached.
←
→
Page content transcription
If your browser does not render page correctly, please read the page content below
Investor Presentation
March / April 2017

GRAMMER GROUP – INVESTOR PRESENTATION
       Content

       1     GRAMMER at a Glance

       2     Strategic Roadmap for Profitable Growth & Value Generation

       3     Strategic Partnership GRAMMER & Ningbo Jifeng

       4     Outlook 2017

       A     Appendix

Copyright 2017 GRAMMER AG - Investor Presentation                         March / April 2017   Page 2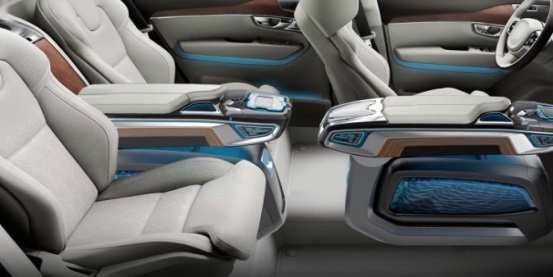
GRAMMER at a Glance

1    GRAMMER GROUP – KEY FACTS
       Leading global player in the automotive and commercial vehicle industry

  Group revenues by region and division (FY 2016)                                        Key OEM customers
              by region                                   by division                          Automotive        Commercial Vehicles
                                                Automotive
   EMEA                                         73%
   70%                            APAC
                                  15%

                                                                          Commercial
                            Americas                                      Vehicles
                            15%                                           27%

           Total: € 1.7 billion                           Total: € 1.7 billion

  Revenues by product segment (FY 2016)                                                  Key product segments
       Automotive*         Commercial Vehicles*                                                 Automotive       Commercial Vehicles
                              Headrests                                                                                     Offroad Seats
   Consoles                   37%                                                                   Headrests
   40%                                           Offroad
                                                                                 Truck
                                                 58%
                                                                                 26%
                                                                                                                                       Truck
                                                                                                    Consoles &                         Seats
                             Interior                                                               Armrests
                                                                          Railway
                             Components                         Others
           Others 13%                                                     8%
                             10%                                8%
                                                                                                    Interior               Railway Seats
           Total: € 1.3 billion                           Total: € 0.5 billion
                                                                                                    Components
  *) Group = Automotive + Commercial Vehicles - Consolidation

Copyright 2017 GRAMMER AG - Investor Presentation                                                                 March / April 2017      Page 4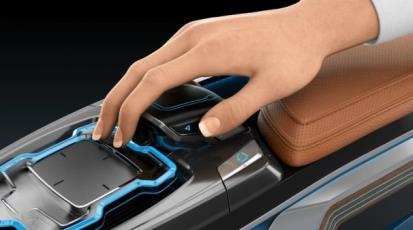
1    GRAMMER GROUP – GLOBAL FOOTPRINT
       Global production and R&D network on 4 continents

                                                    Europe
                                                    Locations: 26
   Americas                                                                     Asia / Pacific
                                                    Employees: 9,000
   Locations: 8                                                                 Locations: 7
                                                    Revenue:   €1,200 million
   Employees: 2,000                                                             Employees: 1,500
   Revenue:   €250 million                                                      Revenue:       €250 million

      Location with R&D activities

      Production

Copyright 2017 GRAMMER AG - Investor Presentation                                    March / April 2017       Page 5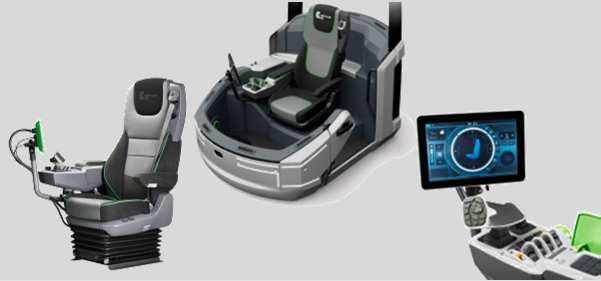
1    GRAMMER GROUP – LONG-TERM GROWTH
       Strong track record of global revenue growth

  Group revenues in € billion – 10 year development
                                                                                                            +19%

                                                                                                                   1.70

                                                                                                     1.43
                                                                                       1.37
                                                                                1.27

                                                                         1.13
                                                                  1.09
                       1.00           1.01
                                                           0.93
        0.89

                                                    0.72

        2006           2007           2008          2009   2010   2011   2012   2013   2014          2015          2016

Copyright 2017 GRAMMER AG - Investor Presentation                                             March / April 2017      Page 6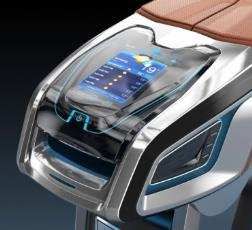
1    GRAMMER GROUP – KEY FIGURES 2016
       2016 performance proofs success of long-term profitable growth strategy

  Highlights 2016                                                        Group – Revenues & EBIT [in € million]
      Highest earnings in company history & 6th straight                            +19%                        +71%
      year with new sales record
                                                                                          1,696
      Group revenue climbed by 19% to 1.7 billion €,                        1,426
      mainly driven by Automotive division                                                                                   73.0

      71% increase in EBIT to 73 million € (2015: 43)                                                     42.7
                                                                                                                             4.3%
      EPS improved by 90% to 4.01 € (2015: 2.10)                                                          3.0%
      Record dividend of 1.30 € / share proposed
      Share price +70% in 2016, #1 in SDAX-index                             2015          2016          2015                2016

  Automotive – Revenues & EBIT [in € million]                            Commercial Vehicles – Revenues & EBIT [in € million]
                 +26%                                      +79%                     +3%                           +41%
                          1,271
         1,008                                                    42.5        458          474
                                                                                                                             39.1
                                                    23.8                                                  27.8
                                                                  3.3%                                                       8.3%
                                                    2.4%                                                  6.1%

         2015             2016                      2015          2016       2015          2016           2015               2016

Copyright 2017 GRAMMER AG - Investor Presentation                                                       March / April 2017          Page 7
1    GRAMMER AG – SHARE PRICE DEVELOPMENT
       Management has strongly increased shareholder value

      GRAMMER share price in €
       60

       50

       40

       30

       20
        Dec-15                          Mar-16                Jun-16                        Sep-16              Dec-16                          Mar-17

      Selected Broker Recommendations                         Top 5 Shareholders                     Basic Share Data
                                          Current   Current
               Broker         Date
                                         Recomm.     TP (€)   Halog*                       10.22%    ISIN                                DE000589540

      Bankhaus Lampe         2-Mar-17      Hold        52.0   Cascade*                     10.00%    WKN / Code                         589540 / GMM
      DZ Bank               22-Feb-17      Buy         65.0
                                                              Dimensional                   4.99%    Number of shares                         11,544,674
      Landesbank BW         15-Feb-17      Hold        60.0
                                                              Old Mutual Plc                3.07%    Market cap [Mar 20, 2017]               625 € million
      Baader-Helvea         14-Feb-17      Hold        55.0
                                                              Union Investment              3.07%    Ave. trading vol. (Xetra)     70,000 shares/day
      Montega               14-Feb-17      Hold        50.0

      Warburg Investment     9-Feb-17      Buy         63.0   Own Treasury Shares           2.86%    Ave. trading vol. (all exch.) 110,000 shares/day
      Quirin Bank            1-Feb-17      Buy         62.0
                                                                                                     Index         SDAX / DAXSector Automobiles
                                                               *) Companies owned by Hastor family
      Median                                           60.0

Copyright 2017 GRAMMER AG - Investor Presentation                                                                       March / April 2017           Page 8
Strategic Roadmap for
Profitable Growth & Value Generation
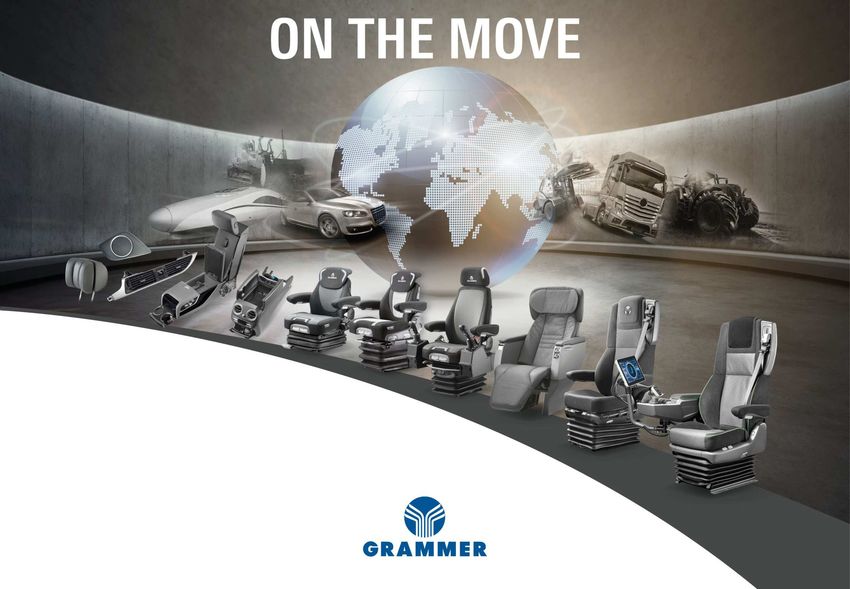
2    GRAMMER GROUP – ON THE MOVE
       Our strategic roadmap for driving profitable growth & value generation

        1 Driving Global Growth                           Global setup, innovative products &
                                                          strategic acquisitions build crucial basis
                                                          for future success

        2 Driving Innovations                             Strategic Partnership with Ningbo Jifeng
                                                          supports continuation of GRAMMER’s
                                                          successful global growth

        3 Driving Strategic Development                   Optimized processes and structures for
                                                          better cost base

                                                          GRAMMER Group is set for profitable
                                                          growth and strong value generation
        4 Driving Profitable Growth

Copyright 2017 GRAMMER AG - Investor Presentation                               March / April 2017   Page 10
2 GRAMMER GROUP – DRIVING GLOBAL GROWTH
GRAMMER to continue outpacing market growth
Global Growth 2016 – 2021e Regional Growth 2016 – 2021e Regional Sales Split
Global Car Production +11% EUROPE: 2021e
Car Production +7%
Automotive
GRAMMER Product Sales GRAMMER Product Sales: +10% EMEA
60% APAC
AMERICAS:
+30% 20%
Car Production +8%
GRAMMER Product Sales: >100%
Americas
ASIA: 20%
Car Production +14%
2016 2021e GRAMMER Product Sales: +30% Total: € 1.5 billion
Source: IHS
Global Growth 2016 – 2021e Regional Growth 2016 – 2021e Regional Sales Split
Commercial Vehicle
Global Truck Production +11% EUROPE: 2021e
Truck Production +21%
GRAMMER Product Sales GRAMMER Product Sales: +30% EMEA
55% APAC
AMERICAS:
20%
Truck Production +28%
+50% GRAMMER Product Sales: +85%
Americas
ASIA: 25%
Truck Production +2%
2016 2021e GRAMMER Product Sales: >100% Total: € 0.7 billion
Source: IHS
Copyright 2017 GRAMMER AG - Investor Presentation March / April 2017 Page 112 GRAMMER GROUP – DRIVING GLOBAL GROWTH
Impressive revenue growth to >2.2 billion € by 2021 expected
Group Revenue (IFRS) in € billion – Strategic Development until 2021e
>100%
growth >2.2
in 10 years >30%
>2.2
growth
in 5 years
1.7 1.7
1.1 1.1
2011 2016 2021e 2011 2016 2021e
Europe Americas APAC
Copyright 2017 GRAMMER AG - Investor Presentation March / April 2017 Page 122 GRAMMER GROUP – DRIVING INNOVATIONS
Business model disruption proof, with low risk execution
Global Megatrends Population Growth Mobility Food Demand Urbanization
Industry Megatrends Connectivity Autonomous Driving Shared Mobility Electric Vehicles
Autonomous Sensors/
High
Cameras/ Radar Technology
Displays,
Infotainment
Thermal/ HVAC Engine Components
(Replaced by Battery, Some Crossover
Interior Electronics in e.g., Converters)
Potential for new Entrants
Expand
know-how
`
Passive Safety
Transmission
Minimal threat / impact
Interior &
Body-in-White Brakes Axles/
Seating Exhausts
Drivetrain
Exteriors Lighting Chassis
Low
0% Loss / Change of Content 100%
GRAMMER’s product & innovation focus
GRAMMER’s technological strengths and experience around seating and interiors to remain critical in future vehicles
Copyright 2017 GRAMMER AG - Investor Presentation March / April 2017 Page 132 GRAMMER GROUP – DRIVING INNOVATIONS
Development focus secure our innovative leadership in interior & seating
HMI, Functional Comfort & Elegant &
Digital Interfaces Light Weight and Active & Passive
Surfaces & Ergonomics + Luxurious
& Sensors “Green” Materials Safety
Ambient Lighting Health Solutions Appearance
Interior as main differentiation Interior defines well-being and Massive upgrade & expansion
1 2 3
factor for the OEM comfort of driver/passenger of interior functionality
Superb comfort & luxurious appearance Optimized ergonomics and functionality Intuitive HMIs on functional surfaces
Genius Cab – innovative cabin interior Scientific research for comfort & safety Intelligent interior for all driving situations
Copyright 2017 GRAMMER AG - Investor Presentation March / April 2017 Page 142 GRAMMER GROUP – DRIVING CORPORATE DEVELOPMENT
Focused M&A strategy to enhance product portfolio, technology & profitability
1 GRAMMER’s M&A History
2011 EiA Electronics, Belgium Commercial Vehicles (Offroad) Expansion of electronic know-how
2012 Nectec, Czech Republic Automotive (Headrest) Additional safety technologies
2013 JV Jiangsu Yuhua, China Commercial Vehicles (Truck) Entry into Chinese truck market
2015 Reum Group, Germany & Poland Automotive (Consoles) Expansion of product & technology
2016 JV Shaanxi, China Commercial Vehicles (Truck) Secure growth in Chinese truck market
Successful M&A transactions and acquisitions in the past in all core product segments
2 GRAMMER’s M&A Transaction Scope
Larger M&A Deals Midsize M&A Deals Smaller M&A Deals
Purchase price Purchase price Purchase price
> €500 million €100 to 500 million < €100 million
GRAMMER’s M&A radar focused on smaller/midsize targets
to strengthen regional and innovative position
Adequate firepower of approx. € 150-250 m. for M&A strategy w/o deterioration in credit metrics & covenant breach
Additional financial headroom due to proceeds from Ningbo Jifeng’s investment
Copyright 2017 GRAMMER AG - Investor Presentation March / April 2017 Page 152 GRAMMER GROUP – DRIVING PROFITABLE GROWTH
Lower footprint costs, better cost base and volume impact drive EBIT
Performance in 2016 sets base for further strong profitability improvement
2017 target already within reach EBIT Margin
(2016 EBIT Margin at 4.3%) ~5%
EBIT Margin
3.0%
EBIT Lower foot- Brazil loss Automotive Seating Systems EBIT Target
2015 print costs reduction volume volume 2017
Main EBIT driver Automotive Division:
Reduction of footprint costs combined with improved cost base will generate better incremental profits from higher volumes
Main EBIT driver Seating Systems Division:
Reduction of Brazilian loss situation and slight volume improvement in offroad markets will result in margin upside
Copyright 2017 GRAMMER AG - Investor Presentation March / April 2017 Page 162 GRAMMER GROUP – DRIVING PROFITABLE GROWTH
Best-in-class growth among peers, profitability in line with strong potential
GRAMMER operational performance vs. interior & seating peers
5-years Sales CAGR (2012–2016) 2016 EBIT Margin
10.6%
10.1%
7.9%
~7%
6.8%
Future Potential
Median: 5.7%
4.7%
5.2% 5.1%
Median: 4.7%
4.2%
3.8%
4.3%
-4.2%
-6.3%
Grammer Boshoku Lear - Faurecia - Adient CVG - Truck Grammer Lear - Faurecia - Adient Boshoku CVG - Truck
Seating Automotive & Bus Seating Automotive & Bus
Seating & Seating &
Seating Seating Seating Seating
Interiors Interiors
*) Peer divisional metrics exclude corporate costs
Copyright 2017 GRAMMER AG - Investor Presentation March / April 2017 Page 172 GRAMMER GROUP – DRIVING PROFITABLE GROWTH
Higher profitability based on cost optimization & active portfolio management
GRAMMER revenues and profitability roadmap by product segment
GRAMMER today: EBIT ~5% GRAMMER’s future potential: EBIT ~7%
8% - 10%
EBIT Profitability by Product Segment
Sales
Sales 200 € m.
Sales 700 € m.
475 € m. New
Segment
Sales 300 € m.
5% - 7%
150 € m.
Option:
Sales Portfolio Mgmt
700 € m.
Sales Sales
2% - 4%
550 € m. Sales 600 € m.
525 € m.
Commercial Interior Commercial Interior
Consoles Headrests Consoles Headrests
Vehicles Components Vehicles Components
Commercial Vehicles: Recovery of profitable market segments. Higher value due to functional (e.g. electronics) integration
Future
Interior Components: Further synergies with GRAMMER Group. Global growth within GRAMMER’s existing infrastructure
EBIT
Consoles: Higher maturity of plants & products. Higher R&D efficiency and higher value due to functional integration
Drivers
Headrests: Ongoing consequent cost optimization & production transfers. Plus: active portfolio management (JV China / M&A)
Copyright 2017 GRAMMER AG - Investor Presentation March / April 2017 Page 18Strategic Partnership GRAMMER & Ningbo Jifeng
3    GRAMMER GROUP – STRATEGIC PARTNERSHIP NINGBO JIFENG
       Highlights & core elements

               Compelling industrial logic & value creation potential due to complementary geographic focus
       1       and product offering

               Subscription of 60 million € mandatory convertible bond by Ningbo Jifeng’s associated company,
       2       representing ca. 9.2% of shares outstanding and enlarges the shareholder base of GRAMMER

               Reinforcement of GRAMMER’s shareholder structure as Ningbo Jifeng’s associated company
       3       to become a long-term shareholder of GRAMMER AG

               Envisaged future joint venture(s) and shared projects in China and other markets between
       4       GRAMMER and Ningbo Jifeng

      This strategic alliance will:
         expand GRAMMER’s market presence & customer penetration in the largest car market of the world
         support the continuation of GRAMMER’s successful growth and innovation strategy
         help to secure GRAMMER’s business relations with key customers
         secure the future growth and enhance the value of both companies

Copyright 2017 GRAMMER AG - Investor Presentation                                           March / April 2017   Page 20
3 GRAMMER GROUP – STRATEGIC PARTNERSHIP NINGBO JIFENG
Compelling industrial logic & value creation potentialOutlook 2017
4    GRAMMER GROUP – MARKET OUTLOOK 2017
       Global car & truck markets with solid growth. Brazil to recover in 2017

  Car production – Actual 2016 & Forecast 2017                                          Truck production – Actual 2016 & Forecast 2017
  [in % yoy]                                                                            [Trucks >6t, in % yoy]
                           Actual    Forecast                                                                    Actual     Forecast
                            2016       2017                                                                       2016        2017

       Europe                                   +3%                  +2%                    Europe                                   +3%                  +1%

       USA                                      +2%                  -1%                    USA                                     -11%                  +4%

       Brazil                                  -11%                +10%                     Brazil                                  -20%                  +10%

       China                                  +14%                   +3%                    China                                  +24%                   +7%

       World                                    +5%                  +2%                    World                                    +6%                  +4%
       Source: IHS, Feb. 2017                                                              Source: IHS, Jan. 2017

  Agricultural
   xxx         market outlook 2017 by our main customers
                                                     ^^
   xxx                             Europe               North America                                                              South America
       John Deere*                                       0% to -5%                          -5% to -10%                             +15% to +20%
       AGCO Group**                                      0% to -5%                          -5% to -10%                                    +10%
       Source: *) John Deere Q1 2017 (17.02.2017) **) AGCO Group Q4 2016 (07.02.2017)    Source: John Deere, website, AGCO Group website

Copyright 2017 GRAMMER AG - Investor Presentation                                                                                    March / April 2017      Page 23
4 GRAMMER GROUP – COMPANY OUTLOOK 2017
Further growth of revenue & profitability expected. 5% operational EBIT
GRAMMER Group – Outlook:
At Group level GRAMMER forecasts a moderate increase in revenue to more than 1.75 billion € in 2017
As communicated, a Group operational EBIT margin of around 5% is expected in 2017
Potential risk in case of change-of-control intended by investment company of Hastor family:
Minority shareholder Cascade International Investment GmbH is seeking a change of control in
GRAMMER AG’s currently independent governance bodies
If successful, this potential change of control could have an adverse effect on customer relations
In this case GRAMMER cannot exclude the possibility of existential risks to future order intake
Copyright 2017 GRAMMER AG - Investor Presentation March / April 2017 Page 24Appendix
A     GRAMMER GROUP – APPENDIX
       Financial calendar and IR contact

  Financial Calendar 2017                                          Investor Relations Contact

  Interim Management                                               Ralf Hoppe
                                                                   VP Investor Relations, Communications,
  Statements Q1 / 2017                         May 15, 2017        Marketing & Strategic Product Planning

  Annual General Meeting                       May 24, 2017
                                                                   Phone:     +49 (0)9621 66 2200
  Interim Report Q2 / 2017                     August 09, 2017     Fax:       +49 (0)9621 66 32200
                                                                   Email:     investor-relations@grammer.com
  Interim Management                                               Internet: www.grammer.com/investor-relations
  Statements Q3 / 2017                         November 13, 2017

Copyright 2017 GRAMMER AG - Investor Presentation                                                    March / April 2017   Page 26
A GRAMMER GROUP – INFORMATION ON NINGBO JIFENG
Corporate Overview
Company Description Revenue Development
Ningbo Jifeng specializes in automotive headrest assembly, € MM
armrest assembly, headrest stems and door stems
Main products consist of passenger car seat headrests,
headrest struts, seat armrests and other automotive seating 140
136
components
Its products are mainly used in the passenger car industry 101
Main customers include Lear, Adient (formerly Johnson 69
Controls) and Faurecia
Production facilities in China (Ningbo, Changchun, Shenyang,
Wuhan, Chengdu, Liuzhou, and Guangzhou) and in Ceská
2012A 2013A 2014A 2015A
Lípa, Czech Republic, with a total of ~2,600 employees
Revenue Split 2015A Top Customers
Seat Manufacturers Car Manufacturers
By Product By Geography
Other
Foreign
Headrest 8%
13%
Rods
10%
Armrests Headrests Domestic
29% 53% 87%
)
Copyright 2017 GRAMMER AG - Investor Presentation March / April 2017 Page 27A GRAMMER GROUP – INFORMATION ON NINGBO JIFENG
Overview of the Chinese automotive market
Market Key Facts China Automotive Interior Market (07A–30E)
Volume (MM Units)
Largest market world-wide for 186
175
commercial vehicles & cars 158
145 152 CAGR CAGR
125 135 92 (15A-20E) (15A-30E)
Strong forecast volume growth 114 89
100 108 78 81
in seating and interiors market 79 81 86 74
64 69 6.7% 3.3%
60 52 56 59
38 40 41 42 45
Increasing wealth and 31 94
66 70 74 77 87 6.6% 3.1%
economic growth driving
20 21
29 38 39 41 48 52 55 61
18 19
demand for greater content 07A 08A 09A 10A 11A 12A 13A 14A 15A 16E 17E 18E 19E 20E 25E 30E
per vehicle Cockpits, Instrumentation & Door Modules Seating
China Light Vehicle Sales (10A-22E) Seating Markets: Size, Growth, Content/Vehicle
Volume (MM units) US$ Content per Vehicle
1.200
30 31 31 Americas,
27 29 $20 Bn China,
27 27
24 800 $14 Bn
23 Europe,
21 APAC,
17 17 18 $15 Bn
400 $11 Bn
0
10A 12A 14A 16E 18E 20E 22E 0,0 2,0 4,0 6,0
Estimated 2015–19E Seating Industry CAGR (%)
Sources: Just-Auto, IHS, Broker Reports
Copyright 2017 GRAMMER AG - Investor Presentation March / April 2017 Page 28A GRAMMER GROUP – APPENDIX
Key figures full year 2016 and Q4 2016
[IFRS, in € million] 1-12 2016 1-12 2015 Chg. Q4 2016 Q4 2015 Chg.
Group Revenues 1,695.5 1,425.7 +18.9% 430.2 369.7 +16.4%
EBITDA 120.2 83.2 44.5% 35.0 24.3 44.0%
EBITDA-Margin 7.1% 5.8% 1.3%-P 8.1% 6.6% 1.5%-P
EBIT 73.0 42.7 71.0% 23.4 13.0 79.0%
EBIT-Margin 4.3% 3.0% 1.3%-P 5.4% 3.5% 1.9%-P
Operating EBIT 68.1 39.0 74.6% 20.6 12.3 67.5%
Operating EBIT-Margin 4.0% 2.7% 1.3%-P 4.8% 3.3% 1.5%-P
Profit after taxes 45.2 23.8 89.9% 19.6 7.1 176.1%
EPS in € 4.01 2.10 91.0% 1.74 0.63 176.2%
Total Assets 1,050.6 992.1 5.9% 1,050.6 992.1 5.9%
Equity 271.2 253.4 7.0% 271.2 253.4 7.0%
Equity-Ratio 26% 26% 0%-P 26% 26% 0%-P
Net Financial Debt 139.1 155.5 -10.5% 139.1 155.5 19.5%
Gearing Ratio 51% 61% -10%-P 51% 61% 10%-P
Capex (w/o M&A) 56.2 47.9 17.3% 22.1 22.9 -3.5%
Depreciation 47.2 40.5 16.5% 11.6 11.3 2.7%
Employees (month-end) 12,250 11,397 7.5% 12,250 11,397 7.5%
Copyright 2017 GRAMMER AG - Investor Presentation March / April 2017 Page 29A GRAMMER GROUP – APPENDIX
Financial key figures 5-year overview
[IFRS, in € million] 2016 2015 2014 2013 2012
Group Revenue 1,695.5 1,425.7 1,365.9 1,265.7 1,133.0
EBITDA 120.2 83.2 93.7 92.3 78.1
EBITDA-Margin 7.1% 5.8% 6.9% 7.3% 6.9%
EBIT 73.0 42.7 57.0 58.0 49.0
EBIT-Margin 4.3% 3.0% 4.2% 4.6% 4.3%
Profit after taxes 45.2 23.8 33.6 29.6 26.8
EPS in € 4.01 2.10 3.09 2.67 2.38
Dividend / Share in € 1.30* 0.75 0.75 0.65 0.50
Total Assets 1,050.6 992.1 836.5 766.0 668.8
Equity 271.2 253.4 231.8 224.7 210.3
Equity-Ratio 26% 26% 28% 29% 31%
Net Financial Debt 139.1 155.5 86.7 93.2 76.5
Gearing Ratio 51% 61% 37% 41% 36%
Capex (w/o M&A) 56.2 47.9 51.5 46.8 39.0
Depreciation 47.2 40.5 36.7 34.3 29.1
Employees (Dec. 31) 12,250 11,397 10,700 10,082 8,620 *) proposed
)
Copyright 2017 GRAMMER AG - Investor Presentation March / April 2017 Page 30GRAMMER GROUP Legal disclaimer By attending the presentation to which this document relates or by accepting this document and not immediately returning it, you agree to be bound to the following limitations: This presentation and the topics addressed therein have been compiled for discussion purposes only and are not intended to be a comprehensive summary of all business, financial, legal, practical and other aspects or to cover all issues relating to an investment in GRAMMER AG. A binding commitment will only result from a definitive and binding agreement. This presentation does not constitute or form part of, and should not be construed as, an offer to sell or a solicitation of an offer to buy or subscribe for any securities and neither this presentation nor anything contained herein shall act as an inducement to enter into or form the basis of, or be relied on in connection with, any offer or contract or commitment whatsoever. This presentation does not constitute an offer for sale of any securities in the United States. Neither this presentation nor any copy of it may be taken or transmitted in or into the United States of America, its territories or possessions or distributed, directly and indirectly, in the United States of America, its territories and possessions or to U.S. Persons (as such term is defined in Regulation S under the Securities Act). Any failure to comply with this restriction may constitute a violation of U.S. securities laws. Neither this presentation nor any copy of it may be taken or transmitted in or into Australia, Canada or Japan or distributed, directly and indirectly, in Australia, Canada or Japan. The distribution of this presentation in other jurisdictions may be restricted by law and persons into whose possession this presentation comes should inform themselves about, and observe, any such restrictions. This presentation contains estimates, forecasts and expectations. Such estimates, forecasts and expectations are subject to risks and elements of uncertainty that could result in deviation of actual developments from expected developments. The estimates, forecasts and expectations are only valid at the time of publication and there can be no assurance that future results or events will be consistent with any such estimates, forecasts or expectations. GRAMMER AG does not intend to update any such estimates, forecasts or expectations and assumes no obligation to do so. GRAMMER AG does not assume any liability for the statements made. Neither GRAMMER AG nor any of its respective directors, officers, or employees nor any other person accept – to the extent legally possible – any liability for any loss howsoever arising from any use of this presentation or its contents or otherwise in connection therewith. Please take appropriate advice before applying anything contained in these materials to specific issues or transactions. This presentation is confidential and is being supplied to you solely for your information and may not be reproduced, redistributed or passed on to any other person or published, in whole or in part, for any purpose. This presentation or any copy of it may not be distributed to any third party, including the media or the press. Copyright 2017 GRAMMER AG - Investor Presentation March / April 2017 Page 31
You can also read