POLICY BASED INVESTING - RealClear
←
→
Page content transcription
If your browser does not render page correctly, please read the page content below
May 4, 2020
POLICY BASED INVESTING
                                                          RISK ON

Future economic growth expectations are either rising or falling at any given time. Equity markets historically
have a solid track record of predicting future growth patterns resulting from present government economic
policy actions. Capital flows into a country’s equity markets when a policy shift lifts future growth
expectations, and capital flows out of a country’s equity markets when a policy shift diminishes future growth
expectations.

As reflected in our “Policy Map” there are two asset
classes (Equities and Real Estate) that attract capital
when higher growth is expected and two asset classes
(Bonds and Gold) that attract capital when lower
growth is expected. These groups can be simplified
in “Risk-On” and “Risk-Off” assets.

While news of COVID-19’s health impact is
improving, news of the shutdown’s economic impact
continues to worsen. We won’t regurgitate the poor
economic data here, but unemployment and
business data are bad and likely to worsen over the
next few months. This is precisely why we are so
encouraged that capital flows are sending an
optimistic signal at a time when the news and
economic data paint a dismal picture.

From February 23rd through March 23rd there was
an explosion in the relative performance of risk-off
assets versus risk-on assets. Capital poured into the
safety of bonds and gold as the coronavirus created
unknowable threats. In those early, dark days it was totally unclear how fast and far the virus would spread,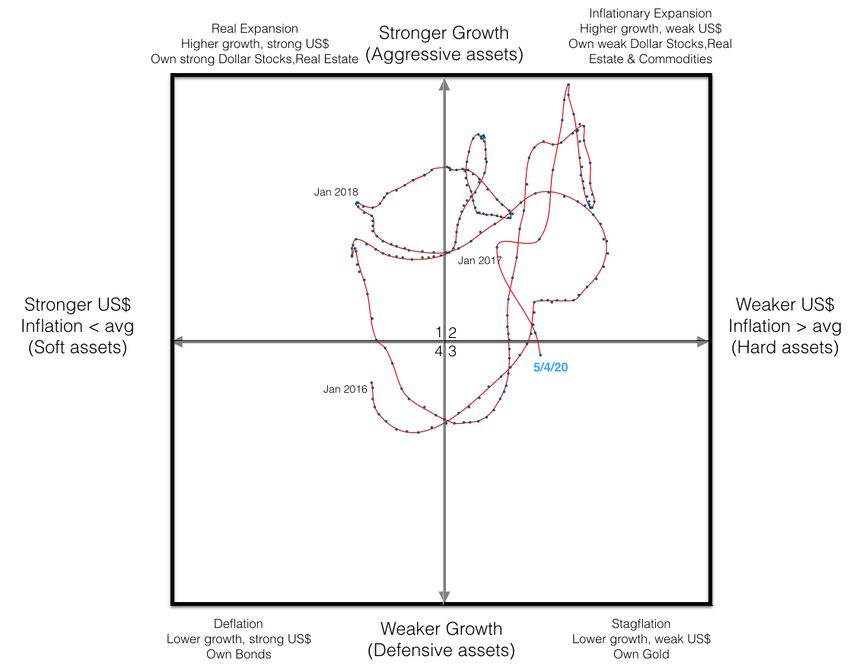
May 4, 2020
POLICY BASED INVESTING
how many would die, if economies would be shut down and, if so, for how long. As is usually the case, markets
abhorred the uncertainty.

With time and unstoppable effort from the world’s best and brightest scientists, healthcare professionals and
entrepreneurs that unknowable future started becoming more knowable. Capital markets, being the world’s
best aggregators of information, responded accordingly. Since March 23rd risk-on U.S. equities have
consistently been outperforming both risk-off asset classes. This pattern holds true for the second U.S. risk-on
asset class, real estate. U.S. REITS have been attracting capital versus risk-off assets over the same time
period.

We don’t attempt to predict markets. We listen to them in an attempt to assess if the underlying policy forces
moving markets are durable. When capital flows risk-on at the same time as conventional wisdom in the press
is uniformly risk-off, we side with markets.

The virus’ trajectory and mortality patterns are becoming known, treatments and vaccines are progressing and
states are implementing plans to reopen economic activity. The Committee to Unleash Prosperity along with
FreedomWorks today released a response scorecard on how the nation’s governors are handling the reopening
of their state’s economies to business and recreational activities. The report grades the nation’s governors on
how they have and are continuing to respond to the coronavirus. Taking into account the severity of the virus
in each state and the need to keep their citizens safe and healthy, the report assesses how measured or
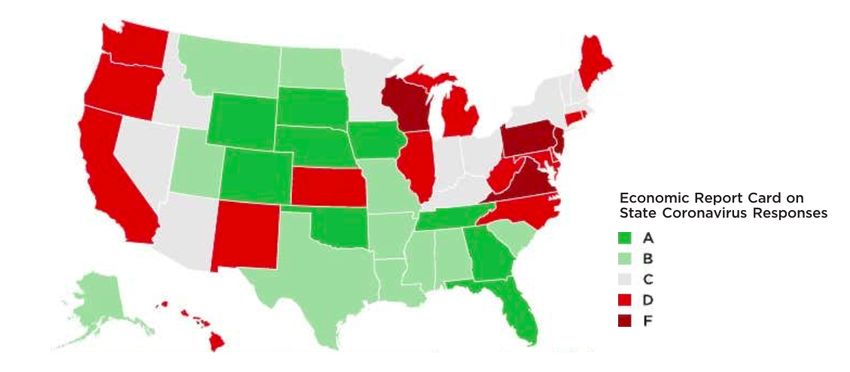
May 4, 2020
POLICY BASED INVESTING
damaging their actions have been with respect to safeguarding the economic well-being of their citizens. It
examines lockdown orders, business closures, hospital and outdoor activity orders, and the degree of punitive
actions on enforcing these measures. Most importantly, the report measures the start dates for reopening in
each state as the evidence is very strong that states with late start dates will have much more severe recessions
than states that open earlier. The following graphic is pulled from that report, and we urge you to read the full
analysis here:
https://www.scribd.com/document/459799071/Governors-Report-Card#fullscreen&from_embed

Totally consistent with the dynamism of our U.S. economy, the report card is a mix of excellent and poor
economic responses. Despite the doom and gloom reported, it’s clear that many states are acting effectively to
reopen and restore growth. The green states on this chart are the likely reason capital markets have been
moving risk-on for over a month now.
May 4, 2020
POLICY BASED INVESTING
                                                      ALLOCATOR

                                                       Fixed Income

Bonds are an asset class that does well in a deflationary policy environment (Low Growth & Strong Currency)

We have long said the Treasury bond bubble will pop again as it did from May2013-Jan2014 when long term Treasury
bonds fell 18%. With voters choosing Trump’s pro-growth agenda to ignite growth, we believe the this is even more
likely. Treasury bond prices are at risk to fall 30-50%, and we expect any moves higher in bond prices (lower in yields)
to be short-lived. Since most other bonds price off of Treasury yields, fixed income in general is a risky asset class.

        Asset          ETF       Action Date       Current   % Gain/Loss                         Policy Notes
                              Red Sell/Green Buy    Price

  Investment Grade     LQD    9/9/2016   $119.00   $128.34      7.8%

   Aggregate Bond      AGG    9/9/2016   $109.00   $116.87      7.2%

      Municipal        MUB    9/9/2016   $111.00   $111.57      0.5%

        TIPS            TIP   9/9/2016   $114.00   $121.01      6.1%

  Extended Duration    EDV    9/9/2016   $128.00   $172.06     34.4%

  US Treasury 3-7 yr    IEI   9/9/2016   $124.00   $133.22      7.4%

 US Treasury 7-10 yr    IEF   9/9/2016   $109.00   $121.71     11.7%

  US Treasury 20+ yr   TLT    9/9/2016   $133.00   $167.95     26.3%

International Total Bond BNDX 9/9/2016   $54.40    $57.18       5.1%

      High Yield       HYG 4/12/2016     $77.00    $78.68       2.2%       Act more like equities than bonds, benefit from improving
                                                                           growth
May 4, 2020
POLICY BASED INVESTING
ALLOCATOR
Commodities
A change in the price of gold is a change in the value of the currency. When gold rises, the currency’s value falls and
vice versa. Commodities are an asset class that does well when the currency is weak. If growth is slowing while the
currency weakens, there is stagflation. Own precious metals. If growth is accelerating while the currency weakens,
there is an inflationary expansion. Own agriculture, industrial and energy commodities.
Commodities suffered heavy losses in the strong US Dollar environment 2012-2015. In 2016 Dollar weakness was
caused by election uncertainty and commodities rallied. That weak Dollar trend was reversed by Election2016.
Gold’s recent rise has been driven by a general “risk-off” stance, caused in large part by fear about coronavirus impact
on global trade/supply chains coupled with Bernie Sanders’ rising odds to capture the DNC nomination. We expect
these fears to be transitory throughout 2020, especially since we do no believe Sanders’ policy menu can win the
country. At this time the move up in gold is not, in our assessment, connected to worsening domestic economic
policies that would cause a flight out of Dollars. However, we cannot ignore the market based signal of gold moving to
new highs.
Asset ETF Action Date Current Price % Gain/Loss Policy Notes
Red Sell/Green Buy
Gold GLD 2/18/2020 $150.91 $159.78 5.9% Safe haven rush into precious metal
Silver SLV 2/18/2020 $17.01 $13.92 -18.2%
Energy DBE 8/13/2014 $28.97 $7.39 -74.5%
Oil USO 7/30/2014 $37.00 $18.86 -49.0%
Agriculture DBA 9/13/2011 $32.50 $13.73 -57.8%
Broad Comm. Index GSG 8/5/2011 $33.00 $8.48 -74.3%
Base Metals DBB 6/17/2011 $23.00 $12.34 -46.3%May 4, 2020
POLICY BASED INVESTING
ALLOCATOR
Real Estate
Real Estate is an asset class that performs well when growth is accelerating. When rising growth is coupled with a
strong currency, own real estate tied to business activity (like commercial REITS). When rising growth is coupled with
a weak currency, own real estate tied to commodities (farmland).
Commercial RE will be helped by improving real economic growth. RE properties leveraged to businesses & economic
growth are preferred under pro-growth US policies.
Asset ETF Action Date Current % Gain/ Policy Notes
Red Sell/Green Buy Price Loss
Residential REZ 12/21/2016 $61.00 $56.50 -7.4%
Building/Construction ITB 12/21/2016 $28.00 $35.82 27.9%
Mortgage REIT REM 4/1/2016 $35.00 $21.50 -38.6%
REIT VNQ 3/7/2016 $75.50 $73.54 -2.6%May 4, 2020
POLICY BASED INVESTING
ALLOCATOR
US Equity
We have been waiting for a 1980s/90s type of policy driven equity bull market for sixteen years. The 2014 midterm
House/Senate/gubernatorial election shifts put us on the path as pro-growth candidates propelled the GOP to majorities.
It was a repudiation of anti-growth economic policies and a big step toward a Reagan/Clinton type of equity bull
market. Despite the voters’ growth signal, Obama doubled down on his tax/spend/regulatory (EPA) agendas in 2015
causing stocks to be range bound and volatile. As 2016 began, policy uncertainty ahead of November’s elections
became the biggest threat to equities. The ebb and flow of the presidential political season moved markets in both
directions as investors waited to learn which policy theme would prevail in November – growth vs. redistribution.
Voters decisively made their choice in Election2016, and growth won. Trump’s pro-growth policy agenda beat Hillary’s
anti-growth policy agenda in landslide fashion. Republicans retained control of the Senate, House and increased their
control of governorships by three. The policy stage is now set for Trump and Congress to keep delivering pro-growth
tax, regulatory and monetary policies. As they do, a bull market in U.S. equities will ignite to rival the 1980s/90s
US Equity - Cap Size
Asset ETF Action Date Current Price % Gain/Loss Policy Notes
Red Sell/Green Buy
Micro IWC 7/11/2016 $72.00 $74.57 3.6%
Total Market IWV 5/19/2016 $117.00 $163.11 39.4%
Large IWB 5/19/2016 $111.00 $155.87 40.4%
Small Cap IJR 5/19/2016 $54.00 $60.74 12.5%
Mid Cap IWR 4/6/2016 $38.57 $47.82 24.0%May 4, 2020
POLICY BASED INVESTING
US Equity - Style
Asset ETF Action Date Current % Gain/Loss Policy Notes
Red Sell/Green Buy Price
Large Growth IWF 7/11/2016 $101.00 $168.25 66.6%
Small Growth IWO 7/11/2016 $140.00 $175.58 25.4%
Small Value IWN 5/19/2016 $92.00 $88.56 -3.7%
Mid Growth IWP 5/9/2016 $90.00 $136.75 51.9%
Large Value IWD 4/6/2016 $95.00 $107.01 12.6%
Mid Value IWS 4/6/2016 $68.00 $70.02 3.0%
US Equity - Sector
Asset ETF Action Date Current % Gain/Loss Policy Notes
Red Sell/Green Buy Price
Staples XLP 6/5/2017 $57.00 $57.62 1.1%
Utilities XLU 6/5/2017 $54.00 $55.88 3.5%
Metals/Mining XME 5/8/2017 $29.00 $18.90 -34.8% Tied to commodity prices, hurt by strong Dollar
Energy XLE 3/13/2017 $69.00 $35.85 -48.0% Tied to commodity prices, hurt by strong Dollar
Healthcare XLV 2/8/2017 $71.00 $97.83 37.8%
Discretionary XLY 11/14/2016 $79.00 $112.24 42.1%
Financial XLF 7/18/2016 $19.00 $22.06 16.1% Helped by Trump deregulation (Dodd Frank)
Materials XLB 4/6/2016 $44.00 $50.79 15.4%
Industrial XLI 3/14/2016 $52.00 $62.27 19.8%
Technology XLK 3/7/2016 $41.00 $88.90 116.8% Repatriation tax reform huge plus for tech companiesMay 4, 2020
POLICY BASED INVESTING
Foreign Equity
Country ETF Action Date Current % Gain/Loss Policy Notes
Red Sell/Green Buy Price
China FXI 8/5/2019 $39.86 $37.27 -6.50% China’s currency devaluation policy is a growth killer
Hong Kong EWH 7/6/2016 $24.08 $20.55 -14.66%
Mexico EWW 10/1/2018 $51.23 $28.10 -45.15% Freer and fairer trade agreements are pro-growth for all parties
involved
Canada EWC 10/1/2018 $28.78 $23.74 -17.51%
Denmark EDEN 7/2/2018 $63.89 $64.87 1.53% European polices not improvng despite anti-austerity movements
across the Euro Zone. Capital is fleeing. A zero trariff trade deal
Switzerland EWL 7/2/2018 $32.58 $36.39 11.69% with the U.S. would reverse course and be very pro-growth for
European economies.
Netherlands EWN 7/2/2018 $30.51 $27.80 -8.88%
Sweden EWD 7/2/2018 $30.51 $26.67 -12.59%
Eurozone EZU 7/2/2018 $41.01 $31.75 -22.58%
Spain EWP 7/2/2018 $30.35 $20.37 -32.88%
Poland EPOL 7/2/2018 $21.78 $14.49 -33.47%
France EWQ 7/2/2018 $30.52 $24.01 -21.33%
Germany EWG 7/2/2018 $29.98 $23.07 -23.05%
Italy EWI 7/2/2018 $28.89 $20.72 -28.28%
Austria EWO 7/2/2018 $22.65 $14.16 -37.48%
Israel EIS 2/26/2018 $52.41 $48.70 -7.08%
Vietnam VNM 10/9/2017 $14.99 $11.92 -20.48% Demographic leverage to US economic growth policies
Indonesia EIDO 7/24/2017 $26.78 $15.55 -41.93% Demographic leverage to US economic growth policies
Ireland EIRL 1/26/2017 $39.00 $33.97 -12.90%
Singapore EWS 1/11/2017 $21.00 $17.96 -14.48%
World Ex US VEU 11/15/2016 $43.50 $42.69 -1.86% Global growth reset higher after US Election2016
Norway ENOR 8/20/2016 $20.00 $16.97 -15.15%
UK EWU 8/4/2016 $30.50 $24.59 -19.38% Brexit was a vote for growthMay 4, 2020 POLICY BASED INVESTING Finland EFNL 7/26/2016 $33.00 $32.43 -1.73% Japan EWJ 7/15/2016 $47.00 $50.85 8.19% Trade deal with U.S. is pro-growth South Korea EWY 7/13/2016 $52.00 $49.84 -4.15% Hong Kong EWH 7/6/2016 $19.00 $20.55 8.16% Peru EPU 6/29/2016 $30.50 $24.87 -18.46% South Africa EZA 6/29/2016 $51.00 $30.41 -40.37% India EPI 6/27/2016 $19.00 $17.65 -7.11% Strong Dollar emerging market, tied to US growth Taiwan EWT 6/21/2016 $27.00 $36.01 33.37% Thailand THD 5/20/2016 $64.00 $63.08 -1.44% Belgium EWK 3/16/2016 $16.50 $15.20 -7.88% New Zealand ENZL 3/5/2016 $36.00 $47.83 32.86% Philippines EPHE 8/5/2015 $37.00 $23.36 -36.86% Qatar QAT 12/1/2014 $24.00 $15.75 -34.37% Malysia EWM 10/3/2014 $41.00 $23.02 -43.85% Australia EWA 9/16/2014 $22.50 $16.19 -28.04% Greece GREK 7/14/2014 $20.00 $18.15 -9.25% Portugal PGAL 6/4/2014 $15.00 $8.53 -43.13% Columbia ICOL 6/27/2013 $21.00 $7.67 -63.48% Turkey TUR 6/1/2013 $58.00 $19.32 -66.69% UAE UAE 5/20/2013 $23.00 $10.31 -55.17% Russia RSX 8/7/2011 $30.00 $19.97 -33.43% Weak Dollar emerging market Brazil EWZ 7/14/2011 $60.00 $23.58 -60.70% Weak Dollar emerging market Chile ECH 3/1/2011 $61.00 $24.65 -59.59% Egypt EGPT 2/23/2004 $64.00 $23.19 -63.77%
May 4, 2020
POLICY BASED INVESTING
                                                 POLICY MAP

Growth decreased versus last week (-0.45 to
-0.58):      Despite pro-growth tax and
regulatory policy improvements since 2016,
growth has tipped into negative territory
from a COVID-19 caused economic
shutdown. The Fed is providing unlimited
liquidity to prevent a solvency crisis during
the first even intentional recession in
history. ]

Value of US$ decreased versus last week
(1.04 to 1.08): Dollar had been stable
between gold $1,300-$1,375/oz, and
strengthened to $1,230/oz. giving the Fed a
strong Dollar signal to pause rate hikes until
economic and market data calm down.
Recent Dollar weakness above $1,400 is
concerning but likely has some likely
temporary drivers like Coronavirus and
threat of an anti-growth DNC policy agenda
post 2020. The longer the U.S. economy
remains shut down, the weaker the U.S. will
become.
May 4, 2020
POLICY BASED INVESTING
BOND YIELD COMPONENT ANALYSIS
Nominal Yield: 0.64% (+7%) Inflation Expectation Component: 1.07% (-4%) Real Growth Component: -0.43% (-16%)
Bond market expectations for both real growth and inflation have collapsed. Before recently, the collapse in real growth had been
largely caused by global bond market dynamics with negative interest rates across the globe. But now slow growth fears have come
to the U.S. A domestic “shutdown” caused by COVID-19 weighs heavily on near term growth. Economic slowdown, even if it’s
short, makes post-2020 election policy highly uncertain. The Federal Reserve is doing what it needs to do by providing sufficient
liquidity to the banking system. Fiscal policy is the next policy lever to be pulled to counteract negative economic effects of a
COVID-19 caused economic shutdown. So far, the first “stimulus” bill passed offers no pro-growth solutions to get the supply side of
the economy turned back on.
4.00
3.00
2.00
1.00
0.00
-1.00
9/
9/
9/
9/
9/
9/
9/
9/
9/
9/
4/
16
15
13
16
16
15
14
14
13
13
30
/2
/2
/2
/2
/2
/2
/2
/2
/2
/2
/2
01
01
01
01
01
01
01
01
01
01
02
1
0
2
3
4
5
6
7
8
9
0You can also read