PRINCIPLES OF POPULATION & DEMOGRAPHY - MOAZZAM ALI MD, PHD, MPH DEPARTMENT OF REPRODUCTIVE HEALTH AND RESEARCH WORLD HEALTH ORGANIZATION - GENEVA ...
←
→
Page content transcription
If your browser does not render page correctly, please read the page content below
Principles of Population &
Demography
Moazzam Ali MD, PhD, MPH
Department of Reproductive Health and Research
World Health Organization
    Training Course in Sexual and Reproductive Health Research
                           Geneva 2012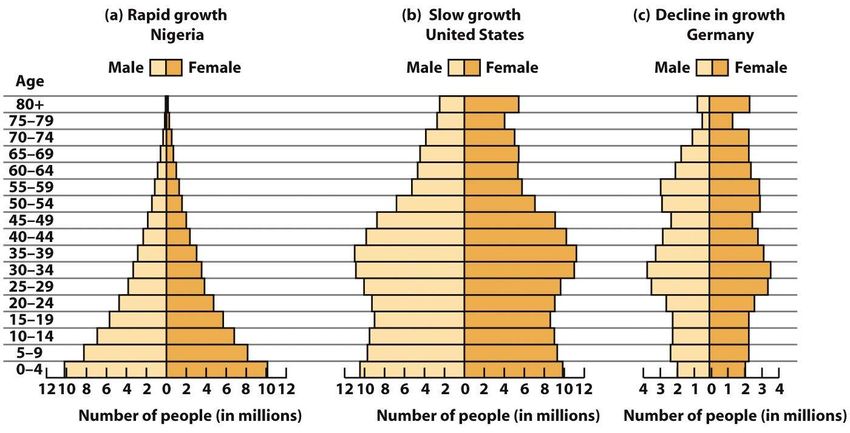
Definitions of population & demography and relevant
indicators
Why family planning is still important
MDG, RH Strategy, UNSG Strategy
Key indicators on family planning
Contraceptive Prevalence
Unmet need for FP
Special target populations groups
Need for research in population & family planning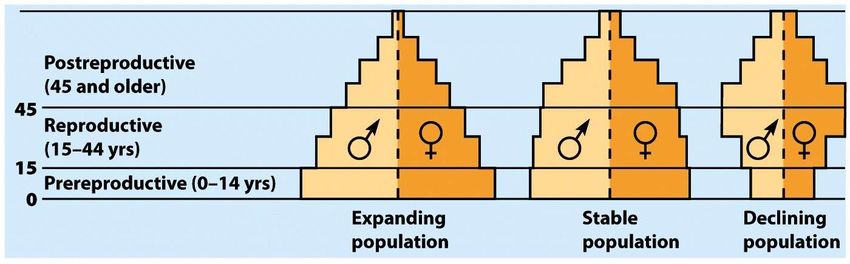
Population: definition
“Group of individuals of same species living
in the same geographic area at the same time”
A population is often defined by
demographers according to the specific needs
of the research and researcher. Three
processes are relevant to demography:
Fertility, Mortality, and Migration
Population: basic concepts
There are only two ways to enter a population by
birth and by in-migration.
There are two ways to leave a population, by
death and by out-migration.
For example, the population of interest may be that
of students attending a specific university during a
specific year. In this situation, the students are born
(i.e., enter) into the population when they enroll, and
they die (i.e., leave) when they graduate
Trends in global population growth
      1st Billion: 1804
      2nd Billion: 1927 (123 years)
      3rd Billion: 1960 (33 years)
      4th Billion: 1974 (14 years)
      5th Billion: 1987 (13 years)
      6th Billion: 1999 (12 years)
      7th Billion: 2011 (12 years)
      8th Billion: 2023 (12 years)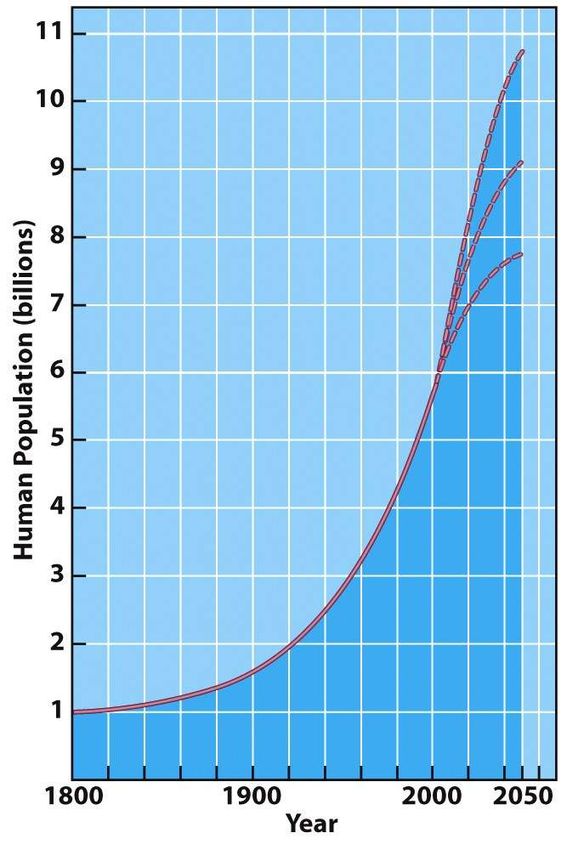
Projecting future
populations
Human Population since
1980 is J-shaped curve
Population is increasing
however growth rate (r) has
started to decline
Projections for 2050 (2007)
Low = 7.7 billion
High = 10.6 billion
Most likely = 9.1 billion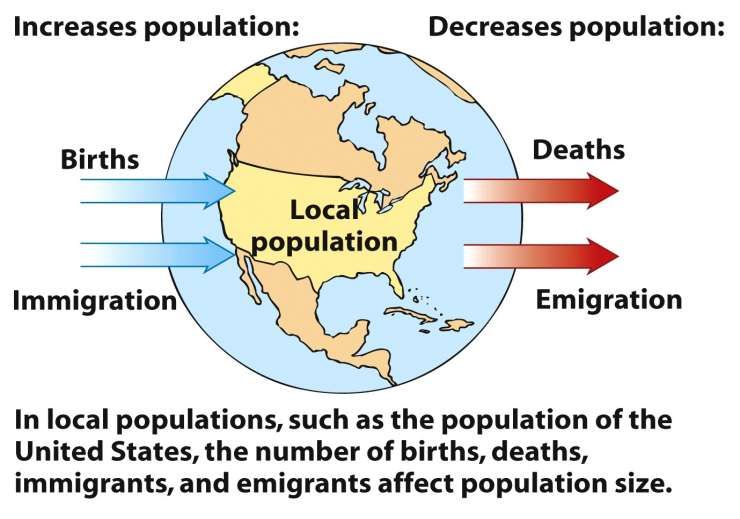
Reaching the 7 billion mark…
World Population to surpass 7 Billion in 2011 and
will reach seven billion on 31st October, a milestone
that offers unprecedented challenges and
opportunities to all of humanity, according to
UNFPA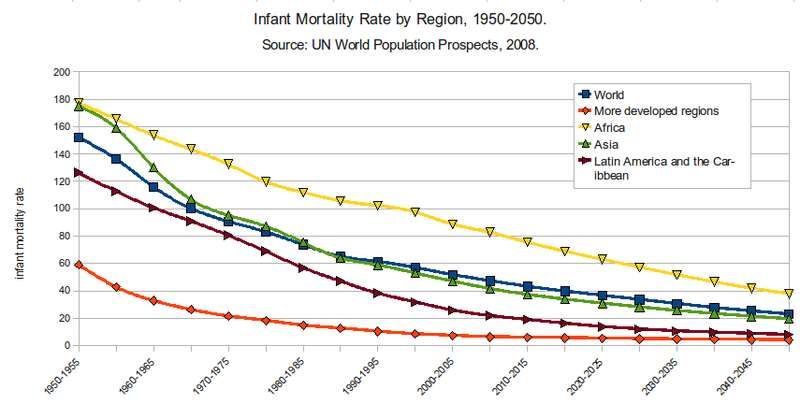
World population distribution: global overview
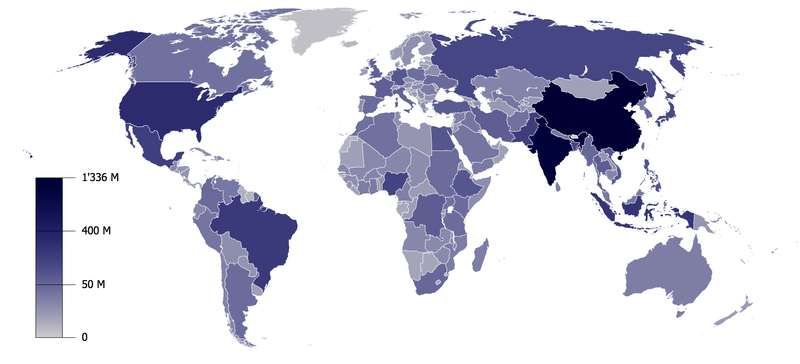
Population density
Population density
The number of individuals of a species per unit
area or volume at a given time
Ovals below have same population, and different
densitiesPopulation density of countries
Effects of overpopulation Some of the global effects of overpopulation include: Ultimate shortages of energy sources and other natural resources, Famine Serious communicable diseases in dense populations Shortage of arable land (where food crops will grow) Little surplus food Mass extinctions of plants and animals as habitat is used for farming and human settlements War over scarce resources such as land area.
Effects of overpopulation
High birth rates
Lower life expectancies
Lower levels of literacy
Child poverty
Higher rates of unemployment, especially in urban
Poor diet with ill health and diet-deficiency diseases (e.g.
rickets)
Low per capita GDP
Increasingly unhygienic conditions
Government stretched economically
Increased crime rates resulting from people stealing resources
to surviveDemography: historical perspective
Demography is the study of human population dynamics.
Achille Guillard first used the title on his book:
"Elements de Statistique Humaine ou Demographie Comparee".
Two Greek roots:
demos (people)
graphy (branch of knowledge regarding a particular science in this
case, human populations).
Guillard then defined demography as: ‘the mathematical knowledge of
populations, their general movements, and their physical, civil, intellectual
and moral state’ (Guillard 1855:xxvi).Today demography encompass…
…the determinants and consequences of population change
and is concerned with virtually everything that influences or
can be influenced by:
Population Size
Population growth or decline
Population processes (levels and trends in mortality, fertility
and migration that are determining population size and
change).
Population characteristics (education, religion, or ethnicity)
Population structure (how many by age)Population pyramid: age structure
The number and proportion of people at each age in
a populationDemographics of specific countries
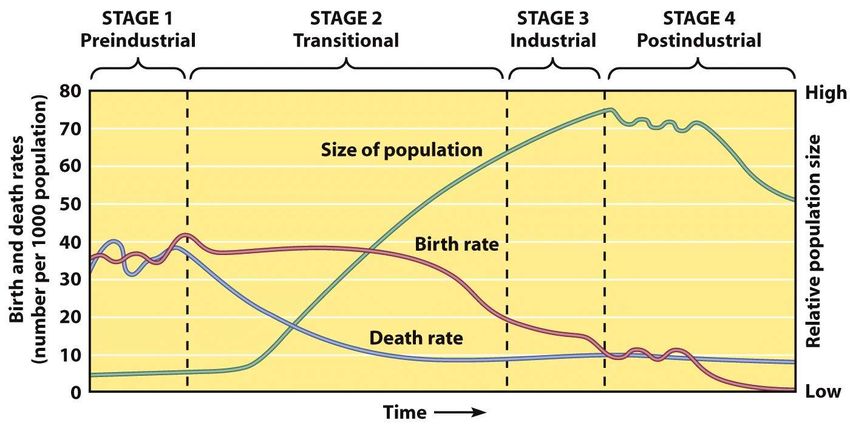
Demographic stages
Pre-industrial Stage
Birth and death rates high
Modest population growth
Transitional Stage
Lowered death rate
Rapid population growth
Industrial Stage
Birth rate decline
Population growth slow
Post Industrial Stage
Low birth and death rates
Population growth very slowDemographic stages
Demographic indicators
Because demography is interested in changes in
human populations, demographers focus on specific
indicators of change.
Two of the most important indicators are birth and
death rates, which are also referred to as fertility and
mortality.
Additionally, demographers are interested in
migration trends or the movement of people from
one location to another.Fertility and fecundity
Fertility, in demography, refers to the ability of females to
produce healthy offspring in abundance. Fecundity is the
potential reproductive capacity of a female. Some of the more
common demographic measures used in relation to fertility
and/or fecundity include:
Crude birth rate
General fertility rate
Age-specific fertility rate
Total fertility rate
Gross reproduction rate
Net reproduction rateReplacement level fertility
It refers to the number of children that a woman (or
monogamous couple) must have in order to replace the
existing population. Replacement level fertility is generally
set at 2.1 children in a woman's lifetime (this number varies
by geographic region given different mortality rates).
The reason the number is set to 2.1 children per woman is
because two children are needed to replace the parents and an
additional one-tenth of a child is needed to make up for the
mortality of children and women who do not reach the end of
their reproductive years.Total fertility rate
The total fertility rate (TFR) of a population is the
average number of children that would be born to a
woman over her lifetime if ;
(1) she were to experience the exact current age-
specific fertility rates (ASFRs) through her
lifetime, and
(2) she were to survive from birth through the end
of her reproductive life. It is obtained by
summing the single-year age-specific rates at a
given time.World historical and predicted total fertility rates (1950–2100) UN, 2010 Years TFR Years TFR Years TFR 1950–1955 4.95 2000–2005 2.62 2050–2055 2.15 1955–1960 4.89 2005–2010 2.52 2055–2060 2.12 1960–1965 4.91 2010–2015 2.45 2060–2065 2.11 1965–1970 4.85 2015–2020 2.39 2065–2070 2.09 1970–1975 4.45 2020–2025 2.33 2070–2075 2.08 1975–1980 3.84 2025–2030 2.29 2075–2080 2.06 1980–1985 3.59 2030–2035 2.25 2080–2085 2.05 1985–1990 3.39 2035–2040 2.22 2085–2090 2.04 1990–1995 3.04 2040–2045 2.19 2090–2095 2.04 1995–2000 2.79 2045–2050 2.17 2095–2100 2.03
Trends in TFR 1950-2050
Mortality
Mortality refers to the finite nature of humanity: people die.
Mortality in demography is interested in the number of deaths
in a given time or place or the proportion of deaths in relation
to a population. Some of the more common demographic
measures of mortality include:
crude death rate: the annual number of deaths per 1000
people
infant mortality rate: the annual number of deaths of
children less than 1 year old per thousand live births
life expectancy: the number of years which an individual
at a given age can expect to live at present mortality ratesInfant mortality rate by region 1950-2050
Life expectancy at birth by region, 1950-2050
Change in population size
Migration : change in population size
Calculating population change
     Growth           Death        Emigration
      rate             rate          rate

        r = (b – d) + (i – e)
              Birth        Immigration
              rate            rate

Birth (b), Death (d), Immigration (i) and Emigration (e)
   are calculated per 1000 people
Why Family Planning is still important ?
Family planning can help prevent
unintended and unwanted pregnancies
It has intrinsic benefits to the women themselves,
and contributes to child health and survival
gender equality and empowerment
fulfillment of human rights
child survival,
poverty reduction
opportunities (e.g. education, economic empowerment)
maternal health and survival
Estimated that 27% of maternal deaths can be
prevented by meeting unmet need for family
planning
33Current situation
on family planning
Constraints:
26 countries have CPR
below 20% Opportunities:
MDG 5b: Universal access
215 million couples have
an unmet need for family to reproductive health
planning FP and other SRH
services
Decreased investment in
contraceptive research and Renewed interest in
development by industry, supporting family planning
despite increased demand internationally
Insert file name 34
Active mis - and
34
disinformationMDG 5: improve maternal health
5 A:Reduce by three quarters, between 1990 and 2015, the
maternal mortality ratio
5.1 Maternal mortality ratio
5.2 Proportion of births attended by skilled health
personnel
5.B: Achieve, by 2015, universal access to reproductive
health
5.3 Contraceptive prevalence rate
5.4 Adolescent birth rate
5.5 Antenatal care coverage (at least one visit and
at least four visits)
5.6 Unmet need for family planningUN Secretary General's Global Strategy for
Women's and Children's Health: 2010
Components Role of UN agencies
Country-led health plans Define norms, regulations and
Comprehensive, integrated guidance to underpin efforts
package of essential interventions Help countries align their national
and services practices
Integrated care Work together and with others to
Health systems strengthening strengthen technical assistance to
scale-up
Health workforce capacity Encourage links between sectors
building and integration with other
Coordinated research and international efforts
innovation Support systems that track
progress and identify funding gaps
Generate and synthesize research-
derived evidence and provide a
36
platform for sharing37
Evidence-based packages of interventions to
     improve SRH (H4+) and partners

                             Health System
        Components
        Benefits and potential impact of interventions,
           including Family planning
        Health system requirements
        Service delivery recommendations
38

        Indicators
Family planning guidelines and tools
The Medical
Medical Eligibility Eligibility
Criteria Selected Practice Criteria Wheel
Recommendations
CIRE
Reproductive Choices
and Family Planning
4th edition just published! for People with HIV
2010
Guide to family
planning for
health care
Global Handbook
Decision- providers and
Making Tool New their clients
39Indicators on family planning
Contraceptive prevalence rate
Contraceptive prevalence is the percentage of
women who are currently using, or whose sexual
partner is currently using, at least one method of
contraception, regardless of the method used.
It is usually reported for married or in union women aged 15 to 49.
A union involves a man and a woman regularly cohabiting in a
marriage-like relationship.
08_XXX_MM41Global contraceptive prevalence rate
80.0
70.0
60.0
Africa
50.0
Asia
CPR
Europe
40.0
Latin America
North America
30.0
Oceania
20.0
10.0
08_XXX_MM42
0.0
1980 1985 1990 1995 2000 2005 2009
YEARContraceptive prevalence rate in Asia
CPR Trends - Asia
90.0
80.0
70.0
60.0 ASIA
Central Asia
50.0
CPR
Eastern Asia
40.0 Southern Asia
South-Eastern Asia
30.0 Western Asia
20.0
10.0
08_XXX_MM43
0.0
1980 1985 1990 1995 2000 2005 2009
YearTrends in childbearing, by region
Average number of children per woman
6.8
5.7 5.6
4.9 5
2.7 2.5 2.6 2.4
1.6
World Africa Asia Latin America More Developed
and the Countries
Caribbean
1965-1970 2000-2005
Source: United Nations, World Population Prospects: The 2004 Revision, 2005.Diverging trends in fertility reduction
8.5
Average number of children per woman
6.4 6.4
6.2
5.7
5.4 5.3
5.2
4.3
3.3
3.1
2.4 2.5
2.1
Egypt India Indonesia Iran Pakistan Turkey Yemen
1970-1975 2000-2005
Source: United Nations, World Population Prospects: The 2004 Revision, 2005.Rising family planning use, developing
countries
60
Married Women 15 to 49 Using Any Method
(Percent) 53
38
24
9
1960 1970 1980 1990 Late 1990s
Source: Population Reference Bureau, Family Planning Worldwide 2002 Data Sheet.Family planning methods, worldwide
Traditional Other Modern
Methods Methods
Male 7% 1%
Sterilization
3%
Not Using
Female
39%
Sterilization
21%
Male Condom
5%
Injectable or
Implant Pill
3% IUD 8%
Note: Total exceeds 100 due to rounding. 14%
Source: United Nations Population Division, World Contraceptive Use 2005.
.Family planning methods, Sub-Saharan Africa
IUD Condom
5% 5% Other
Modern
5%
Injectables
21%
No Any Rhythm
Method Method 16%
82% 19% Pill
21%
Withdrawal
5%
Other
Female
Traditional
Sterilization
Married Women 15 to 49 Using 11%
11%
Family Planning, Late 1990s
Note: Total exceeds 100 percent due to rounding.
Source: Population Reference Bureau, Family Planning Worldwide 2002 Data Sheet.Defining unmet need for family planning
The number of women with unmet need for family planning
X 100
Women of reproductive age who are married or in a union
Understood by many as
– the percentage of women who are not currently using a
method of family planning and want to stop or delay
childbearing
Complete calculation
– Is complex
– Is not widely understood
– Is difficult to calculate using data other than
Demographic and Health Surveys (DHS)Unmet needs for family planning
As unmet need is increasingly used for
– advocacy
– development of family planning policies
– implementation and monitoring
And has been adopted as a Millennium Development Goal
(MDG) indicator (target 5b, indicator 5.6)
Understanding this indicator has become crucial
New urgency to find a definition that can be applied
consistently over time and across DHS, MICS, RHS, and
other surveysUnintended births
Births Reported by Women as Either Unwanted or Wanted Later
(Percent)
54
45 44
30
22
16
Cameroon Kenya Madagascar Philippines Morocco Columbia
2004 2003 2003/2004 2003 2003/2004 2005
Source: DHS STATcompiler: accessed online at www.measuredhs.com/statcompiler on June 14, 2006.Wanted Births, Worldwide
Not Wanted
11%
Recent Births, by
Mother’s Attitude,
Wanted Late 1990s
Later
16%
Wanted
73%
Note: Estimates based on approximately 60 percent of births worldwide.
Source: Population Reference Bureau, Family Planning Worldwide 2002 Data Sheet.Global unmet need for family planning
30.0
25.0 WORLD
AFRICA
20.0
Unmet Need
ASIA
15.0
Southern Europe
10.0 LATIN AMERICA AND THE
CARIBBEAN
NORTHERN AMERICA
5.0
0.0
08_XXX_MM53
1990 1995 2000 2005 2009
YearReasons for high unmet need
Perceived lack of exposure to pregnancy was the most common
reason cited
Between one-third and two-thirds of women with unmet need
said they were never or infrequently having sex.
Believed they could not become pregnant because of menopause,
breastfeeding, or another reason.
Opposition to family planning (by women, their husbands, or others).
Gender imbalance –
Men’s unmet need tends to be lower because men want to have
more children (or sooner) than do women
Method-related problems were cited by about one-third of women
with unmet need.
Problems related to side effects and health concerns
Cost and access also mentioned.
Lack of knowledge about methods or sources of supplySpecial groups: lack of Access to family planning
215 million couples worldwide don’t have access to family
planning
Groups without access:
Adolescents
Unmarried women
Women postponing their first pregnancy
People with disabilities
Poor, especially people in rural areas and urban slums
Migrants
Postpartum womenWhy to do the research in family planning
Why do we need more research?
High unmet need
High percent of non-use
Existing methods do not meet the needs of all
Some are difficult to use consistently and correctly
High typical use failure rates of temporary methods
Side effects or fear of side effects
High discontinuation of temporary methods
Changing needs and desires over reproductive lifespan…we can improve upon existing methods
Less expensive
Easier to use in a compliant way
Highly effective in typical use
Safe and Acceptable
Rapidly reversible
Convenient and easy to use
Use in chronic disease states
Provide additional health benefits
Easier to deliver in service settings: availability, affordability
and acceptability
User-independent (Forgiving of misuse)
Provided by CHWs (task shifting), or provider independent…or develop new methods that could be
game changers
Male methods that are practical
Non-condom approaches for dual protection
Non-surgical sterilization
Peri-coital methods
Immuno-contraceptives
Novel and/or non-hormonal contraceptives (daily or
long acting)
Methods with non-contraceptive health benefitsResearch is important
Research can play a critical role in responding to the
challenge of unmet need for family planning,
especially during periods when resources are limited.
To fill the knowledge gap regarding contraceptive
technology & safety, and address implementation
issues related to improving contraceptive uptake,
removing barriers and increasing acceptability.
Aims to develop new innovations in service delivery
and contraceptive methods.Research prioritization for next decade
Research priorities must be reviewed and
updated periodically to maintain their
relevance in a fair and transparent way.CHNRI Prioritization Process:
Setting the agenda
The CHNRI priority setting
process aims to include not
only research that produces
new knowledge, but also
research that focuses on
implementation of existing
knowledge.
The CHNRI process is
systematic. This diagram
details the process of
prioritization.CHNRI process: research prioritization
Research Instrument Research Avenue Research Option Research Question
(Research Project) (research papers)
Basic Epidemiological Measuring the unmet need (list research options within (list research questions
Research each research avenue) within each research option)
Understanding barriers to use
Evaluating existing
contraceptives
Health Policy and Study the capacity to reduce
Systems research obstacles to use of
contraceptives
Studying capacity to deliver
efficacious interventions
Research to improve Research to improve
existing interventions deliverability
Research to improve affordability
Research to improve
sustainability
Research for development Basic research
of new contraceptive
technologies Clinical research
Public health researchConclusion
Use in reducing MMR is under emphasized.
Potential to reduce poverty and hunger and avert
32% of all maternal deaths and nearly 10% of
childhood deaths.
Fall in total fertility rate from 6 to 3.
Need for political willingness and commitment.
Call for renewed commitment by donors and the
potential of commercial sector through partnerships
should be explored.You can also read