COVID-19, Age and Mortality: Implications for Public Policy - Balsillie School of ...
←
→
Page content transcription
If your browser does not render page correctly, please read the page content below
ISSUE       01

COVID-19, Age and Mortality: Implications for
Public Policy

Alan Whiteside and Felicia Clement

June 2, 2020

The COVID-19 pandemic has paralyzed the global community, but its impacts around the
world have not been homogeneous. Some places have seen only a few cases, while in others the
numbers have been significant; mortality rates also differ considerably. This paper looks at a
possible reason for this variation, focusing on the age profiles of populations as one significant
factor among many. We examine the hypothesis that countries or regions with older populations
may have more cases with higher morbidity and mortality. We then draw out public policy
implications from this hypothesis.

Backdrop to the Pandemic

In late December 2019, authorities in Wuhan, China, were informed of a new respiratory disease
infecting increasing numbers of people.1 They, in turn, notified the World Health Organization
(WHO).2 By January 30, 2020, there were about 10,000 cases globally, and the WHO cautioned of a
public health emergency of international concern3 — a formal declaration of “an extraordinary event
which is determined to constitute a public health risk to other States through the international spread of
disease and to potentially require a coordinated international response.”4 As of late May, there are nearly
six million cases globally.

COVID-19 originates from a retrovirus that entered humans as a zoonotic disease — a disease that
crosses the species barrier from animal to human and then spreads from human to human.5 The earliest
cases were associated with a local “wet market” in Wuhan, where live and slaughtered animals, both
domestic and exotic, were being sold as food.6 COVID-19 — known officially as “severe acute respiratory
syndrome coronavirus 2” or by its abbreviation, SARS-CoV-2 — spreads rapidly between humans,
mainly via the respiratory tract through droplets and fomites.7 It presents through a wide range of
symptoms, primarily but not restricted to fever, cough and difficulty breathing.8 As time passes, the range
of symptoms identified with COVID-19 increases.

Preliminary studies suggest that SARS-CoV-2’s case fatality rate, at 2.2 percent, is significantly lower
than that of its predecessors.9 It was 9.6 percent for SARS-CoV and 34.4 percent for MERS-CoV.10
However, the rate remains in flux as the pandemic continues to unfold. The most vulnerable are the
elderly (over 65) and those with comorbidities (underlying medical conditions).11 The main comorbidities
associated with poor prognosis are cancers, diabetes and hypertension, as well as respiratory, cardiac and
renal diseases.12

1
  Mary A. Lake, “What we know so far: COVID-19 current clinical knowledge and research,” Clinical Medicine
20(2), March 2020: 124.
2
  John S. Mackenzie and David W. Smith, “COVID-19: a novel zoonotic disease caused by a coronavirus from
China: what we know and what we don’t,” Microbiology Australia 41(1), March 2020: 45.
3
  WHO, “Statement on the second meeting of the International Health Regulations (2005) Emergency Committee
regarding the outbreak of novel coronavirus (2019-nCoV),” Press Release, January 30, 2020.
4
  WHO, “What is a public health emergency of international concern?” December 19, 2019.
5
  Lori Cuthbert, “How do infections like coronavirus jump from animals to people?” National Geographic, April 1,
2020.
6
  Ibid.
7
  Mackenzie and Smith, 46.
8
  Lake, 124.
9
  Thirumalaisamy P. Velavan and Christian G. Meyer, “The COVID-19 epidemic,” Tropical Medicine and
International Health 25(3), March 2020: 279.
10
   Ibid.
11
   Mackenzie and Smith, 47.
12
   Wei-jie Guan et al., “Comorbidity and Its Impact on 1590 patients with COVID-19 in China: A Nationwide
Analysis,” European Respiratory Journal 55(5), May 2020: 11–12.

                                                                                                                   2
Several excellent websites are tracking the progress of the pandemic. The one we use most is
Worldometer.13 As of May 26, the hardest-hit region is the Americas, with 2,518,852 cases.14 Africa, on
the other hand, has relatively low numbers, with only 115,868 cases as of May 26, 2020.15 At this time, it
is evident from all aggregated data sources that there are significantly fewer recorded cases in Africa. Is
this likely to continue? This question will require analysis in relative and absolute terms.

Data and Vulnerability

Since the outbreak, epidemiologists, virologists, public health specialists, policy makers and politicians
have been trying to understand the workings of this virus. Although scientific knowledge is increasing
exponentially, a great deal remains unknown; the epidemic continues to spread, and the numbers continue
to rise.

In general, a COVID-19 infection is counted if verified by a laboratory test. The WHO states a
confirmed case is “a person with laboratory confirmation of COVID-19 infection.”16 Initially, the only
diagnostic test available was an antigen test that determined if an individual had COVID-19. In mid-
May, antibody tests were underway.

What makes COVID-19 unique and a major public health issue is that most people have no symptoms
for the first four to five days after acquiring the disease, but may infect others during this time. A key
concept here is that infectiousness is measured by the reproduction rate. This is the number of new
infections one individual transmits. If each person infects more than one other person, the epidemic will
continue to grow. If it falls below one, the epidemic will shrink. Canada’s average reproduction rate was
2.8 in mid-March and now sits at 0.8.17 This number fluctuates considerably between institutional
settings and the general public in each province.

Given that most cases go undetected, the number of severe illnesses and deaths is small; thus, until
recently, the main reliable source of data was the number of mortalities. Most countries collect vital
statistics, meaning the number of births, deaths or marriages that take place in that country. These
statistics can help determine the actual impact of the pandemic by comparing current mortality rates with
those of previous years.

13
   Worldometer, “COVID-19 Coronavirus Pandemic,” accessed May 20, 2020.
14
   European Centre for Disease Prevention and Control, “COVID-19 situation update worldwide, as of 20 May
2020,” accessed May 20, 2020.
15
   Ibid.
16
   WHO, “Coronavirus disease 2019 (COVID-19) Situation Report – 99,” April 28, 2020.
17
   Patrick Cain, “As Canada slowly reopens, here are six coronavirus numbers to keep an eye on,” Global News, May
16, 2020.

                                                                                                                    3
Age Composition and Why It Matters

The age structure of a population broadly determines many aspects of society: economic growth, labour
force participation rates, demand for and utilization of educational and healthcare services, and housing.
Demographers divide populations into three broad age groups: children and young adolescents (under 15
years old); the working-age population (15–64 years); and the elderly population (65 years and older).
The age dependency ratio (people below 15 and over 65, as a proportion of the 15–64 cohort) and the
working-age bracket are important when creating social policies. The growing proportion of older people
is a recent phenomenon in many countries as medical care and standards of living continue to improve
and birthrates decline, especially in highly developed countries.

We have chosen countries to illustrate the current variability of COVID-19 through population
pyramids. Population pyramids help “visualize the demographic structure of a population.”18 They are a
snapshot of the demography and a view of the future as people “age up” in each country.

COVID-19 gives new significance to mortality and age. Morbidity (ill health) and mortality (death)
increase with age, and in most settings, this is due to non-communicable diseases.19 Globally, the top five
causes of death are cardiovascular diseases, neoplasms (cancer), chronic respiratory disease, respiratory
infections and tuberculosis, and neurological disorders.

The United Nations estimated that the global average life expectancy in 2019 was 72.6 years.20 Life
expectancy in the case countries selected ranged from a low of 60.2 years in South Africa21 (largely the
result of the AIDS epidemic) to 85.4 in Italy.22

China, Japan and South Korea, the countries hit first by COVID-19, were able to bring the
epidemic under control with low case numbers.23 When the disease reached Europe, the worst-hit
countries initially were Italy and Spain. At the end of May, the largest numbers of infections are in the
United States, Brazil, Russia, Spain, the United Kingdom and Italy.24 The highest mortality rates are in
the United States, United Kingdom, Italy, France and Spain.

18
   Hannah Ritchie and Max Roser, “Age Structure,” Our World in Data, September 2019.
19
   All data in this paragraph taken from Global Disease Burden, “GDB Compare,” accessed May 25, 2020.
20
   Max Roser, Esteban Ortiz-Ospina and Hannah Ritchie, “Life Expectancy,” Our World in Data, October 2019.
21
   UN Department of Economic and Social Affairs, Population Division, “South Africa,” World Population Prospects
2019, Volume II: Demographic Profiles: 4.
22
   UN Department of Economic and Social Affairs, Population Division, “Italy,” World Population Prospects 2019,
Volume II: Demographic Profiles: 4.
23
   Data read from graphs, Johns Hopkins University & Medicine Coronavirus Resource Center, “COVID-19
Dashboard by the Center for Systems Science and Engineering at Johns Hopkins University,” accessed May 25,
2020.
24
   Worldometer, “Reported Cases and Deaths by Country, Territory, or Conveyance,” accessed May 26, 2020.

                                                                                                                   4
Country Case Studies

Table 1: Demographic Data for Country Case Studies

 * Total Population, Percentage of People over 65, and Life Expectancy taken from country reports in UN
 Department of Economic and Social Affairs, Population Dynamics, “Graphs/Profiles,” World Population
 Prospects 2019, accessed May 10, 2020.

 * * Human Development Index Ranking and GDP stats from UN Development Programme, 2019 Human
 Development Index Ranking, accessed May 10, 2020.
25 26 27 28

China

China has the world’s largest population, projected to reach 1,439,324,000 by the end of 2020.29 The
median age is 38.4, with a declining growth rate since 2000. The population pyramid (Figure 1) reflects

25
   UN Development Programme, “Gender Development Index,” accessed May 10, 2020.
26
   UN Development Programme, “Income Inequality, Gini Coefficient,” accessed May 10, 2020.
27
   Worldometer, “Reported Cases and Deaths by Country, Territory, or Conveyance.”
28
   Jason Oke and Carl Heneghan, “Global Covid-19 Case Fatality Rates, updated May 26, 2020,” Centre for
Evidence-Based Medicine.
29
   Statistics in this paragraph are from UN Department of Economic and Social Affairs, Population Division,
“China,” World Population Prospects 2019, Volume II: Demographic Profiles: 4.

                                                                                                              5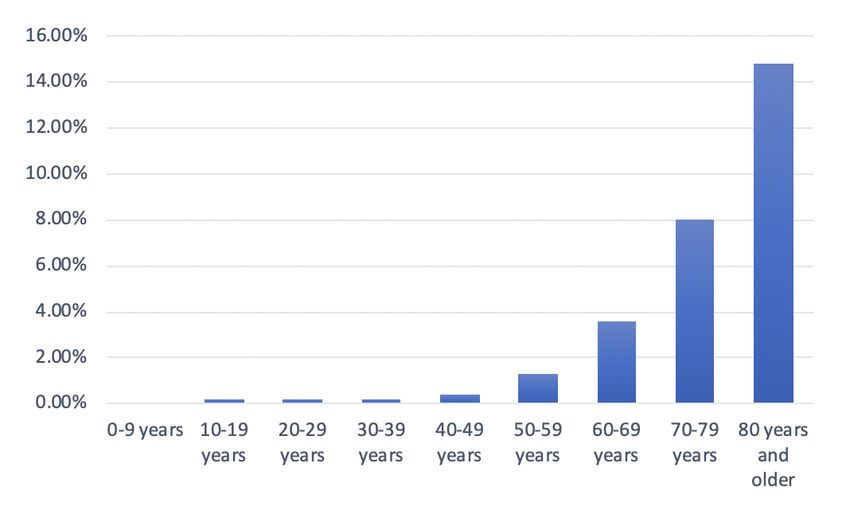
this, as those under 15 years make up 17.7 percent of the population, 15–24s are 11.8 percent, and 25–64s
are 58.5 percent; over 65s account for 12 percent and are growing in absolute and relative numbers. The
combination of an ageing population and a declining growth rate means increasing numbers in the higher
age brackets will require care.
Figure 1: China: Population Pyramid, 2020
COVID-19 originated in Wuhan, in China’s
Hubei Province.30 China recorded its first
cases on November 17, 2019.31 The reaction
of officials was swift, and the disease
remained primarily confined to Wuhan. The
number of cases rose to 80,000 by early
March 2020; since then, there have been only
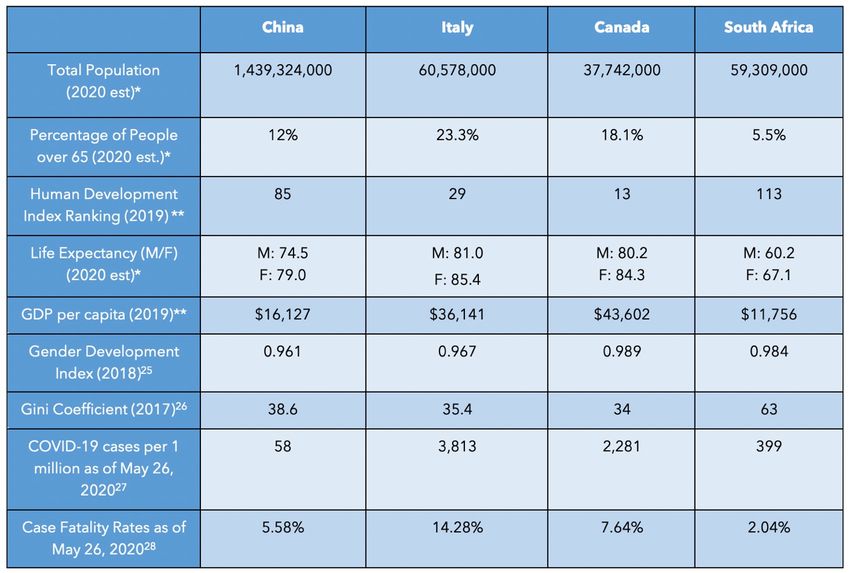
2,992 cases.32 Figure 2 shows the distribution
of deaths is significantly higher among older
populations.33 China shows it is possible to
control the epidemic and minimize the
number of deaths.
(Source: World Population Review)
Figure 2: Distribution of COVID-19
Deaths in China, by Age Group, as of
February 11, 2020
Due to immediate action, the number of
deaths remained low; the data suggests fewer
than 5,000.34 The average case fatality rate is
5.58 percent.35 This data shows a strong
correlation between age and higher fatality
rates, despite the virus remaining a
controllable epidemic in China.
(Source: Statista)
30
Helen Davidson, “First Covid-19 case happened in November, China government records show-report,” The
Guardian, March 13, 2020.
31
Ibid.
32
Worldometer, “Reported Cases and Deaths by Country, Territory, or Conveyance,” accessed May 26, 2020.
33
Statista, “Fatality rate of novel coronavirus COVID-19 in China as of February 11, 2020, by age group.”
34
Worldometer, “Reported Cases and Deaths by Country, Territory, or Conveyance,” accessed May 26, 2020.
35
Oke and Heneghan.
6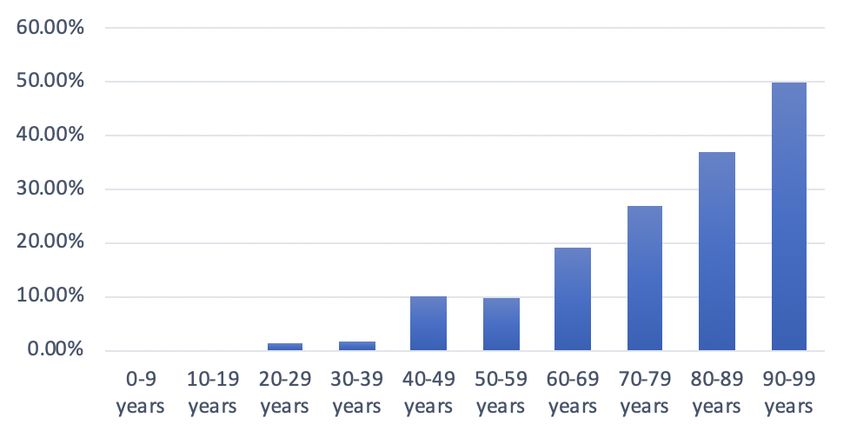
Italy

Italy has the second oldest population in the world. The median age is 47.3 and will increase to 50.8 by
2030.36 Italy’s projected population by the end of 2020 is 60,462,000,37 a 0.15 percent decline from
2019.38 Italy’s negative growth rate and rising life expectancy are creating a demographic crisis. The
struggling economy keeps fertility rates down.39

Figure 3 reflects the population: only 13 percent are under 15; 9.6 percent are 15–24; the working-age
bracket is 54.1 percent, and over 65s account for 23.3 percent.40

                                                                  Figure 3: Italy: Population Pyramid, 2020

                                                                  The first case of COVID-19 was reported on
                                                                  February 20, 2020, in the region of
                                                                  Lombardy.41 Italy delayed in responding to the
                                                                  crisis, and the numbers exploded in March and
                                                                  April.42

(Source: World Population Review)

36
   UN Department of Economic and Social Affairs, “Italy.”
37
   Ibid.
38
   Macrotrends, “Italy Population Growth Rate 1950-2020,” accessed May 16, 2020.
39
   Miles Johnson, “Italy’s collapsing birth rate rings demographic alarm bells,” Financial Times, January 17, 2020.
40
   UN Department of Economic and Social Affairs, “Italy.”
41
   Melissa Godin, “Why Is Italy’s Coronavirus Outbreak So Bad?” Time, March 10, 2020.
42
   Worldometer, “Italy,” accessed May 20, 2020.

                                                                                                                      7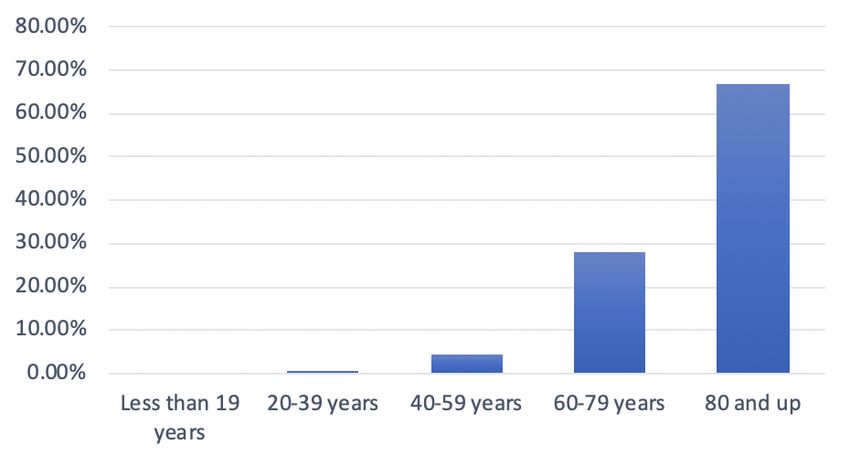
Figure 4: Distribution of COVID-19 Deaths in Italy, by Age Group, as of May 25, 2020

                                                                As Figure 4 shows, the elderly populations
                                                                bore the brunt of mortality. The 60–69 age
                                                                range accounts for 10.3 percent of the
                                                                population and the 80–89 cohort for 41
                                                                percent.43 Italy has seen a decline in deaths,
                                                                from a high of 919 deaths on March 27 to
                                                                only 50 on May 24.44 As of May 26, 2020,
                                                                there had been 230,555 cases and 32,955
                                                                deaths.45 The government announced on
                                                                May 16 it will open its borders in early June
                                                                to European tourists and lift the 14-day
                                                                quarantine requirement. 46
(Source: Statista)

Canada
Canada’s population is projected to reach 37,742,000 by the end of 2020.47 Although the 2020 projections
are a 0.89 percent increase from 2019, the growth rate has been below one percent since 2016.48 Figure 5
reflects the changing population. In Canada, 27.3 percent of the population is under 24, the working-age
bracket is 54.6 percent, and over 65s account for 18.1 percent.49 The median age is 41.1.50

                                       Figure 5: Canada: Population Pyramid, 2020
                                       Coronavirus arrived in Canada on January 25, 2020, when a man
                                       with COVID-19 returned from Wuhan, China.51 The virus spread
                                       rapidly from mid-March to early May; the numbers have been
                                       falling since.52 As of May 26, 2020, there had been a total of 86,614
                                       cases and 6,637 deaths.53

                                       (Source: World Population Review)

43
   Statista, “Distribution of coronavirus (COVID-19) deaths in Italy as of May 25, 2020, by age group.”
44
   Worldometer, “Italy.”
45
    Ibid.
46
   “Italy to reopen borders for EU tourists in early June,” Euractiv, May 18, 2020.
47
   UN Department of Economic and Social Affairs, Population Division, “Canada,” World Population Prospects 2019,
Volume II: Demographic Profiles: 4.
48
   Macrotrends, “Canada Population Growth Rate 1950-2020,” accessed May 12, 2020.
49
   UN Department of Economic and Social Affairs, “Canada.”
50
   Ibid.
51
   Staff-The Canadian Press, “Coronavirus: Here’s a timeline of COVID-19 cases in Canada,” Global News, March
3, 2020.
52
   Ibid.
53
   Worldometer, “Canada,” accessed May 20, 2020.

                                                                                                                   8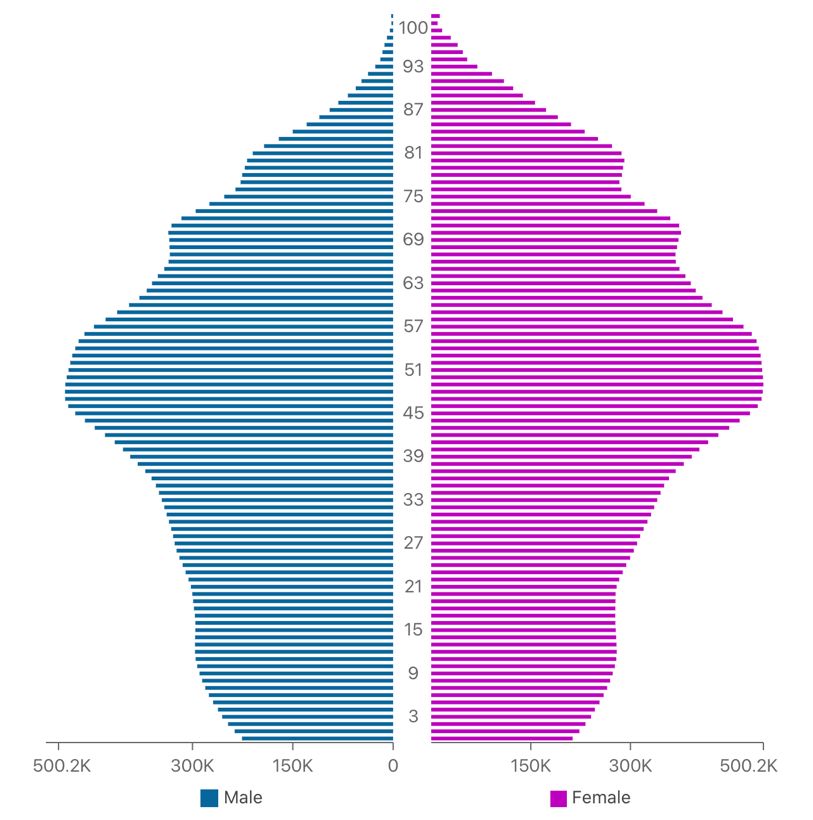
Figure 6: Distribution of COVID-19 Deaths in Canada, by Age Group, as of April 26, 2020

                                                                Figure 6 shows high fatality rates among the
                                                                older age groups. Canadians over the age of
                                                                60 accounted for 95 percent of COVID-19
                                                                deaths, 66 percent of hospitalizations and 63
                                                                percent of cases in intensive care units.54
                                                                Additionally, 78.5 percent of the deaths stem
                                                                from “long-term care and seniors’ homes,”55
                                                                especially in Quebec. In late April, around 60
                                                                percent of the province’s deaths came from
                                                                these facilities.56 Canada’s average case
                                                                fatality rate is 7.64 percent.57 Canada, like
(Source: Government of Canada)58                                Italy, delayed its response to protect older
                                                                populations.

After exploring the age composition and COVID-19 impacts in China, Italy and Canada, we compare
their experiences to South Africa. We posit, like Jennifer Beam Dowd et al., that countries with younger
age structures may not experience the same impacts from the pandemic as those with older
demographics.59

South Africa

South Africa’s population is projected to be 59,309,000 by the end of 2020.60 South Africa’s growth rate
has declined substantially and has been under two percent since 1996.61 The median age is currently 27.6,
with 45.4 percent of the population under 24, and only 5.5 percent over 65.62 The smaller percentage of
older individuals is due to the lower life expectancy (60.2 for men and 67.1 for women63) caused by AIDS.
UNAIDS data from 2018 states that 7.7 million people in South Africa are living with HIV.64

54
   Ibid.
55
   Ibid.
56
   Staff-The Canadian Press, “COVID-19 continues to ravage Quebec seniors’ home,” Global News, April 19, 2020.
57
   Oke and Heneghan.
58
   Data collected from 2,561 deaths, Government of Canada, Health Canada, “COVID-19 in Canada: Using data
and modelling to inform public health action,” accessed May 20, 2020.
59
   Jennifer Beam Dowd et al., “Demographic science aids in understanding the spread and fatality rates of COVID-
19,” Proceedings of the National Academy of Sciences 117(18), April 16, 2020: 2.
60
   UN Department of Economic and Social Affairs, “South Africa.”
61
   World Bank, “Population growth (annual%)-South Africa,” accessed May 18, 2020.
62
   Ibid, 4.
63
   Ibid.
64
   UNAIDS, “South Africa,” accessed April 26, 2020.

                                                                                                                   9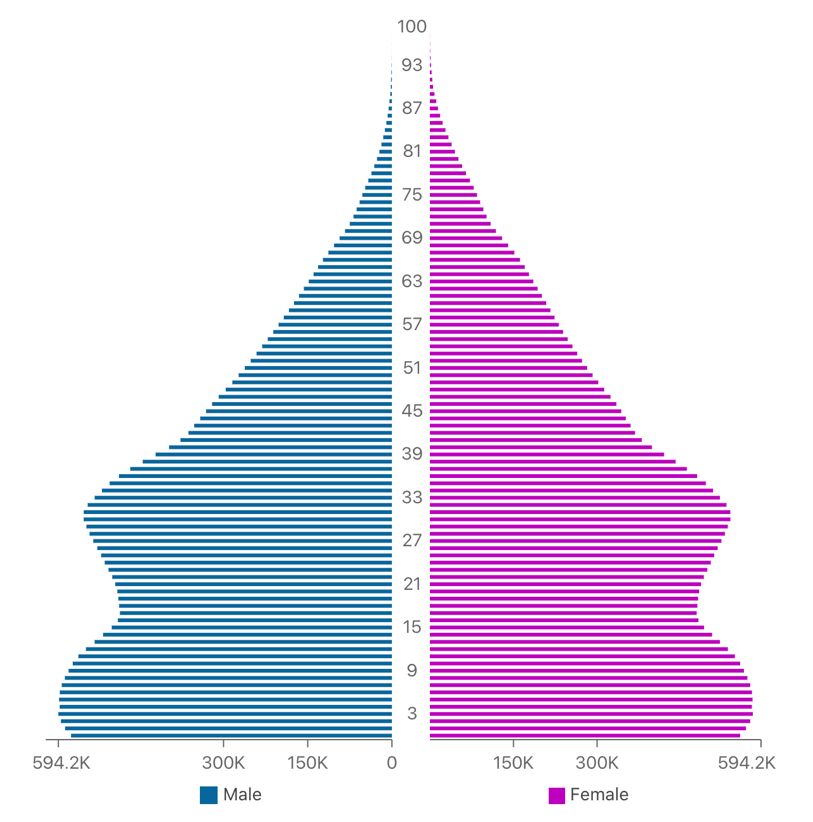
Figure 7: South Africa: Population Pyramid
                                                           On March 5, 2020, the National Institute for
                                                           Communicable Diseases (NICD) announced
                                                           South Africa’s first coronavirus case.65 The first
                                                           death occurred on March 27, 2020, prompting
                                                           the government to implement a strict three-
                                                           week nationwide lockdown involving military
                                                           and police.66

                                                           South Africa started to ease its restrictions on
                                                           May 1, but has seen a steady increase in cases,
                                                           with 1,160 recorded on May 18.67 Despite this
                                                           increase, and a total of 23,615 cases reported as
                                                           of May 26, 2020, there had been only 481
                                                           deaths. This translates to a case fatality rate of
                                                           2.04 percent, a much lower rate than in some
                                                           Western nations.

(Source: World Population Review)

Figure 8: Distribution of COVID-19 Deaths in South Africa, by Age Group, as of April 30, 2020

                                                             Figure 8 shows that older populations are
                                                             most vulnerable. The NICD conducted a
                                                             study of 28 public hospitals and 119 private
                                                             hospitals to keep track of COVID-19 cases.
                                                             Most admissions were for patients aged 30–
                                                             59 (57 percent), but the median age for
                                                             deaths was 65.68 Figure 8 shows that 19
                                                             percent of the deaths were among those
                                                             aged 60–69, increasing to 50 percent for
                                                             those 90 years and older.
(Source: NICD)69

65
   Minister of Health Dr. Zweli Mkhize, “First Case of COVID-19 Coronavirus Reported in SA,” NICD, March
5, 2020.
66
   Jerome Delay, Nqobile Ntshangase and Mogomotsi Magome, “‘Go home!’ South Africa has 1st death as
lockdown begins,” AP News, March 27, 2020.
67
   Worldometer, “South Africa,” accessed May 20, 2020.
68
   Ibid.
69
   NICD, “NICD COVID-19 Hospital Sentinel Surveillance,” PowerPoint presentation, South Africa, May 1,
2020.

                                                                                                                10
Conclusion
There are several caveats to this paper and its conclusions. The first is that COVID-19 is a new disease,
identified only a few months ago, in early 2020. We are not sure how the epidemiology will unfold. Will
Africa continue to see fewer cases? Second, most infections are asymptomatic or very mild, thus
unrecorded. This lack of data may mean COVID-19 has spread, largely unnoticed, through countries
with younger populations.
The data so far suggests that having a younger population is probably a protective factor because there are
fewer reported cases and fewer older adults seeking care. COVID-19 will not add significantly to the
disease burden.
China, the first nation to see COVID-19, brought it under control and contained it through draconian,
authoritarian measures. The experience of SARS-CoV in 2002 provided a template. Canada is a wealthy
country with a well-developed public health system, and a small population spread out over a large area.
These factors, combined with the SARS-CoV experience, mean that COVID-19 is under control, and
the impact is less severe than in other high-income countries. However, Canada provides an example of
how specific vulnerable groups can be overlooked and devastated, especially the institutionalized elderly.
This oversight was especially the case in Italy, where the health care sector was nearly overwhelmed. The
epidemic rose from 234 daily cases on February 28 to a peak of 6,557 by March 21, and remained high at
about 3,000 cases per day until early May.70 COVID-19 has a strong age dependence on the severity of
the infection and the risk of death, but high death rates among the elderly are not a given — Japan, for
example, controlled the epidemic with an older population. China, Italy and Canada illustrate the
vulnerability of the elderly and the need to provide care for them.
The epidemic in South Africa is in its early stages. While South Africa benefits from a youthful
population, it also carries the burden of AIDS and tuberculosis, which may prove to be among the
comorbidities that increase vulnerability to the virus. Observers and health care providers remain wary as
to what the implications will be. Most of the poorer nations of the world, including South Africa, are also
dealing with the epidemic of increased poverty as the global economy contracts.
Epidemic preparedness for this virus, and others, should consider the age structure and chronic diseases of
the population served by each health care system. COVID-19 is the most severe pandemic to emerge
since the 1918 influenza. As zoonotic diseases increase due to myriad causes, the global community would
do well to address the underlying conditions that lead to dangerous contacts between animals and
humans, while preparing for severe new illnesses and their impacts on human populations.
70
Worldometer, “Italy.”
11Alan Whiteside, OBE, was CIGI Chair in Global Health
Policy from December 2012-December 2018. He is a
Professor at Wilfrid Laurier University’s School of
International Policy and Governance and at the
BSIA. Whiteside’s current research program focuses on
interrelated areas of global health concerns. These include:
shifting burdens of disease, immigrant and migrant health,
and the economic and social causes and consequences of
HIV and AIDS.
Felicia Clement is an MA Global Governance
candidate at the Balsillie School of International
Affairs in Waterloo, ON. She graduated in 2014
with High Distinction from Wilfrid Laurier
University in Honours Anthropology and Global
Studies. During her undergraduate degree Felicia
was able to intern in Ghana for the Human Rights
Advocacy Centre and focused on access to
healthcare for marginalized communities.
balsillieschool.ca/papers
12You can also read