Lockdown lessons Violence and policing in a pandemic Andrew Faull, Jane Kelly and Amanda Dissel - AWS
←
→
Page content transcription
If your browser does not render page correctly, please read the page content below
30
YEARS

Lockdown lessons
Violence and policing in a pandemic
Andrew Faull, Jane Kelly and Amanda Dissel

Patterns of violence significantly changed with the introduction of South Africa’s 2020 COVID-19
lockdown. By monitoring murder trends, carrying out interviews and conducting a survey of over
5 000 residents in Cape Town, the Western Cape Government and ISS researchers sought to
identify lessons that could inform post-pandemic safety governance in South Africa’s most violent
police areas.

                                                                      SOUTHERN AFRICA REPORT 44 | MARCH 2021
Key findings

           	Murder fell by 47% in the first four weeks of      	There was little difference in reported police
             lockdown compared to the same period in              visibility before and during lockdown, with 50%
             2019 and by 38% in the second four weeks.            of survey respondents reporting daily visibility
             With the relaxing of regulations – most notably      and 25% reporting weekly visibility.
             the unbanning of alcohol and opening of the
                                                                	Most survey respondents (70%) approved of
             economy – murder increased to just 10% below
                                                                  the way the lockdown was enforced in their
             2019’s figure. When alcohol was again banned,
                                                                  community and said they would like to see early
             murder increased by 6% compared to 2019 and
                                                                  lockdown-type policing continue beyond the
             by 59% by mid-October.
                                                                  lockdown (81%).
           	Sharp-object murders halved when alcohol
                                                                	Data indicate that 61% of survey respondents
             was initially banned but doubled when it was
                                                                  interacted with police or law enforcement during
             reintroduced.
                                                                  the early lockdown, with 64% of them reporting
           	Lockdown did not significantly affect firearm-       being treated ‘well’ or ‘okay’.
             related murders.
                                                                	There was little difference in respondents’
           	Our data show a much larger reduction in fatal       feelings of safety in their community before or
             violence against women than men during early         during lockdown, with roughly 50% feeling
             lockdown, especially when alcohol was banned.        ‘very safe’ and 12% ‘very unsafe’.

         Recommendations

           	Both alcohol and firearms require better
                                                                 Police and law enforcers must rein in the post-
             regulation.                                         lockdown rise in violence. Evidence suggests
           	If the alcohol ban helped decrease sharp-object,    they can do this if they adopt carefully planned
             opportunistic and possibly domestic violence,       problem-oriented and intelligence-driven strategies
             then better regulation of alcohol may do the        that are understood and embraced by all involved,
             same in the future.                                 limited in scope and carefully implemented.

           	Alcohol enforcement must, however, be              	Police and law enforcers can’t be everywhere
             accompanied by the full regulation of firearms –     or do everything, but they should be able to
             focusing particularly on the removal of illegal      regulate the sale and consumption of alcohol,
             firearms and on identifying and removing             the possession of illegal firearms and the sale of
             corrupt officials who feed them back to              ammunition. If they do this effectively, they could
             communities.                                         drastically reduce murder in the Western Cape.

2   LOCKDOWN LESSONS: VIOLENCE AND POLICING IN A PANDEMIC
Introduction
On 27 March 2020, the South African government instituted one of
the world’s most restrictive lockdowns to help prevent the spread of
the coronavirus pandemic. Routine activities changed overnight with
unprecedented restrictions on movement and economic activity, a
tobacco and alcohol ban, increased policing and the deployment of
the South African National Defence Force (SANDF). Life fundamentally
changed, including patterns of crime and violence.
Murder, the most reliable indicator of violence in general, declined by
72% in the first three weeks of lockdown, and after three months,
2 000 fewer people had been killed compared to the same period in 2019.1
Despite these shifts, six months into the lockdown, the country’s murder
rate remained four times the pre-pandemic global average, showing
that ending South Africa’s violence will take more than a society-wide
lockdown.2
To learn from this moment, the Western Cape Government (WCG) and
the Institute for Security Studies (ISS) tracked and explored violence,
safety and policing during the first lockdown.3 This report summarises our
findings. It begins with an overview of the methodology and the country’s
lockdown levels, then presents survey and interview findings, followed by
six months of murder data and ends with a discussion.
Methodology
This was a mixed-methods study. From April to October 2020, we tracked
murders recorded by the Western Cape Forensic Pathology Services
(FPS) as a proxy for violence in general. We focused on 11 police areas in
Cape Town which in 2019/20 accounted for almost half of the province’s
3 974 murders. These areas were Bishop Lavis, Delft, Gugulethu, Harare,
Khayelitsha, Kraaifontein, Mfuleni, Mitchells Plain, Nyanga, Philippi and
Philippi East.4
After three months, 2 000 fewer people were killed
compared to 2019, but ending South Africa’s violence
will take more than a society-wide lockdown
We also carried out interviews and a survey in three of the eleven policing
areas – Khayelitsha, Philippi and Delft. In May, we interviewed: 31 City of MURDER FELL BY
72%
Cape Town learner law enforcement officers (LLEO), three South African
Police Services (SAPS) station commanders, 39 residents, and eight non-
governmental organisation (NGO) employees.5 In July, a cell phone survey of
over 5 000 people in the three areas was conducted.
IN THE FIRST 3 WEEKS
Both the interviews and survey were designed to probe experiences and OF LOCKDOWN
perceptions of safety, policing and enforcement during lockdown.
SOUTHERN AFRICA REPORT 44 | MARCH 2021 3South Africa’s lockdown levels encourage compliance. On the first day of lockdown,
55 people were arrested for contravention of regulations
Our data should be considered in the context of South
countrywide. By mid-August, this number stood
Africa’s five 2020 lockdown levels (Table 1). Level 5 was
at 300 000.6
the first and strictest period. Residents had to stay home
unless buying essential goods or performing essential
Survey and interview findings
services, most economic activity and public transport
ceased, and schools closed. After three weeks a curfew Experiences of policing and safety
was introduced.
We begin with a summary of our survey and interview
Police and other law enforcement authorities were data. Interviews were conducted telephonically at the
particularly strict during this period, carrying out end of Level 5 and the start of Level 4 (30 April–12 May).
roadblocks, foot patrols and visiting businesses to The survey ran during Level 3a (15–30 June) and was
Table 1: Lockdown Levels 1–5
Level Dates Weeks Key regulations and enforcement activities
5 29 March–2 May 14–18 Purchase of alcohol and tobacco banned; Stay home order; No public
gatherings; Limited transport and economic activity; Schools closed;
Curfew introduced after three weeks (8pm–5am).
Increased policing and law enforcement, SANDF deployed.
4 3 May–30 May 19–22 Purchase of alcohol and tobacco banned; Stay home order but limited
exercise allowed; No public gatherings; Limited transport and economic
activity; Schools closed; Curfew (8pm–5am).
Significant but less intense law enforcement with the support of SANDF.
3a 31 May–11 July 23–28 Purchase of alcohol unbanned; Tobacco banned; Stay home order but
exercise allowed; No public gatherings; Limited transport and increased
economic activity; Schools closed; Curfew (8pm–5am); Compulsory
mask wearing.
Policing and law enforcement further relaxed, SANDF remains.
3b 12 July–15 August 29–33 Purchase of alcohol and tobacco banned; Stay home order but
exercise allowed; No public gatherings; Limited transport and increased
economic activity; Schools partially open; Curfew (8pm–5am);
Compulsory mask wearing.
Policing and law enforcement relaxed, SANDF remains.
2 16 August– 34–38 Purchase of alcohol allowed Monday to Thursdays and in restaurants;
20 September Purchase of tobacco unbanned; Stay home order but exercise allowed;
No public gatherings; Limited transport and increased economic activity;
Schools open; Curfew (8pm–5am); Compulsory mask wearing.
Policing and law enforcement relaxed, SANDF remains.
1 21 September– 39–40 Purchase of tobacco unbanned; Purchase of alcohol allowed Mondays to
17 October Fridays and in restaurants; No limit on personal movement; No public
gatherings; Limited transport and increased economic activity; Schools
open; Curfew relaxed (12am–4am); Compulsory mask wearing.
Policing and law enforcement relaxed, SANDF withdraws (30 September).
4 LOCKDOWN LESSONS: VIOLENCE AND POLICING IN A PANDEMICTable 2: Number of murders in the three focus areas
Area Murder, Weeks 14–20 Murder, Weeks 21–27 Murder, Weeks 14–27
Interview phase Survey phase Two phases combined
(Levels 5–4) (Level 3a) (Levels 5, 4, 3a)
2019 2020 Change 2019 2020 Change 2019 2020 Change
Delft 26 8 –69% 46 34 –26% 72 42 –42%
Khayelitsha 36 20 –44% 42 37 –12% 78 57 –27%
Philippi 11 3 –73% 21 10 –52% 32 13 –59%
Source: Western Cape Forensic Pathology Services, 2020
broadcast via SMS to all Vodacom and MTN mobile Perceptions and experiences of enforcement
network subscribers in the three focus areas – the
Asked if they approved of the way lockdown was
Khayelitsha, Philippi and Delft police precincts. Over
enforced in their community, 71% of the survey
5 000 people responded to some or all of the survey, respondents said they did (Chart 1) and 81% said they
49% of them were female and 90% were younger would like lockdown-type enforcement to continue
than 34. beyond the lockdown. Of those who had interacted with
Murder declined significantly in the three areas in police or law enforcement officers, 64% said they had
the weeks preceding and inclusive of the interviews been treated ‘well’ or ‘okay’, while 36% reported being
(Weeks 14–20). It increased in the week when the treated ‘badly’ (Chart 2).
survey was launched, but remained lower than In interviews, most residents and NGO workers thought
in 2019 (Table 2). Both interviews and the survey that people in their areas had been treated fairly by
asked respondents about the ‘lockdown’ rather than authorities, though some complained of police abuses:
lockdown levels. ‘I understand that sometimes people do not abide by
Chart 1: Do you approve of the way lockdown has Chart 2: Have you interacted with police or law
been enforced in your community? enforcers during lockdown?
13%
22%
16% 39%
17%
71%
22%
Yes, I was treated badly No
Yes No Don’t know Yes, I was treated okay Yes, I was treated well
SOUTHERN AFRICA REPORT 44 | MARCH 2021 5rules but excessive force does not have to be used,’ (Resident). Similarly,
law enforcement and SAPS officers interviewed said that residents
generally abided by their instructions: ‘Most listen to us. Most give us
respect,’ (LLEO).
Asked about police visibility, first before and then during lockdown, few
survey respondents noted a difference. Close to 50% reported seeing police
daily and 25% seeing them weekly in both periods. Interview respondents
were more likely than survey respondents to report increased police visibility,
though some expressed surprise at how few police were around: ‘[There’s]
almost been zero law enforcement and policing in the areas … Very little
visibility,’ (NGO).
Whether residents perceived it or not, police and law enforcers believed
they were more visible, at least during the early lockdown: ‘The police, law
enforcement and SANDF patrol the streets, and are very visible,’ (LLEO);
‘It is much easier to enforce the regulations with SANDF, law enforcement
and metro,’ (SAPS).
Like visibility, survey respondents reported stable levels of trust in police
and law enforcement, with roughly 35% reporting ‘a lot’ of trust both
before (Chart 3) and then during lockdown (Chart 4), and 24% reporting
none ‘at all’.
Despite general satisfaction with lockdown enforcement (Chart 1) and a clear
decline in murder in the three areas (Table 2), 31% of survey respondents
believed violent crime had increased in their community during lockdown
while 42% thought it had decreased (Chart 5).
Chart 3: H
ow much did you trust police and other law Chart 4: How much do you trust police and other law
enforcers BEFORE the lockdown? enforcers NOW?
23% 24%
35% 35%
39%
8% 34% 9% 32%
Not at all Just a little Not at all Just a little
Somewhat A lot Somewhat A lot
6 LOCKDOWN LESSONS: VIOLENCE AND POLICING IN A PANDEMICIn contrast, most interviewees believed crime had declined, especially law
enforcers and police: ‘There is a huge change. Each and every day at Delft
you would hear there is a scene where someone has been shot. That’s not
happening now, I’ve not heard about shootings,’ (LLEO).7
Both survey and interview respondents were asked why they thought violent
crime had changed. Thirty-one per cent of survey respondents felt it was due
to the ban on alcohol, while 26% attributed it to restrictions on movement
(Chart 6). Only 16% credited ‘more policing’.
Many interviewees also perceived a link between the alcohol ban and
crime: ‘Before lockdown people would drink and commit crime or fight …
During lockdown, there was nothing of that sorts,’ (LLEO); ‘Because there’s
less alcohol, there are less people gallivanting in the streets late at night,’
(NGO employee). Another common view among residents was that police
visibility had aided the decline in violence: ‘It makes sense that murder has
decreased because there is so much police visibility,’ (Resident).
Other interviewees believed the perceived reduction was due to limitations in
movement: ‘It went down because no one is outside. [Crime] used to happen
in the mornings, on the way to work,’ (Resident). In Delft and Philippi, some
residents attributed the change to a pause in gang violence.8 ‘There is usually
a lot of shooting that we hear on a daily basis and all that gang activity. Since
the lockdown this has really decreased,’ (Resident).9
The survey also asked respondents whether they and/or someone they knew
had been a victim of crime during lockdown. A surprising proportion (29%)
said they had. This is much greater than the national rate of 0.25%–6%, or
Chart 5: D
o you think violent crime in your community has
increased or decreased during the lockdown? Chart 6: W
hy do you think violent crime has changed?
12% 8%
7%
31% 31%
15%
12%
16%
42% 26%
Increased Decreased Couldn’t buy alcohol Can’t move around easily
Stayed the same I don’t know More policing More poverty Stress Other
SOUTHERN AFRICA REPORT 44 | MARCH 2021 7the provincial average of 5%–9%.10 It is possible that Despite this, half of the survey respondents felt ‘very
crime victims were more inclined than non-victims to safe’ in their community during lockdown (Chart 7), as
complete the survey. Twenty-six percent said they knew well as in the preceding year (Chart 8).
others in their community who had experienced crime
Finally, both our survey and interviews probed the
during lockdown.
subject of domestic violence, with respondents offering
mixed views on its possible increase/decline (Chart 9).
Chart 7: Over the past year, how safe have you felt in Some interviewees were concerned that being stuck at
your community? home may aggravate violence, while others thought the
alcohol ban may prevent conflict.
Domestic violence complaints to police
13% 18%
remained consistent in the first four to
six weeks of lockdown
Importantly, the three SAPS station commanders
18%
reported consistency in domestic violence complaints
in the first four to six weeks of lockdown (Weeks 14–20),
51% despite noting significant declines in other violence. This
may suggest that domestic violence remained constant
but did not increase, possibly due to the alcohol ban. As
we discuss in the next section, across all 11 areas there
was a 50% reduction in the murder of women in the early
A bit unsafe Fairly safe lockdown period compared to 2019.
Very safe Very unsafe
Chart 9: Do you think violence within families has
Chart 8: During lockdown, how safe have you felt in increased or decreased during lockdown in
your community? your community?
12% 16% 11%
14%
39%
23%
49%
36%
A bit unsafe Fairly safe Increased Decreased
Very safe Very unsafe Stayed the same I don’t know
8 LOCKDOWN LESSONS: VIOLENCE AND POLICING IN A PANDEMICMurder data During this period murder increased by 6% in the
11 areas compared to 2019. Under Level 2, only one less
Murder – the numbers
murder was committed compared to 2019, and under Level
The interview and survey data provide insights into 1 murder had increased by 59% by 17 October 2020.
experiences of policing and safety in three of our eleven
study areas during the first three months of the lockdown. Table 3: Number of murders in 11 areas in Weeks 14–42
We also tracked murder incidents in all 11 areas, the
2019 2020 Change
methods used and the gender of victims from 1 January to
17 October, using data from the Western Cape FPS. Full lockdown 1 054 982 –7%
Figure 1 shows that fewer murders occurred in the 11 areas Level 5 157 83 –47%
in the first three months of 2020 (n=328) than in the same Level 4 129 80 –38%
period in 2019 (n=368), suggesting that violence was already
Level 3a 295 267 –10%
slightly subdued before lockdown.
Level 3b 166 176 +6%
Murder fell by 47% in the first four weeks of lockdown (Level
5) compared to the same period in 2019 (Table 3) and was Level 2 188 187 –0.5%
38% lower in the second four weeks (Level 4). With the
Level 1 (to 17 Oct) 119 189 +59%
relaxing of regulations under Level 3a – most notably the
unbanning of alcohol and opening of the economy – murder While the year began with fewer murders than 2019,
increased to just 10% below 2019’s figure. and despite the number of murders plummeting during
After four weeks, alcohol was again banned while other early lockdown, by September and October it had
regulations remained constant (Level 3b). increased compared to the same period in 2019.
Figure 1: Number of murders in the 11 priority areas in Weeks 1–42
80
Level 5 Level 4 Level 3a Level 3b Level 2 Level 1
Alcohol Alcohol Alcohol Alcohol Alcohol Alcohol
banned banned unbanned banned unbanned unbanned
70
60
Number of murders
50
40
30
20
10
0
1 2 3 4 5 6 7 8 9 10 11 12 13 14 15 16 17 18 19 20 21 22 23 24 25 26 27 28 29 30 31 32 33 34 35 36 37 38 39 40 41 42
2019 13 28 21 24 39 39 25 27 34 30 27 32 29 41 23 24 36 33 22 28 36 43 66 34 39 42 67 47 32 27 36 44 27 43 44 34 42 25 35 25 27 32
2020 13 13 17 21 25 34 19 25 30 40 31 31 29 9 7 21 16 30 19 19 17 26 64 29 38 38 59 40 28 31 48 42 30 43 35 41 31 36 44 48 58 39
Week
2019 2019 2020 2020
SOUTHERN AFRICA REPORT 44 | MARCH 2021 9Murder – method gunshots, and 28%–36% from sharp objects (Table 4).
In contrast, under Levels 5 and 4, 72% and 73% of
Figure 2 and Table 4 show that the pre-lockdown decline
murders were firearm related. This dropped to 63%
in murder was attributed to less sharp-object violence.
under Level 3a (when alcohol was unbanned) and
More people were killed with firearms in the first three
increased to 78% when alcohol was again banned
months of 2020 (n=201) than in 2019 (n=187), while far
(Level 3b).
fewer were killed with sharp objects in early 2020 (n=73)
than in 2019 (n=128). This suggests that patterns of Under Level 2 and 1, 65% of murders were firearm
violence had already changed before the pandemic. related (up to Week 42/17 October), marginally up from
2019, and the same as the pre-lockdown proportion.
While the number of people killed with firearms dipped
under Levels 5 and 4, the decline was marginal This data suggests a correlation between the alcohol
compared to sharp-object murders. From April to ban and reductions in sharp-object murders, but not
October 2019, 49%–59% of murders resulted from firearm murders.
Table 4: Percentage of murders in 11 areas by gunshot, sharp object and other means
Pre- Level 5 Level 4 Level 3a Level 3b Level 2 Level 1
lockdown (No alcohol) (No alcohol) (No alcohol) (17 October)
Method 2019 2020 2019 2020 2019 2020 2019 2020 2019 2020 2019 2020 2019 2020
Gunshot 51% 65% 52% 72% 53% 73% 59% 63% 49% 76% 60% 65% 59% 65%
Sharp object 35% 23% 36% 11% 34% 9% 28% 24% 31% 11% 25% 23% 24% 24%
Other 14% 12% 13% 17% 13% 19% 13% 15% 20% 13% 15% 12% 18% 11%
Figure 2: Number of murders in 11 areas by gunshot, sharp object and other means
400 Pre lockdown Level 5 Level 4 Level 3a Level 3b Level 2 Level 1
Alcohol Alcohol Alcohol Alcohol Alcohol Alcohol
banned banned unbanned banned unbanned unbanned
350
300
187%
Number of murders
250
201% 174%
200
165%
150
82% 113% 121% 123%
128% 81% 136%
100 68%
82% 70%
73% 63%
51%
50 56% 60% 59% 47%
43% 45%
44% 20% 28%
53%
38% 9% 7% 39% 40% 33% 28%
20% 14% 17% 15% 23% 22% 21% 21%
0
2019
2020
2019
Alert level 5
2020
2019
Alert level 4
2020
2019
Alert level 3a
2020
2019
Alert level 3b
2020
2019
Alert level 2
2020
2019
Alert level
2020
Levels
Other Sharp object Gunshot
10 LOCKDOWN LESSONS: VIOLENCE AND POLICING IN A PANDEMICMurder – gender Level 4 to 4% (Figure 3). With the reintroduction of
alcohol under Level 3a, the proportion of female
There was a significant variance in the gender of victims
victims doubled to 9%. When alcohol was banned
during lockdown compared to the same period in 2019.
(but other factors remained constant) under Level
Although overall murder declined by 18% in Weeks
3b, 6% of victims were female. With its reintroduction
14–33, the number of female victims declined by 36%.
(and the broader relaxing of regulations) under
Before lockdown, roughly 9% of murder victims were Level 2, females accounted for 8% of victims, and 7%
female. Under Level 5, this dropped to 5% and under under Level 1.
Figure 3: Percentage of murder victims by gender
100 5% 4% 6%
9% 8% 7%
90
80
70
60
Percentage
95% 96% 91% 94% 92% 73%
50
40
30 Level 5 Level 4 Level 3a Level 3b Level 2 Level 1
Alcohol Alcohol Alcohol Alcohol Alcohol Alcohol
20 banned banned unbanned banned unbanned unbanned
10
0
Level 5 Level 4 Level 3a Level 3b Level 2 Level 1
Levels
Male Female
Figure 4: Method of murder per level – females
100
90
80
47%
57%
70 65%
75% 75%
60
Percentage
50 100%
20%
40
30 29%
17%
20
33%
25% 25%
10 17% 14%
0
Level 5 (14–18) Level 4 (19–22) Level 3a (23–28) Level 3b (39–33) Level 2 (34–38) Level 1 (39–42)
Levels
Other Sharp object Gunshot
SOUTHERN AFRICA REPORT 44 | MARCH 2021 11Figure 5: Method of murder per level – males
100
90
80
70 61%
66%
67%
72% 72%
76%
60
Percentage
50
40
30
24%
9% 23%
20 11%
10%
23%
10 16% 19%
15% 14% 11%
10%
0
Level 5 (14–18) Level 4 (19–22) Level 3a (23–28) Level 3b (39–33) Level 2 (34–38) Level 1 (39–42)
Levels
Other Sharp object Gunshot
The number of female victims declined during the same periods in which
sharp-object murders declined, i.e. when alcohol was banned (Figure 3).
However, most female victims were killed with firearms rather than sharp
objects (Figure 4 and 5). This suggests a correlation between alcohol,
firearms and female murders.
Discussion
Patterns of violence significantly changed with the introduction of South
Africa’s 2020 COVID-19 lockdown. Although a third of survey respondents
credited the early decline to the alcohol ban, it is likely that strict
limitations on movement and the near-closure of the economy explain
the bulk of the change.11 With less movement and social interaction, and
with heightened surveillance as people stayed put, there were fewer
opportunities for violence beyond the home.
There was a larger reduction in fatal violence against
women than men during lockdown, and it was most
pronounced when alcohol was banned
Survey and interview respondents generally approved of the way
the initial hard lockdown was enforced, with most indicating they’d
THE PROPORTION OF
like such enforcement to continue. However, it was not obvious that
FEMALE MURDER VICTIMS
HALVED WHEN ALCOHOL
they had noticed a significant difference in policing, or that feelings
WAS BANNED of safety or trust in police had changed during the lockdown. The
unprecedented decline in murder seems to have done little to improve
12 LOCKDOWN LESSONS: VIOLENCE AND POLICING IN A PANDEMICthese perceptions, with numerous respondents reporting experiences or
knowledge of crime during lockdown.
Fewer murders occurred in the 11 areas in the first three months of 2020
than in the same period in 2019, suggesting that violence was already
slightly subdued. However, more people had been killed with firearms
in early 2020 than in 2019, suggesting a pre-lockdown change in the
nature of violence.
Sharp-object murders more than halved under Levels 5, 4 and 3b when
alcohol was banned, but doubled under Levels 3a, 2 and 1 when it was
reintroduced. This trend matches that found in six years of Western
Cape murder data (2010–2016) where 50% of sharp-object murder
victims tested positive for alcohol compared to only 27% of firearm
victims.12 As such, alcohol restrictions may have reduced impulsive,
interpersonal violence and possibly prevented a spike in domestic
violence during lockdown.
While domestic violence accounts for only about 6% of provincial
murders,13 our data show a much larger reduction in fatal violence
against women than men during lockdown. This was most pronounced
when alcohol was banned.
Neither the alcohol ban, nor any other intervention,
appears to have had a significant impact on
firearm-related murder in the province
Neither the ban, nor any other intervention appears to have had a
significant impact on firearm-related murder in the province. While the
number of people killed with firearms dipped under Levels 5 and 4, the
declines were marginal compared to those caused by sharp objects.
The same trend is not evident in national data.
In 2018, SAPS reported that 42% of Western Cape murders were firearm
related and 34% were caused by knives and sharp objects.14 In 2019,
these figures were 46% and 31% respectively.15 FPS data suggests
similar increases in firearm-related violence in the province, with firearms
accounting for 65% of murders in the first three months of 2020.
In a SAPS sample of 2 410 murders countrywide between April and
June 2020, firearms were used in 45% (n=1 089) of offences, and knives
and other sharp instruments in 24% (n=584).16 By contrast, FPS data
show that in the Western Cape, over the same period, 71% of murders
were firearm related and 19% sharp-object related.
SHARP-OBJECT MURDERS
This may indicate the impact of gang-related murders in the province and in our MORE THAN HALVED WHEN
11 focus areas, but this should not be assumed. In 2019, the SAPS reported that ALCOHOL WAS BANNED
just 24% of murders in the province were gang related, up from 19% in 2018.17
SOUTHERN AFRICA REPORT 44 | MARCH 2021 13Most of these (95%) were committed with firearms.18 If this While 2020 began with fewer murders than 2019, and
assessment is accurate, gang violence could not account despite murders plummeting during the early lockdown,
for the bulk of firearm-related murders in 2020. by September and October more people were being
Whether firearm-related murder is driven by gangs or not, murdered than during the same months in 2019, 65%
both SAPS and FPS data suggest a gradual increase in of them with firearms. By December 2020, SAPS data
the number of such murders since 2018. showed that murder had increased in the Western Cape
and the country as a whole.
Two key lessons from this study are that both alcohol
and firearms require better regulation. If the alcohol It will be important for police and law enforcers to rein
ban helped decrease sharp-object, opportunistic and this trend in. Evidence suggests they can do
possibly domestic violence, then better regulation of this if they adopt carefully planned problem-oriented and
alcohol may do the same in the future. intelligence-driven strategies that are understood and
However, the data also suggest that patterns of firearm- embraced by all involved, are limited in scope, and are
related violence may persist irrespective of the availability carefully implemented. Police and law enforcers can’t be
of alcohol or restrictions on movement. As such, alcohol everywhere or do everything, but they should be able
enforcement must be accompanied by the full regulation to regulate the sale and consumption of alcohol, the
of firearms, focusing particularly on the removal of illegal possession of illegal firearms and the sale of ammunition.
firearms, and on identifying and removing corrupt officials If they do this effectively, they could drastically reduce
who feed them back to communities. murder in the Western Cape.
Notes
1 South African Police Service. Twelve Months 2019/2020 Crime news/south-africa/western-cape/watch-gangs-in-manenberg-call-
Statistics Presentation, www.saps.gov.za/services/april_to_ truce-to-help-community-weather-lockdown-46589588.
march_2019_20_presentation.pdf. 10 Statistics South Africa. P0341 Victims of crime survey 2019
2 South African Police Service. Second Quarter Crime Statistics (Governance, Public Safety, and Justice), www.statssa.gov.
2020/21, www.saps.gov.za/services/crime_statistics_july_ za/?page_id=1856&PPN=P0341&SCH=72635.
september_2020_21.xlsx. 11 B Stickle and M Felson, Crime rates in a pandemic: The largest
3 Western Cape Government. Violence crime in 11 priority areas of criminological experiment in history, American Journal of Criminal
the Western Cape during the COVID-19 lockdown, 18 August 2020, Justice, 45, 2020, 525–536, https://doi.org/10.1007/s12103-
www.westerncape.gov.za/files/20200629_violent_crime_during_ 020-09546-0; L Cohen and M Felson, Social change and crime
lockdown_-_report_final_with_recommendations_1.pdf. rate trends: A routine activity approach, American Sociological
4 South African Police Service. Crime Statistics 2019/20, www.saps. Review, 44:4, 1979, 588–608, www.jstor.org/stable/2094589.
gov.za/services/Crime-Statistics-2019_2020.xlsx. 12 Western Cape Government. Western Cape Injury Mortality Profile
5 Interviews were conducted from 30 April to 12 May 2020. 2010-2016. 2018, www.westerncape.gov.za/assets/departments/
6 K Masweneng, 300,000 arrested for breaking lockdown laws: health/mortality_profile_2016.pdf.
Bheki Cele, Times Live, 14 August 2020, www.timeslive.co.za/ 13 South African Police Service. Western Cape Annual Report 2018/19,
politics/2020-08-14-300000-arrested-for-breaking-lockdown-laws- https://static.pmg.org.za/191127SAPS_Western_Cape_2018-19_
cele/. Annual_Report.pdf.
7 When interpreting the views of the LLEOs, it is important to bear 14 South African Police Service. Crime situation: Western Cape 2017/18
in mind that those who were interviewed were all fairly new to law financial year, Presentation in Parliament, 26 September 2018.
enforcement. 15 South African Police Service. Western Cape Annual Report 2018/19,
8 This is supported by other research: J Stanyard, Gangs in lockdown: https://static.pmg.org.za/191127SAPS_Western_Cape_2018-19_
Impact of COVID-19 restrictions on gangs in East and Southern Annual_Report.pdf.
Africa, Global Initiative Against Transnational Organized Crime, 2020, 16 South African Police Service. First Quarter Crime Statistics 2020/21,
https://globalinitiative.net/wp-content/uploads/2020/10/Gangs-in- www.saps.gov.za/services/April_June%202020_2021.pdf.
lockdown-Impact-of-COVID-19-restrictions-on-gangs-in-east-and- 17 South African Police Service. SAPS Western Cape Annual
southern-Africa-GITOC.pdf. Report 2018/19. Presented to Standing Committee of Police,
9 This may be a reflection of the alleged truce that opposing gangs 26 November 2019, p.72, https://static.pmg.org.za/SAPS_
called in Manenberg and other parts of the Cape Flats to focus on Presentation_-_20182019_Annual_Report.pdf.
helping community members during the COVID-19 pandemic. For 18 South African Police Service. Western Cape Annual Report 2018/19,
example, S Ryklief, WATCH: Gangs in Manenberg call truce to help https://static.pmg.org.za/191127SAPS_Western_Cape_2018-19_
community weather lockdown, IOL, 11 April 2020, www.iol.co.za/ Annual_Report.pdf.
14 LOCKDOWN LESSONS: VIOLENCE AND POLICING IN A PANDEMICVisit our website for the latest analysis, insight and news
The Institute for Security Studies partners to build knowledge and
skills that secure Africa’s future
Step 1 Go to www.issafrica.org
Step 2 Go to bottom right of the ISS home page
and provide your subscription details
SOUTHERN AFRICA REPORT 44 | MARCH 2021 1530
YEARS
About the authors
Andrew Faull is a Senior Researcher, Justice and Violence Prevention, at the Institute for
Security Studies (ISS).
Jane Kelly is a Research Officer at the Centre for Social Science Research, University of
Cape Town.
Amanda Dissel is Director, Policy and Research at the Western Cape Department of
Community Safety
About ISS Southern Africa Reports
Southern Africa Reports provide the results of in-depth research on the latest human
security challenges in the region. Some reports analyse broad conflict trends and threats to
peace and security in specific Southern African countries. Others focus on challenges in the
region such as electoral reform, corruption, or intra-state conflict.
About the ISS
The Institute for Security Studies (ISS) partners to build knowledge and skills that secure
Africa’s future. The ISS is an African non-profit organisation with offices in South Africa,
Kenya, Ethiopia and Senegal. Using its networks and influence, the ISS provides timely and
credible policy research, practical training and technical assistance to governments and
civil society.
Development partners
This report is funded by the Hanns Seidel Foundation and the Bavarian State Chancellery.
The ISS is also grateful for support from the members of the ISS Partnership Forum: the
Hanns Seidel Foundation, the European Union, the Open Society Foundations and the
governments of Canada, Denmark, Ireland, the Netherlands, Norway, Sweden and the USA.
© 2021, Institute for Security Studies
Copyright in the volume as a whole is vested in the Institute for Security Studies and the authors, and
no part may be reproduced in whole or in part without the express permission, in writing, of both the ISSN 2617-8206 Print
author and the publishers. ISSN 2617-8214 Digital
The opinions expressed do not necessarily reflect those of the ISS, its trustees, members of the
Advisory Council or donors. Authors contribute to ISS publications in their personal capacity.
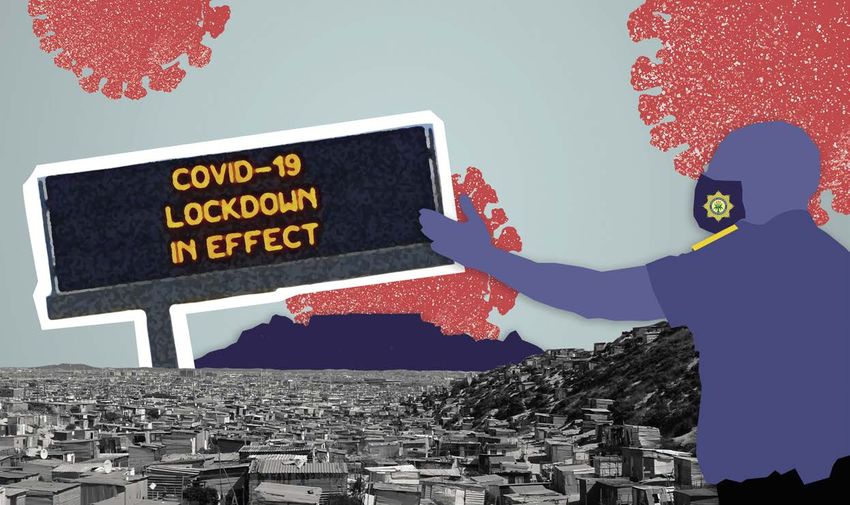
Cover image: © Amelia Broodryk/ISS
9 772617 821002You can also read