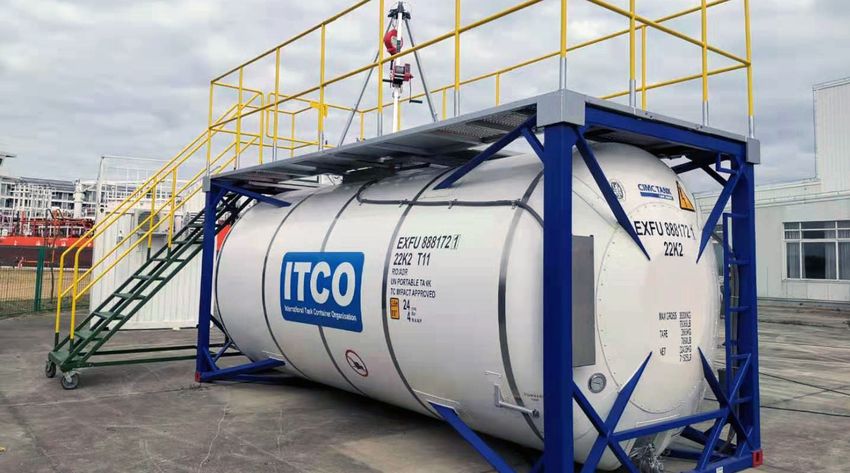
GLOBAL TANK CONTAINER FLEET SURVEY - 2021 Global Tank Container Survey Operators and Leasing company fleets New manufacture analysis Historic ...
←
→
Page content transcription
If your browser does not render page correctly, please read the page content below
2021
    GLOBAL TANK
    CONTAINER FLEET
    SURVEY

    Global Tank Container Survey
    Operators and Leasing company fleets
    New manufacture analysis
    Historic Development of the Global Tank Container Fleet
    Future development of ITCO and the Tank Container Industry

1
2021
GLOBAL TANK CONTAINER
FLEET SURVEY
Contents
Introduction											3

The Global Tank Container Fleet – An Overview							                                     4

Table 1: Global Tank Container Fleet (at 1 January 2021)						                           4

Figure 1: Top 10 Tank Container Operators (at 1 January 2021)						                      5

Figure 2: Top 10 Tank Container Leasing Companies (at 1 January 2021)					               5

Figure 3: Global Tank Container Production in 2020							                                6

Table 2: Global Tank Container Development by Year (1 Jan 2013 – 1 Jan 2021) 				        7

Table 3: Comparative Tank Production and Global Fleet Growth (1991 – 2020)				           8

Figure 5: The production and fleet capacity of tank containers (1 Jan 1992~2021)   			   9

Table 4: Tank Container Operators Fleet at 1 January 2021						                          10

Table 5: Tank Container Leasing Fleet at 1 January 2021						                            11

Table 6: Tank Container Production in 2020								                                       12

Methodology											13

ITCO Vision: The Next Decade									15

ITCO – International Tank Container Organisation
Suite 3, Charter House, 26 Claremont Road, Surbiton KT6 4QU United Kingdom

T: +44 (0)20 8390 0000 | E: hicks@itco.org | W: www.itco.org

2
ITCO 2021 Survey reveals industry growth of 5.3% in 2020
compared to 7.9% in 2019

Global Tank Container Fleet reached                               manufacturers in 2021. The cyclical nature of the industry
                                                                  continues - a phenomenon witnessed by the industry over
686,650 by 1 January 2021
                                                                  the past 25 years.

Market uncertainty during 2020 – primarily caused by the
                                                                  In 2020, a total of 35,800 tank containers were built,
global COVID-19 pandemic – resulted in growth in the global
                                                                  compared to 54,650 tank containers in 2019, a decrease of
tank container business slowing down, compared to previous
                                                                  some 18,850 units.
years. By the end of the year, however, there were clear signs
of a recovery in orders for new equipment – indicating a
                                                                  As in previous Editions, this Survey analyses the growth
considerably improved situation in 2021.
                                                                  in the world’s tank container fleet and the development
                                                                  of production of tank containers on a year-by-year basis.
However, the tank container market continued to expand
                                                                  It shows how, numerically, the industry continues to be
in 2020 – with the benefits of the tank container as a “just-
                                                                  dominated on a global level by a relatively small number of
in-time” alternative mode of shipment being increasingly
                                                                  major tank container operators and leasing companies.
recognised. More companies are turning to the tank
container, and operators are succeeding in successfully
                                                                  The top 10 operators account for over 246,630 tanks
converting certain cargoes - previously shipped in drums
                                                                  representing over 55% of the global operators’ fleet. The
or transported in chemical tankers – to tanks. In addition,
                                                                  top 10 leasing companies account for over 250,000 tanks,
China continued to see significant growth in the use of tank
                                                                  about 79% of the total leasing fleet. The top three leasing
containers for domestic transport of bulk liquids, while inter-
                                                                  companies account for nearly 159,000 tanks, approximately
Asia – especially South-East Asia – tank operations continue
                                                                  50% of the total fleet.
to develop strongly.

                                                                  Based on its successful growth in recent years, the industry
Unlike in 2019, when much of the investment was
                                                                  is continuing to attract smaller players to enter the market –
undertaken by the leasing sector, 2020 saw moderate
                                                                  often offering “niche” tank services in niche markets, such as
expansion of both operator-owned and leasing company
                                                                  south-east Asia.
fleets. The market remains strong - with attractive prices
for new containers, together with low interest rates and
                                                                  As in previous years, this Survey lists those companies which
greater efficiencies by all sectors - contributing to a highly
                                                                  are operating or leasing tank container fleets of over 1000
competitive industry.
                                                                  units. Companies with tank container fleets of less than 1000
                                                                  units, (about 200 of them) have not been named individually,
The unexpected shortage of capacity on containerships from
                                                                  but an “educated estimate” has been made for the combined
Asia to the main markets of North America and Europe led to
                                                                  fleets.
significantly increased freight rates, which also impacted the
industry.
                                                                  The International Tank Container Organisation would like to
                                                                  take this opportunity to thank the various companies who
Following on from the record year of grown in the industry
                                                                  have contributed to this study. Your input and information,
in 2019, this year’s ITCO Tank Container Fleet Survey
                                                                  statistics and ideas are very much appreciated.
nevertheless reports substantial growth in the tank
container business during the past 12 months. Production of
containers in China continues to dominate the industry.
                                                                  DISCLAIMER
According to the 2020 ITCO Global Tank Container Survey,
the worldwide tank container fleet grew by over 5 percent
                                                                     Great care has been taken to ensure the
in 2020 over 2019. This year’s Survey estimates that, at
                                                                     information published in this Survey is accurate,
1 January 2021, the global tank container fleet stood at
                                                                     but the International tank Container Organisation
686,650 units worldwide, compared to the figure of 652,350
                                                                     accepts no responsibility for any errors or
on 1 January 2020. This represents a year-on-year growth
                                                                     omissions. All responsibility for action based on any
of 5.26%, compared to the 7.88% growth achieved in the
                                                                     information in this Survey rests with the reader.
previous year.
                                                                     ITCO accepts no liability for any loss of whatever
                                                                     kind, arising from the contents of this Report.
The number of tank containers produced last year was lower
than in 2019 - but early indications indicate an upturn for

3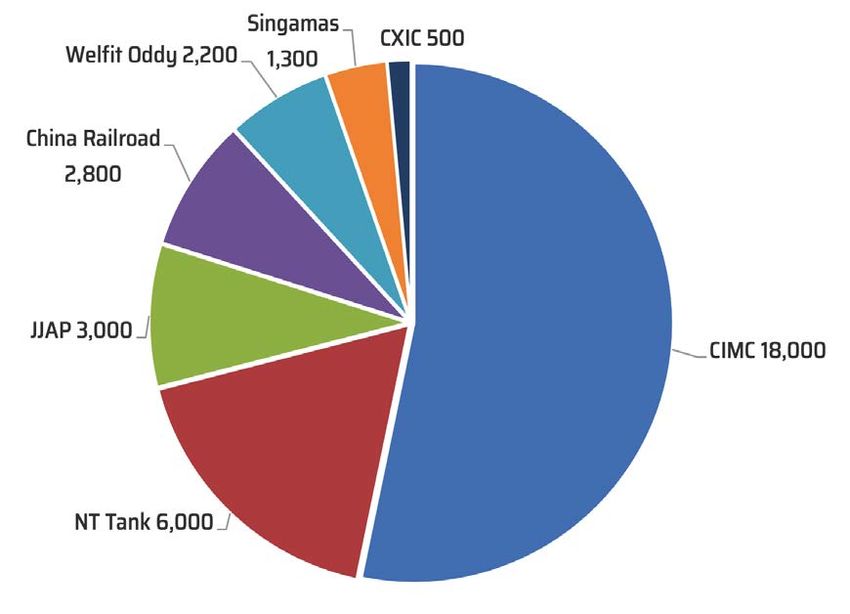
The Global Tank Container Fleet
at the beginning of 2021: Overview
Table 1: Global Tank Container Fleet (1 January 2021) Notes:
Number of Operators Worldwide 230-plus * Idle Tanks
Total Number of Operator Fleets 443,110 Tanks might be “idle” because they are in the process
(Owned & Leased -in) of preparation such as maintenance and testing or in
the process of being repositioned to a demand area or
remaining as new manufacture stocks.
Number of Tank Lessors Worldwide 37-plus This normally represents between 10% and 15% of the
Tank Containers in Leasing Company Fleets 316,710 leasing company fleet at any one time. For this survey,
we have estimated the figure of idle tanks to be 14% of
the leased fleet,
Tanks on lease to Operators, Shipper 272,310 **Shipper (also referred to as called producers or
and Others Users consignors) fleet
“Idle” leaseco tanks* (M&R, testing, storage) 44,400 The Shipper Fleet comprises tanks operated by
producers of bulk cargoes, for shipment in tanks –
especially chemical and food/drinks companies.
Shippers** and Others*** These tanks can be units for specific logistics operations,
dedicated services or for use within a company’s own
Total (Owned and leased) 199,140
production process. The are also often “special” tanks
manufactured or modified to meet a specific need
Tanks Built in 2020 (estimate) 35,800 and include tanks designed to transport liquefied and
refrigerated gases.
*** Others
Disposals**** 1,500 “Others” (ie “Other Tank Users”) include the many tanks
operated by organisations such as military, shipping
and barge lines, rail, oil and mining industries, China
domestic and companies that use tanks for storage or
Estimated Total Global Tank Containers 686,650
special transport operations such as bitumen.
(Calculated: Tanks in Operator Fleets +
Lessors “Idle” Tanks + Tanks in Shippers and
Some of the tanks disposed from operator and lessor
fleets might be modified and utilised within this
“Others” Fleets)
category.
Table 1 shows the estimated global number of tanks by **** Disposals
industry sector. Tank containers are normally depreciated over a residual
life of 20 years but often remain in service for a longer
The total operator and leasing fleet is based on the in- period. Operators have recognised that the operational
dustry response to the Survey and other research. life of the tank can be extended. Evidence indicates that
The leasing fleet is accounted within both the operator tanks can now last longer
and also the shipper fleets, except for those tanks which The service life of the tank can be extended by
are “idle”. (Definition of “idle tanks” on next column) remanufacture (refurbishment). This is especially viable
“Shipper” and “others” fleet is estimated in accordance when the price of new tanks is at a higher level.
with the methodology detailed at the end of this Survey. Owners might dispose of tank containers for commercial
The Survey indicates that there were 686,650 tank and technical reasons. These might be converted into
containers worldwide at the beginning of 2021 including other uses, such as storage.
annual manufacture in 2020 of 35,800 new tanks Some tanks are sold for re-cycling as scrap metal,
Taking into account an estimated 1,500 disposals especially if the tank is seriously damaged beyond
(scrapped or sold for static storage), the 1 January 2020 economic repair.
fleet size of 652,350 therefore grew to 686,650 at the Scrap might be a viable economic option when the
beginning of 2021. commercial price of scrap stainless steel rises.
This represents a growth of 5.3% from 1 January 2020 to Precise data about tank disposal and scrapping is
1 January 2021. difficult to research. For this year’s survey, we have
estimated a nominal figure of 1500 tanks being scrapped
in 2020.
4
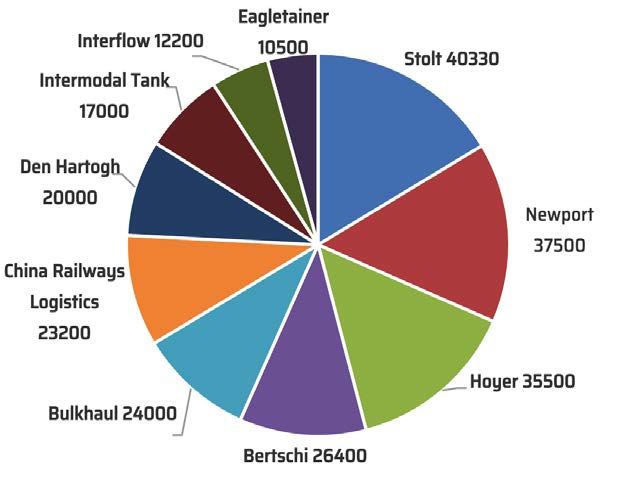
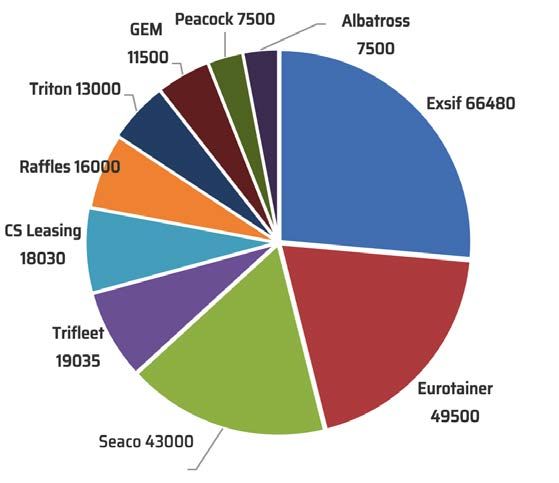
Top Ten Tank Container Operators

There are over 230 operators of tank containers
known to ITCO, ranging from very large global
companies to relatively small niche and regional
players.

Shown by Figure 1, at 1 January 2021, the top
ten operators accounted for over 246,630 tanks
representing over 55% of the global operators’
fleet – calculated to be over 443,100 tanks.

(At the same time last year, the top 10 operators
accounted for 235,019 tanks, which represented
over 56% of the global operator’s fleet).

Figure 1: Top Ten Tank Container Operators (at
1 January 2021)

Top Ten Leasing Companies

At least 37 companies worldwide provide
tank container leasing services. These range
from large global lessors to regional and local
companies. The 37 lessors identified by ITCO
have a combined fleet of 316,710 tanks.

The top 10 lessors account for 251,545 tanks,
about 79.5% of the total leasing fleet.

The top 3 companies account for 158,980 tanks
of the total leasing fleet, or 50.2 %, compared
with 50.5 % last year.

Figure 2: Top Ten Tank Container Leasing
Companies (at 1 Jan 2021)

5
Top Tank Container Manufacturers
In 2020, the combined number of tank containers produced by all of the world’s manu-
facturers totalled 35,800 new units.
Tank Container manufacturing is concentrated in China. The only other large volume
manufacturer is based in South Africa .
The leading Tank Container Manufacturers producing the highest number of tanks are
as follows: CIMC, NT Tank, Welfit Oddy, Singamas, JJAP, CRRC and CXIC. These top seven
represent 95% of global manufacture.
The majority of production is of the industry standard tank range but nevertheless there
is a very active and growing specialised tank sector.
Figure 3: Production figures of the top 7 Tank Container manufacturers in 2019
6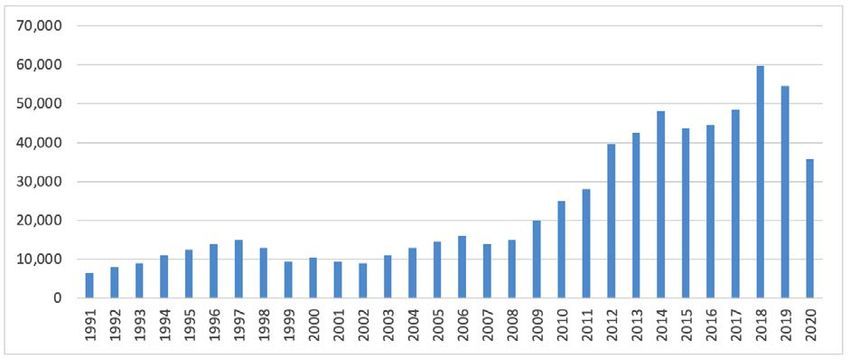
Table 2: Annual Global Tank Container Growth (1 Jan 2013 - 1 Jan 2021)

                                      Year
                                               2021      2020      2019         2018     2017      2016      2015      2014      2013
 Players/Tank Type

 Operators - Number                            230       218       212          210       209      205       194       176       116

 Total Fleet (Owned and leased-in)            443,110   418,500   381,750     365,000   342,500   329,080   305,700   265,550   228,460

 Leasing Companies - Number                     37        37        35           36       36         36       33        34        27

 “Idle” Leasing Company Tanks                 44,400    45,840    42,785       32,000   28,500    20,175    23,400    17,650    15,000

 On-lease to Operators, Shippers, Others      272,310   259,775   243,200     213,000   186,765   181,575   171,600   158,850   135,400

 Total                                        316,710   305,615   286,000     245,000   215,265   201,750   195,000   176,500   150,400

 Shipper / Others (Military, Offshore, etc)

 Total (Owned and Leased)                     199,140   188,010   180,165     155,000   137,400   110,950   107,460   103,000   94,800

Manufactured (in the previous year)           35,800    54,650    59,700       48,500   44,500    43,780    48,200    42,620    39,700

Disposal*                                      1,500     7,000     7,000       4,500     4,500     2,000     5,000     1,000       -

Grand Total                                   686,650   652,350   604,700     552,000   508,000   458,200   427,560   385,200   338,260

Growth % compared with preceding
                                               5.26      7.88      10.81        8.66      8.5      7.16      10.99     13.87      n/a
year**

Notes:
* Disposals: Figures for disposals are not easily verified due              ** Growth: Percentage growth is reported showing the
to the difficulty in estimating since respondents tend to not               growth for the year compared with the preceding Survey.
reveal details of their fleets. Disposals result from repair
costs exceeding the economic value of the tank and or the                   Table 2 summaries ITCO Surveys completed since 2013.
age profile required by some users. Prevailing low material                 The estimated 2020 growth, compared with 2019 is
prices, exchange rates and interest rates lowered the cost of               about 5.26%. Shipper owned fleets are not considered to
the new tank. This reflects on the decision whether a heavily               be growing significantly, due to the trend to outsource
damaged unit is economic to repair or remanufacture.                        logistics to operators. The 2014 and 2015 “shipper &
Some disposals are purchased by others and modified for                     others owned fleet” has been adjusted, to reflect a
continued use outside of mainstream sector and perhaps                      static position, but the leased part of the fleet shows a
accounted in this Survey in the “others” category.                          percentage increase in line with the methodology.

7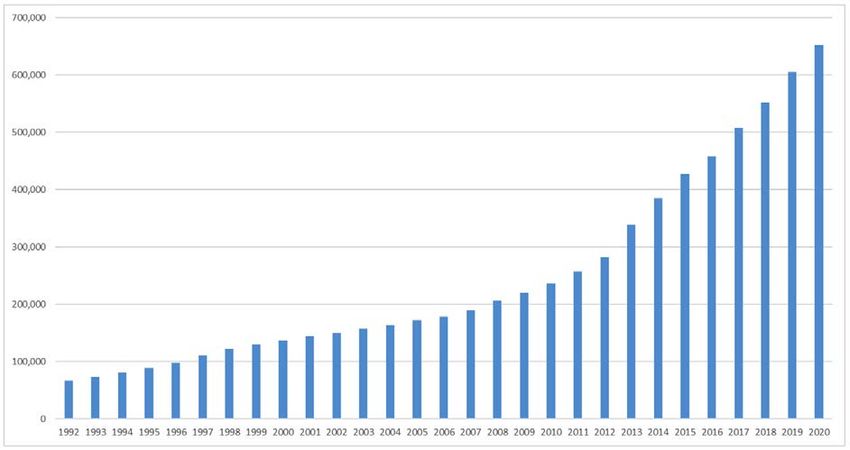
Table 3: Tank Container Production and World Fleet (1991 – 2020)

                   Year                      Production                   Fleet at 1 January (of year shown)
                   1991                         6,500
                   1992                         8,000                                    67,000
                   1993                         9,000                                    73,000
                   1994                         11,000                                   81,000
                   1995                         12,500                                   88,800
                   1996                         14,000                                   97,800
                   1997                         15,000                                  110,650
                   1998                         13,000                                  121,960
                   1999                         9,500                                   129,640
                   2000                         10,500                                  136,440
                   2001                         9,500                                   144,140
                   2002                         9,000                                   149,240
                   2003                         11,000                                  157,400
                   2004                         13,000                                  164,000
                   2005                         14,500                                  172,000
                   2006                         16,000                                  178,400
                   2007                         14,000                                  190,000
                   2008                         15,000                                  206,000
                   2009                         20,000                                  220,000
                   2010                         25,000                                  236,000
                   2011                         28,000                                  257,000
                   2012                         39,700                                  282,000
                   2013                         42,620                                  338,260
                   2014                         48,200                                  385,200
                   2015                         43,780                                  427,500
                   2016                         44,500                                  458,200
                   2017                         48,500                                  508,000
                   2018                         59,700                                  552,500
                   2019                         54,650                                  604,700
                   2020                         35,800                                  652,350
                   2021                                                                 686,650

        Data Source: Containerisation International 2008 Census and, for more recent years, other sources including
        tank container manufacturers, operators and leasing companies.

 Table 3 shows:

1.   The estimated annual tank production since 1991.            2.   The estimated global tank container fleet since 1992
     The ability to increase economic production of new          3.   A figure of 1,500 tanks being disposed in 2019 from the
     manufactured tanks has been one of the drivers of the            world fleet
     tank container industry growth.

8
Figure 5: Tank Container Production (1990 to 2020) Figure 6: Total Fleet size (at 1st January of each year) 9
Global Tank Container Fleet:
Tank Operators Fleet at January 2021

Tank Operators are third party logistics companies that provide a door-to-door service to shippers and others that require transport
of bulk liquids, powders or gases. The fleet listing for each company includes all tanks operated by that company, regardless of whether
the tanks are owned outright, managed, leased or any other financial structure used to acquire the asset.

Table 4: Tank operators’ fleets (at 1 January 2021)

                                 Head-                                                                   Head-
 OPERATOR                                                 Fleet          OPERATOR                                                 Fleet
                                 quarter                                                                 quarter

 Agmark Logistics                USA                      1,600          Intermodal Tank Transport       USA                    17,000
 ATI Freight                     UAE                      2,000          Katoen Natie Tank               Belgium                  1,700
 Alfred Talke                    Germany                  1,200          Legend Tank                     Singapore                4,500
 Baltica Trans Logistics         Russia                   1,500          Lexzau, Scharbau                Germany                  5,010
 Bertschi Group                  Switzerland            26,400           M&S Logistics                   UK                       8,443
 Bolt                            Singapore                1,500          Marenzana Multi Modal Spa       Italy                    1,500
 Braid Logistics/Hillebrand      UK                       3,300          Meurer Intermodal (Lanfer)      Germany                  1,200
 Bulkhaul                        UK                     24,000           Milky Way                       China                    2,500
 Bulk Tainer Logistics           UK                       5,350          Muto Co Ltd                     Seoul                    2,400
 Celerity Tank                   China                    2,500          Newport                         Netherlands            37,500
 Chemion Logistik                Germany                  1,000          Nichicon Tank                   Japan                    9,000
 Chemical Express                Italy                    1,500          Niyac Corp                      Japan                    2,500
 China Railway Logistics         China                  23,200           Odyssey Logistics Food Trans    USA                      1,100
 Crossover                       Singapore                4,000          Paltank                         UK                       2,200
 Contank                         Spain                    1,200          Protank Liquid Logistics        Taiwan                   1,200
 Curt Richter                    Germany                  1,633          Radix                           South Korea              1,000
 Daelim Corporation              Korea                    2,804          Rinnen                          Germany                  3,500
 Dana Liquid Bulk                USA                      7,500          R.M.I Global Logistics          Netherlands              4,600
 Deccan Transcon                 Indian                   1,600          Sinochem domestic               China                    1,000
 Den Hartogh Logistics           Netherlands            20,000           Sinotrans                       China                    1,360
 DJD                             China                    2,000          Spectransgarant (Railgarant)    Russia                   5,274
 Eagletainer Logistics           Singapore              10,500           Stolt Tank Containers           UK                     40,330
 Eway                            Malaysia                 9,000          Suttons International           UK                       9,500
 Flexitank Inc                   USA                      2,500          Ueno Container Logistics        Singapore                1,000
 GCA Trans                       France                   4,000          Van den Bosch Transport         Netherlands              4,250
 Goodrich Maritime               India                    5,000          VTG Tanktainer                  Germany                  9,494
 Gruber                          Germany                  1,139
 Haesaerts Intermodal            Belgium                  1,000
 Hengcheng                       China                    5,000          Other Under 1000
 Hoyer Group                     Germany                35,500           Estimated not accounted*        Asia Pacific           14,000
 Infotech-Baltika M              Russia                   5,400          Estimated not accounted*        Europe, RU               9,000
 Interflow (TCS)                 UK                     12,200           Estimated not accounted*        Americas               11,000
                                                                         Estimated not accounted*        IN/Mid-East/AF           9,500
                                                                         TOTAL                                                 443,110

Note: *There are a number of regional lessors that are not readily contactable. Accordingly an estimate has been included.

10
Global Tank Container Fleet:
Leasing Companies Fleet at January 2021
Tank Leasing companies provide tank containers to operators, shippers and others, usually on a contractual term basis, where the
lessee takes quiet possession and operates that tank as if it were owned. Leasing company fleet listings include all tanks within the
leasing company fleet including owned outright, managed on behalf of investor owners and any other financial means of acquisition.
Table 5: Leasing companies’ fleets (at 1 January 2021)
Head- Head-
LESSOR Fleet LESSOR Fleet
quarter quarter
Albatross Tank Leasing China 7,500 Peacock Container Netherlands 7,500
Combipass France 1,500 Raffles Lease Singapore 16,000
CS Leasing USA 18,030 Seaco Global Singapore 43,000
Eurotainer France 49,500 Tankspan Leasing UK 3,119
EXSIF Worldwide USA 66,476 Trifleet Leasing Netherlands 19,031
GEM Containers UK 11,500 Triton International USA 13,000
GRP Multilogistics Switzerland 1,600 Tristar Engineering Switzerland 1,100
International Equipment USA 7,100 TWS Tankcontainer Germany 6,345
Matlack Leasing USA 2,500 Unitas Container Leasing Bermuda 1,600
MCM Management Switzerland 2,000
Modalis France 2,800
Multistar Leasing South Africa 5,200 Estimated total for others 21,000
under 1000*
Noble Container Leasing Hong Kong 1,300 TOTAL 316,710
NRS Group Japan 7,000
Note: *There are a number of regional lessors that are not readily contactable. Accordingly, an estimate has been included.
11Global Tank Container Fleet:
Manufactured January to December 2020
Leading manufacturers that specialise in international tank container production have been listed. There are other manufacturers
worldwide that build tanks for mostly domestic and regional markets, in addition to their core business - typically that of road tank
vehicles and process vessels. A nominal estimate has been added to recognise the production completed by regional manufacturers.
Table 6: Tank Containers Manufactured (January to December 2020)
Head- Head-
MANUFACTURER Fleet MANUFACTURER Fleet
quarter quarter
CIMC Group China 18,000 Singamas China 1,300
CXIC Group China 500 Van Hool Belgium 500
Dalian CRRC Container China 2,800 Welfit Oddy South Africa 2,200
JJAP China 3,000
Nantong Tank Containers China 6,000 Other manufacturers* Global 1,500
TOTAL 35,800
Note: *Nominal estimate on production completed by regional manufacturers.
12Methodology
The global tank container fleet comprises a range of tank types Whereas there is a trend to outsource tank logistics to tank
including tanks for liquids, liquefied gases, powders, swap tanks operators, there remains a fleet of tanks directly controlled by
and specials. Tanks below 20ft length such as those typical of the shippers and others.
offshore oil industry are not included in this Survey.
Shipper (also referred to as producers or consignors) fleet and
The tank container is highly regulated and is required to meet others are challenging to assess because of the vast number of
stringent standards of operation, including statutory periodic shippers and others worldwide.
inspection and renewal of test certification. However, there is
no global register of tank containers. Data must be collected by It is especially difficult to compile a list of shipper-owned tank
systematically requesting tank owners and operators to provide containers, because tank ownership is a relatively small part of
company fleet numbers and manufacturers to report new their core business and - as a result - fleet figures are not freely
production. Where firm data is not provided, this Survey provides available. This also applies to other tank users - such as shipping
estimates based on internet research and consultation with lines, military authorities, railways, oil companies, mining industry
experienced industry representatives. and China domestic. Estimates of the total “others” are included
in the Survey.
Reported figures are recorded as received or, in the case of the
charts within the report, the result of the percentage calculation As a result of the trend to outsource tank logistics it is estimated
of data. It is not intended to suggest that calculated figures are that the shipper and others owned fleet is static. Operators might
accurate to an exact number. Readers should round up, or down, provide logistics services for shipper-owned tanks, but the tanks
as required. are not included as operator tanks for the purpose of this survey.
It is estimated that on average about 35% of the total leasing
Leased fleet listings are not included in the total industry fleet company fleet is leased directly to shippers and others.
figures, except for the relatively few estimated stocks that are
idle. The balance of “on lease” tanks is typically estimated to be In the 2013 Survey it was estimated that shippers and others
leased to operators (65%) and shippers and other tank users might own, on average, about the same number of tanks that
(35%). are leased into their fleet. This number remains unchanged in
the 2021 Survey and in preceding years. Users of the Survey can
This percentage might vary by leasing company according to their make adjustments to suit their needs.
market strengths and objectives, but is an estimated average.
The trend is for a greater proportion leased to operators but for More details on the methodology are given as explanations
consistency with previous surveys the percentage breakdown accompanying tables and figures.
remains unchanged.
13ITCO Vision: The Next Decade
This Edition of ITCO’s “Annual Global Tank Container The ITCO Tank Container Villages at Transport Logistic
Fleet Survey” is the 9th Report that the Organisation has China in Shanghai in 2020 and Transport Logistic 2021
published. in Munich this year have had to be cancelled. And the
ITCO/@TCO Depot Audit Programme has had to be
As in previous years, the main aim of the Survey is to suspended, for safety reasons.
meet the data and information requirements of a wide
range of stakeholders – operators, leasing companies, However, the Organisation has worked hard to maintain
service providers, manufacturers and investors. connections with its Members:
Over the past five months, we have organised a number
The figures in this Survey confirm that the Tank of Webinars, covering Environmental, Safety, Technical
Container industry is continuing to expand, with shippers and Regulatory issues.
appreciating the “Just in Time” concept allowing them Future Webinars covering Tank Container Efficiency and
to increase or decrease their product being shipped Sustainability will be organised
to meet the ever changing pattern of their customers ITCO has also organised Divisional Meetings for our
requirement and greatly reducing the need and costs for Members, to permit Companies to contribute their ideas
large amounts of static storage at either end of the liquid for how the Organisation can provide a service to them
supply chain. New Safety and Technical Documents have also been
published, to provide clear Guidelines to Members about
At the same time, they recognise the safety, efficiency industry best practice.
and operational benefits of this type of equipment. ITCO’s
Fleet Survey is part of the work that the Organisation Shanghai Maritime University
undertakes, to promote the tank container and to support
its Members. ITCO is aware that one of the most important issues
facing the tank container industry is how to ensure
Keeping Connected with the Industry the successful development and education of a new
generation of personnel (management and staff) entering
As with all industry associations, during the past 12 this sector of the shipping industry.
months, ITCO has been unable to organise its normal
schedule of Members Meetings, Conferences, Divisional All ITCO Members face the challenge of recruiting
Sessions, Work Groups. staff who can participate in the development of their
14businesses, introduce new ideas and technology, and offices over the past year, the E-learning course has
ensure the long-term future of their companies. proved particularly valuable for Companies to give their
staff who are working at home some relevant training in
It is an important aspect of ITCO’s role as an organisation key aspects of the business.
representing the interests of its members to create an
environment which can attract a new generation of The tank container industry has a huge responsibility
professionals. Within this, ITCO has a responsibility to within the bulk liquid logistics supply chain. ITCO
support its members with the tools to provide training endeavours to ensure that its members have the correct
and education. tools to recruit a new generation of professionals who can
be engaged in the process.
In last year’s Survey, we reported on the donation of a
Tank Container to Shanghai Maritime University - China’s Environmental Awareness
leading academic institution for the shipping, ports and
logistics industry – to be used for hands-on training The new generation of professionals also want to see that
of students to better understand the technical and the tank container industry is taking a serious approach
operational aspects of a tank. to the environment and sustainability. They need to see
that the industry operates, repairs, maintains and cleans
Due to the COVID-19 pandemic, the training programme its equipment in the correct way.
was put on-hold – until it was safe to start the process
again. ITCO has maintained close links with the SMU Over the past year, ITCO has undertaken an active
over the past 12 months, and it is intended to start the campaign to promote the environmental benefits of tank
programme again during the course of the year. containers.
The tank will be used by the University for training and A video was prepared (English and Mandarin Versions)
education purposes as part of a programme which includes explaining the problems of single-use plastics and
six 1-day training days together with access by students to encouraging the use of ISO tanks as a more sustainable
ITCO’s on-line Tank Container E-learning Course. mode of transport.
E-learning Course And many Members made use of the ITCO banner, on
websites, emails and brochures (below).
Many companies, both ITCO Members and others who
are involved in tank container operations, have taken ITCO takes the issue of plastic waste very seriously and
advantage of the ITCO E-learning course. is endeavouring to play its part in the reduction of single
use plastic.
With staff at many companies unable to go into their
15You can also read