Small Cap: Old Questions, New Answers January 2019 - Implementation Insight
←
→
Page content transcription
If your browser does not render page correctly, please read the page content below

Implementation Insight

Small Cap:
Old Questions, New Answers
January 2019
Contents

                                            03          Why read on?
                                            04          From risk premium to risk diversification:
                                                        the changing case for small cap
                                            09          Implementation choices and challenges
                                            10          Global small cap managers: a closer look
                                            14          Key takeaways

        bfinance is an award-winning specialist consultant that provides investment implementation advice to pension
        funds and other institutional investors around the globe. Founded in 1999, the London-headquartered firm has
        conducted engagements for more than 300 clients in 33 countries and now has eight offices in seven countries.
        Services include manager search and selection, fee analysis, performance monitoring, risk analytics and other
        portfolio solutions. With customised processes tailored to each individual client, the firm seeks to empower
        investors with the resources and information to take key decisions. The team is drawn from portfolio management,
        research, consultancy and academia, combining deep sector-specific expertise with global perspective.

        This commentary is for institutional investors classified as Professional Clients as per FCA handbook rules COBS
        3.5R. It does not constitute investment research, a financial promotion or a recommendation of any instrument,
        strategy or provider.

        Contact details
        Justin Preston – Senior Director, Public Markets, jpreston@bfinance.com
        Robert Doyle – Director, Public Markets, rdoyle@bfinance.com

2 | 2019 DNA of a Manager Search: Equity Overlay January 2019
Why read on?
Among pension funds and other                             Within the small cap landscape, one group
                                                          of strategies has gained ground significantly:
asset owners, the appetite for small                      “global small cap” strategies. To some extent,
cap appears to be on the rise.                            these can be viewed as a natural complement to
                                                          the aforementioned global equity mandates that
The past year has seen notably greater interest in        are increasingly employed by asset allocators.
small cap equity strategies – either regional or global   This paper presents data from recent and ongoing
– from institutional investors that work with bfinance.   global small cap manager searches conducted
                                                          by bfinance to provide insight into this particular
The underlying motivations for seeking small              subset of the universe.
cap are evolving. While the academic and
investment communities have become somewhat               Investors should carefully consider whether global
sceptical about the so-called “size premium,”             or regional approaches to small cap represent the
allocators are instead looking towards small cap          optimal approach for their portfolios. In doing so, it
to complement and diversify their existing                is important to remember that the best path may be
exposures, seeking stronger risk-adjusted returns         determined not purely by theory or examination of the
over the long-term.                                       indices but by the appropriateness and attractiveness
                                                          of solutions available in the market today.
Looking globally, pension funds and other asset
owners are structurally under-allocated to small cap
equities. This lack of exposure has been reinforced
by two key trends of the past decade: the move
from regional towards global equity strategies and
the shift towards passive investment. Based on
our search activity, active global equity managers
have median small cap exposure of less than 5%
(defined as market cap
From risk premium to risk diversification:
the changing case for small cap
Few risk premia have as illustrious – exist, theories were propounded for why it should
exist. These included the pricing inefficiencies which
and controversial – a history as size. can result from limited analyst coverage, lower
liquidity and the supposedly easier growth trajectory.
One of the three factors used in the Fama/French
Three Factor Model alongside ‘value’ and ‘market,’
At first glance, before adjusting for risk or for
it has been the subject of more academic papers
the various style premia, small cap indices have
than any other member of the factor family. Many of
outperformed large/mid cap indices since 2000 on
these were produced in the 1980s, beginning with
both a global and a regional basis (see charts below).
Rolf Banz’s seminal article in 1981. In the face of data
which appeared to suggest that a size premium did
FIGURE 1: SMALL CAP INDEX VERSUS LARGE/MID CAP INDEX PERFORMANCE
3 7
6
2.5
5
2
4
1.5
3
1
2
0.5 1
0 0
1999
2000
2001
2002
2003
2004
2005
2006
2007
2008
2009
2010
2011
2012
2013
2014
2015
2016
2017
2018
1999
2000
2001
2002
2003
2004
2005
2006
2007
2008
2009
2010
2011
2012
2013
2014
2015
2016
2017
2018
MSCI Japan MSCI Japan Small Cap MSCI Europe MSCI Europe Small Cap
6 8
7
5
6
4
5
3 4
3
2
2
1
1
0 0
1999
2000
2001
2002
2003
2004
2005
2006
2007
2008
2009
2010
2011
2012
2013
2014
2015
2016
2017
2018
1999
2000
2001
2002
2003
2004
2005
2006
2007
2008
2009
2010
2011
2012
2013
2014
2015
2016
2017
2018
MSCI World MSCI World Small Cap MSCI US MSCI US Small Cap
Source: Bloomberg. All figures are Total Return in US$ to 31 December 2018.
4 | 2019 Small Cap: Old Questions, New Answers January 2019
The evidence for a passive “size                                     Alongside these debates about
premium” has now been extensively                                    indices, it is important – perhaps
unpicked.                                                            more important – to keep an eye
                                                                     on the performance of small cap
More recently, robust academic and industry
studies have concluded that the size effect is
                                                                     managers.
statistically insignificant once the data has been
                                                                     Among active managers we can find considerably
adjusted for beta, and even more so when other
                                                                     more compelling results. That being said,
now-popular analytical methods are applied such
                                                                     performance relative to the relevant small cap
as style regressions. What remains is undermined
                                                                     indices varies considerably by region. In Australia,
by the greater illiquidity and higher trading costs
                                                                     for example, 100% of active small cap managers
involved. In addition, unlike other premia such as
                                                                     in the eVestment database have outperformed the
value and momentum, no evidence has been found
                                                                     MSCI Australia Small Cap index over ten years
for the size effect in other asset classes such as
                                                                     and the median performer generated average
corporate bonds.
                                                                     outperformance of 7.4% per year.

That being said, certain papers (such as Size
                                                                     Yet investors should seek a clear understanding
Matters... Asness 2018) have argued that a
                                                                     of the sources of such outperformance. In the case
statistically significant size premium resurfaces once
                                                                     of Australia, impressive figures have often been
indices are regressed against the quality factor. Our
                                                                     facilitated by macro-led or cyclical bets, such as the
independent research does appear to support this
                                                                     degree of exposure to commodity-related sectors
argument. We find that the size factor loads very
                                                                     through periods of stronger and weaker prices.
significantly and negatively on the quality factor,
                                                                     Looking at various international markets, we find that
and that the addition of the quality factor not only
                                                                     a significant number of active small cap managers
raises the average return to size significantly but also
                                                                     have boosted relative returns by adding exposure to
increases the precision of the size premium (QMJ
                                                                     mid-cap stocks – an approach that some investors
explains a substantial fraction of the variation in
                                                                     are more comfortable with than others.
SMB’s returns).

FIGURE 2: PERFORMANCE OF AUSTRALIAN SMALL CAP EQUITY MANAGERS RELATIVE TO THE MSCI
AUSTRALIA SMALL CAP INDEX

                                                                     5 Years             7 Years              10 Years

 5th Percentile                                                        14.3                13.0                 14.5

 25th Percentile                                                        6.0                7.8                  8.7

 Median                                                                 4.1                6.3                  7.4

 75th Percentile                                                        1.7                3.6                  5.5

 95th Percentile                                                       -2.5                0.2                  2.6

                                                                     5 Years             7 Years              10 Years

 # of Managers with Track Record of Sufficient Length                   42                  39                  31

 # of Managers Outperforming                                            35                  37                  31

 % of Managers Outperforming                                           83%                 95%                 100%

Source: bfinance, eVestment. All figures in AU$, annualised, to 30 September 2018.

5 | © January 2019 bfinance. All Rights Reserved.
From risk premium to risk diversification:
          the changing case for small cap continued
          Pension funds and endowments                                         For investors using passive global broad market
                                                                               indices, small cap exposure will be largely absent
          today tend to be structurally under-                                 unless the institution has specifically decided to
          invested in small cap equities.                                      implement an investment in a small cap strategy or
                                                                               index. Where investors do have additional small cap
          Under-investment in small caps has been reinforced,                  exposure, it is frequently confined to the domestic
          and to some extent exacerbated, by two of the most                   market, particularly for institutions in the US and
          notable equity investment trends of the past decade:                 Australia.
          the shift from regional towards global mandates and
          the shift towards passive management.                                During the recent extended bull run, strong equity
                                                                               market returns have been somewhat reliant on a
          Within actively managed global equity funds, we tend                 relatively modest number of large cap stocks. With
          to find small cap stocks either absent or representing               this in mind, investors have sought to broaden the
          a minimal slice of portfolios. In one of our most                    drivers of return within equity portfolios through
          recent Global Equity manager searches, the median                    geographical and strategic diversification. This priority
          exposure to small cap stocks (
For today’s investors, adding One source of performance differentiation between
large/mid cap and small cap indices is the significant
small cap is not necessarily about difference in sector exposures. While small cap
capturing a “size premium” but investors can benefit from the opportunity to
delivering a robust, well-diversified access different types of business with different
return drivers, we should be cognisant of the extent
portfolio.
to which outperformance or underperformance
may represent a sector bet in disguise. As shown
When considering the diversifying characteristics
in the chart below, the MSCI World Small Cap
that small cap investment may offer relative to large/
Index currently contains a stronger weighting
mid cap stocks, it is important to pay attention to the
towards Industrials, Real Estate and Materials
differences between the various international small
than the MSCI World Index, with somewhat less
cap markets. Small caps in Japan, for example, are
in Consumer Staples and Communication
relatively insulated from the “tourism effect” exhibited
Services.
by large/mid caps in this market, wherein foreign
investors flow strongly in and out at certain periods
(such as when executing currency plays), due to the
far lower involvement of international investors in the
small cap segment.
FIGURE 4: DIFFERENCES IN SECTOR WEIGHTING FOR MSCI WORLD SMALL CAP VS. MSCI WORLD
10
% allocation within MSCI Small Cap vs MSCI World
8
6
4
2
0
-2
-4
-6
Communication Services
Consumer Discretionary
Consumer Staples
Energy
Financials
Health Care
Industrials
Information Technology
Materials
Real Estate
Utilities
GICS Sector
Source: Bloomberg, bfinance at December 2018
7 | © January 2019 bfinance. All Rights Reserved.From risk premium to risk diversification:
the changing case for small cap continued
The subject of sector exposure Financials, meanwhile, make up 13.2% of the MSCI
USA Index and 16.8% of the MSCI USA Small Cap
further highlights the geographical index, whereas financials in Australia are strongly
differences in small cap markets skewed towards the mid and large cap end of the
relative to large/mid-caps. spectrum: the MSCI Australia index has a 38.4%
weighting to this sector, while the small cap index
In Australia, the Consumer Discretionary segment has a weighting of less than 9%.
represents 11.1% of the MSCI Australia Small Cap
Index but only 5.6% of the MSCI Australia Index; Of course, as discussed previously with respect to
in Japan, conversely, the Consumer Discretionary performance, the picture among active managers is
weighting is higher in the MSCI Japan (19.1%) Index very different.
than in the MSCI Japan Small Cap Index (15.5%).
FIGURE 5: DIFFERENCES IN SECTOR WEIGHTING FOR REGIONAL SMALL CAP VERSUS LARGE/MID CAP INDICES
15
% Allocation within Small Cap Index vs All Cap
10
5
0
-5
-10
-15
-20
-25
-30
-35
Communication Services
Consumer Discretionary
Consumer Staples
Energy
Financials
Health Care
Industrials
Information Technology
Materials
Real Estate
Utilities
GICS Sector
US Japan Europe Australia
Source: bfinance, Bloomberg at December 2018. Indices for US, Japan and Europe same as in Figure 1;
indices for Australia are MSCI Australia Index and MSCI Australia Small Cap Index
8 | 2019 Small Cap: Old Questions, New Answers January 2019Implementation choices and challenges
Investors complementing systematic and so forth. However, certain aspects
of implementation can be more challenging on the
equity portfolios with small cap small cap side, and those issues (as with so many of
exposure face a set of portfolio the previous points) vary significantly by geography.
design choices.
As is so often the case, it is helpful to understand
To some extent, these options mirror those available pragmatic considerations for implementation before
in large/mid cap equity investing: global versus formulating strategic decisions.
regional, active versus passive, discretionary vs
PASSIVE MANAGEMENT
Passive management in small cap can be problematic: greater illiquidity, higher trading costs and the sheer
volume of stocks being traded (approximately 4200 in MSCI Small Cap versus 1650 in MSCI Global) create
greater friction and leakage.
FEES
Fees are on the high side relative to global equity strategies. Based on our search activity, the median
Australian small cap equity manager charges around 60bps on a $100 million mandate; whereas the
median US small cap equity manager is more expensive, around the 75-80bps mark. In comparison,
fees for active global large/mid cap equity managers tend to come in around or under 50bps.
QUANTITATIVE APPROACHES
Quantitative approaches can be obstructed by the lower volume of analyst coverage per stock, although
this data restriction is significantly more evident in some small cap markets than others. The majority of
small cap managers are fundamental bottom-up stock pickers.
LANGUAGE BARRIERS
Language barriers can obstruct non-local managers in regions like Japan, where larger firms will produce
English translations of corporate documentation but small firms often won’t.
MANAGER CAPACITY
Manager capacity can be very restrictive in certain countries. In Australia, for example, a significant
proportion of small cap equity funds tend to be closed to new investors at any one point in time. These
capacity constraints vary significantly by region, and are reflected in average fund sizes: the median AuM
of Australian small cap managers participating in recent bfinance searches is AU$160 million versus US$1
billion in US small cap and close to US$1 billion in Japanese small cap.
PERFORMANCE DISPERSION
Performance dispersion tends to be higher among small cap managers than their large/mid cap-focused
peers. In part, this is due to the larger number of stocks from which to choose, which helps to produce
more substantial portfolio variation between different managers.
9 | © January 2019 bfinance. All Rights Reserved.Global small cap managers: a closer look
During recent years, global small Focus on: firm size
Although many global small cap strategies are run
cap strategies have become more by large global asset managers, there are plenty of
popular and widely available. smaller firms and boutiques in play. Nearly half of the
relevant managers recently assessed by bfinance for
For investors that wish to invest in small cap globally, clients in this strategy sit between the US$100 billion
there are two main options: combining a number and US$1 trillion mark in terms of overall firm AUM,
of regional strategies or investing in a “global small while just under a quarter have a total AuM below
cap” strategy. While both of these approaches have US$10 billion.
received attention from bfinance clients of late, active
global small cap funds have undergone a particularly Focus on: inter-product alignment
significant expansion, with a rapid rise in the number In many cases, the managers offering global small
of products of this type. We estimate that there are cap strategies are also offering one or more local
now more than 70 such strategies available, three small cap strategies covering at least one of the
times higher than the figure ten years ago. This underlying markets. This can create challenges in
trend has produced an increasingly credible universe terms of alignment, especially where that market
of options for institutional investors to consider, may be capacity constrained. The investor should
although managers’ track records are on average consider how decisions are being made for the
somewhat shorter than those in well-established global fund and the extent to which these represent
regional small cap markets. an extension of local small cap strategy team picks
or sit independently.
FIGURE 6: GLOBAL SMALL CAP MANAGERS, FIRM SIZE (US$)
35%
30%
25%
20%
15%
10%
5%
0%
1trn
Firm size
Source: bfinance manager selection research, January 2019
10 | 2019 Small Cap: Old Questions, New Answers January 2019FIGURE 7: GLOBAL SMALL CAP MANAGERS, AUM IN GLOBAL SMALL CAP STRATEGY (US$)
35%
30%
25%
20%
15%
10%
5%
0%
4bn
Strategy AUM
Source: bfinance manager selection research, January 2019
Focus on: investment approach Looking at the group through a different lens, we find
Global small cap products can be segmented by that the vast majority (>90%) employ a bottom-up
strategy and process, as shown in Figure 8 on portfolio construction approach, while just a handful
the following page. These include fully systematic can be described as having a top-down philosophy
products (approximately 15% of global small cap or a combination of both bottom-up and top-down
managers assessed by bfinance), fundamental/ construction.
discretionary strategies (approximately two thirds
of the group) and those using a combination of both We also see a minority of global small cap strategies
(the remaining ~15% of managers). employing either growth or value styles, with a
leaning towards growth, although the majority do not
Discretionary and systematic strategies bring their
employ a style-based approach.
own distinct advantages and disadvantages. Data
limitations do not only impede quantitative models,
but also challenge global managers implementing
small cap strategies that cover regions where they
have weaker expertise.
11 | © January 2019 bfinance. All Rights Reserved.Global small cap managers: a closer look continued
FIGURE 8: GLOBAL SMALL CAP MANAGERS SEGMENTED BY STRATEGIC APPROACH
Combined
15%
Top-down/
Combined
6%
Systematic DISCRETIONARY
15%
VS.
SYSTEMATIC
Discretionary Bottom-up
70% 94%
Value
14%
Combined
15%
Top-down/
Combined Top-down/
6% Combined
Growth 6%
BOTTOM-UP
24%
Systematic
15%
VS.
Core
62% TOP-DOWN
Bottom-up
Discretionary
94% Bottom-up
70% 94%
Value
14%
Growth
24% Growth STYLE
24%
FOCUS
Core
62%
Source: bfinance manager selection research, January 2019
12 | 2019 Small Cap: Old Questions, New Answers January 2019Focus on: ESG
The ESG-minded investor should be aware that only “Only 41% of
global small cap
41% of global small cap managers integrate ESG
criteria into investment decision-making. A similar
number say that they do not, and a further 18%
do not state either way in response to information
requests in RFPs.
managers integrate
To some extent, this relates to the origins of these ESG criteria”
global small cap strategies: many have their roots in
the US small cap space, where the ESG theme has
only recently begun to gain traction.
FIGURE 9: DO YOU INTEGRATE ESG INTO YOUR INVESTMENT PROCESS?
50%
45%
40%
35%
30%
25%
20%
15%
10%
5%
0%
Yes No Not disclosed
Source: bfinance manager selection research, January 2019
13 | © January 2019 bfinance. All Rights Reserved.Key takeaways
For today’s investors, adding small cap is not necessarily about capturing a “size premium”
but delivering a robust, well diversified portfolio. Pension funds tend to be structurally under-
invested in small caps, particularly from a global standpoint.
When forming strategic decisions regarding small cap equity exposure, investors should
pay attention to active manager performance and exposures. While analysis of indices (small
cap versus large/mid cap) can help investors to form a view on the sector, the small cap manager
universe offers a very different picture in terms of returns, volatility and exposures to various sectors
and styles. These differences vary considerably by region.
Global small cap strategies have undergone significant expansion, with the number of
active funds available to institutional investors trebling in the past decade to more than 70.
This may offer an interesting alternative to more conventional regional strategies.
Justin Preston
Senior Director, Head of Equity, Public Markets
Justin joined bfinance in 2014 from Buck Consultants where he was
UK Head of Manager Research and Selection. He brings with him
nearly two decades of equity manager research experience having
previously worked at the Abu Dhabi Investment Authority, one of the
world’s largest sovereign wealth funds. At ADIA he helped establish the
External Emerging Market Equities capability whilst running a number of
multi-manager portfolios. Prior to joining ADIA Justin spent five years at
Skandia Investment Group. Justin has an MSc in Investment Analysis
from the University of Stirling and a BSc in Economics with Actuarial
Studies from the University of Southampton.
Robert Doyle
Director, Public Markets
Robert is a Director within the Public Markets team, specialising in
equity manager research. Robert joined bfinance in October 2015,
having spent five years as a fund research analyst at private wealth
management firm Saunderson House. Robert graduated from Cass
Business School with a Masters in Investment Management and
also holds a first class honours degree in Accounting & Finance
from the University of Warwick. Robert has previous experience
within the Private Client Services team of Ernst & Young LLP. Robert
is a Chartered member of the Chartered Institute for Securities &
Investment (CISI).
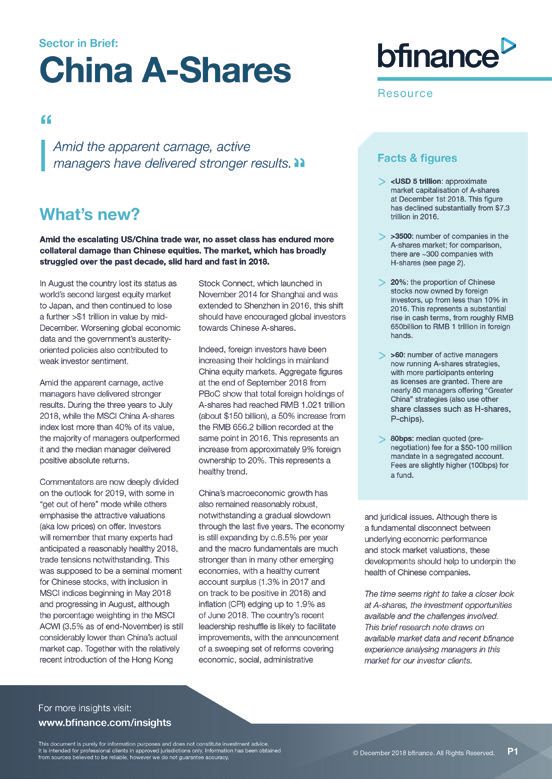
14 | 2019 Small Cap: Old Questions, New Answers January 2019Recent publications available at www.bfinance.com Sector in Brief: Manager Intelligence Asset Owner Survey: China A-Shares and Market Trends Innovations in Implementation (December 2018) (November 2018) (September 2018) IMPORTANT NOTICES PROPRIETARY AND CONFIDENTIAL This document contains confidential and proprietary information of bfinance and is intended for the exclusive use of the parties to whom it was provided by bfinance. Its content may not be modified, sold, or otherwise provided, in whole or in part, to any other person or entity without bfinance’s prior written permission. OPINIONS NOT GUARANTEES The findings, ratings, and/or opinions expressed herein are the intellectual property of bfinance and are subject to change without notice. They are not intended to convey any guarantees as to the future performance of the investment products, asset classes, or capital markets discussed. Past performance does not guarantee future results. The value of investments can go down as well as up. NOT INVESTMENT ADVICE This report does not contain investment advice relating to your particular circumstances. No investment decision should be made based on the information contained herein without first obtaining appropriate professional advise and considering your own circumstances. INFORMATION OBTAINED FROM THIRD PARTIES Information contained herein has been obtained from a range of third-party sources, unless otherwise stated. While the information is believed to be reliable, bfinance has not sought to verify it independently. As such, bfinance makes no representations or warranties as to the accuracy of the information presented and takes no responsibility or liability (including for indirect, consequential, or incidental damages) for any error, omission, or inaccuracy in the data supplied by any third party.
Office locations

Amsterdam                                                       Chicago                                 London
Symphony building-26th Floor                                    220 N. Green Street                     36 Queen Street
Gustav Mahlerplein 109-115                                      Chicago IL 60607                        London
1082 MS Amsterdam                                               USA                                     EC4R 1BN
The Netherlands                                                                                         England
                                                                T +1 (312) 829-4353
T +31(0)20 794 61 00                                            www.bfinance.com                        T +44 20 7747 8600
www.bfinance.nl                                                                                         www.bfinance.co.uk

Montréal                                                        Munich                                  Paris
1250 René Lévesque Blvd. W                                      Promenadeplatz, 8                       49, avenue d’léna
Suite 2200, Montréal QC                                         D-80333 München                         75116 Paris
Canada H3B 4W8                                                  Germany                                 France

T +1 514 393 4899                                               T +49 89 55 29 59 00                    T +33 1 45 02 64 00
www.bfinance.ca                                                 www.bfinance.de                         www.bfinance.fr

Sydney                                                          Toronto
Level 13                                                        88 Queens Quay West
135 King Street                                                 Suite 2500, Toronto
Sydney                                                          Ontario M5J 0B8
Australia                                                       Canada

T +61 2 8973 7503                                               T +1 (416) 560-7275
www.bfinance.com                                                www.bfinance.ca

This document is purely for information purposes and does not constitute investment advice.
It is intended for professional clients in approved jurisdictions only. Information has been obtained
from sources believed to be reliable, however we do not guarantee accuracy.

bfinance UK Limited is authorised and regulated by the Financial Conduct Authority.                        bfinance.com
You can also read