William Blair SICAV Class R (USD) - ISIN: LU1664180111
←
→
Page content transcription
If your browser does not render page correctly, please read the page content below
William Blair SICAV
                     Dynamic Diversified Allocation Fund

                               Class R (USD)

                                   Quarterly Review

                                      June 2021

                                                                    Brian D. Singer, CFA, Partner
                                                                         Thomas Clarke, Partner

ISIN: LU1664180111

                                  FOR PROFESSIONAL INVESTORS ONLY
Summary & Outlook                                                                                                                June 2021

    •   We further increased our equity exposure in the second           Strategy Positioning
        quarter and while our net positioning is the highest it
                                                                         The market segment remains long of equities with net exposure of
        has been for several years, we are not aggressively
                                                                         +43. The segment’s largest country exposures are in U.S. and U.K.
        bullish
                                                                         equities. Markets are modestly long of fixed income with a net
    •   This net increase in exposure included purchasing
                                                                         exposure of +33%, with primary long exposure in U.S. Treasuries and
        equity markets that had underperformed, such as the
                                                                         emerging debt.
        Philippines, but also reducing markets that have
        outperformed, such as Vietnam                                    Within currencies, the largest long exposures are the Singapore
    •   Similarly, our currency strategy took advantage of shifts        dollar, Japanese yen, Russian ruble, and Brazilian real, while the
        in relative opportunities such as increasing exposure to         largest short exposures are to the New Zealand dollar, euro, and U.S.
        the Brazilian real and Russian ruble, and decreasing             dollar.
        exposure to the Mexican peso and South African rand
    •   Currency strategy is short of U.S. dollar and is also            Strategy Review and Outlook
        significantly short of the euro, Swiss franc, and the
        Australian and New Zealand dollars                               Global equities appreciated in the second quarter, as they did in the
                                                                         first. Several markets in developed and emerging countries reached
Performance Summary                                                      new all-time highs (in local currency terms), including the United
                                                                         States, Germany, Brazil, and Russia. Bond yields, which had risen in
Dynamic Diversified Allocation completed the quarter with positive       the first three months, mostly stabilised. The larger declines in 10-
performance with market, currency and security selection all             year yields were in markets where they were the most positive
positive. Within markets, long exposures to U.S., U.K., Australia, and   (such as in North America and Australia). In many European
global energy sector equities contributed. Partially offsetting this     markets and Japan, yields have remained continuously negative this
were negative contributions from long exposures to Chile and             year. The U.S. dollar experienced strength late in the quarter as the
Indonesia equities.                                                      Federal Reserve communicated a slightly less accommodative
                                                                         interest rate path in the (quite distant) future. The currencies of
Within currencies, long exposures to Brazilian real, Russian ruble,
                                                                         other countries that have already begun increasing rates—Brazil
and Mexican peso helped performance, while long exposure to the
                                                                         and Russia—did better still.
Colombian peso, and short exposures to the Israeli shekel and Czech
koruna detracted.                                                        Concerns about higher inflation around the world remained in focus
                                                                         in the quarter, and there were numerous reports of consumer price
Positive security selection was mostly driven by outperformance of
                                                                         increases running at their fastest rates as had been observed for
the Emerging Markets Growth strategy, while All Cap Growth and
                                                                         several years. This was most pronounced in Brazil (8% inflation)
underperformed.
                                                                         and Russia (6%), but also in the U.S. (5%)—in each case
Summary & Outlook June 2021
significantly above respective central bank targets. Inflation late June, the Federal Reserve brought forward, slightly, its
increases in Europe were less rapid but exceeded the target rates of expectation of when it may eventually raise interest rates, which
the European Central Bank and the Bank of England. For the most was a communication of slightly less tolerance of inflation than that
part, central banks have indicated significant tolerance of price rises previously expressed, and this change appeared to reassure
and have consistently indicated their belief that a majority of markets that—after all—inflation was less likely to be let out of the
current inflation will be transient. This tolerance has been primarily bag. Nominal interest rates can be separated into an inflation
evident in wealthy countries’ policy interest rates not being raised component (which matters more for long-term rates) and a real
even subsequent to inflation increasing, resulting in short-term real risk-free component (more relevant for short-term rates). The
interest rates becoming significantly negative. Even those countries initial manifestation of the Reflation theme was a rise in the
that have increased rates have not yet matched the rise in their inflation portion; more recently, this has abated but has been
inflation rates, and they too have allowed real (short) rates to sink replaced in turn by a higher real risk-free rate component.
further below zero. Ultimately, if central banks are fully able to anchor inflation (a
development about which markets are not yet wholly assured), then
To a large extent, increases in inflation reflect the period of the theme should eventually abate. In the interim, Reflation has
economic recovery from the depths of the contraction induced by been predominantly positive for the performance of our strategies.
lockdowns worldwide last year during the first wave of the COVID
pandemic. As businesses have reopened, the combined effects of We increased equity exposure in the quarter, which presently
pent-up demand and supply bottlenecks have put upward pressure stands at its most positive across our multi-asset portfolios, as has
on prices. The economic rebound has also been fuelled by massive been the case for several years. Of note, we have not added
monetary and fiscal expansion in several economies, very little of exposure in markets that have outperformed and, consequently, are
which has yet been reined back in. And fiscal stimulus in some fundamentally unattractive. In fact, where equities have become
countries has been further increased, even as their economies have overvalued, or where the valuation opportunity has significantly
evolved well into an expansionary phase. Consequently, there have shrunk after price appreciation, we have reduced positions—these
been persistent investor worries in recent months that the sanguine include the IT and consumer discretionary sectors of U.S. equity,
view of most central banks may be misplaced, and that large parts of and also Vietnam, which has been one of the strongest emerging
the world economy may lose control of an inflationary surge. We markets in 2021 to date. Rather, we have increased equity exposure
have captured this influence via a Reflation macro theme— in the Philippines, which has lagged other markets and become
introduced in early 2021—affecting our return and risk more attractive in an absolute and relative sense, and we bought
expectations. It is, in general, a headwind for (already overvalued) long option exposure in eurozone equity, while also increasing long
government bonds, and also adverse for (typically growth sector) exposures in Sweden and Switzerland. Our strategy changes
equities that have more to lose from higher future discount rates. continued similar activity actions from the first quarter, when we
Since the influence of this theme will wax and wane over time, it can had increased long equity exposure in Malaysia and Brazil, which
also go into the reverse direction to that just described. In fact, in had both underperformed at the time and become more attractiveSummary & Outlook June 2021
opportunities. In fixed income markets, we reduced long exposure be ahead of the eurozone, and perhaps other developed countries,
to Australian and South African government bonds, where yields in the monetary policy cycle looking forward. Recent
were already high coming into the second quarter, reflecting the outperformance of the U.S. dollar relative to these other currencies
Reflation theme, but then declined through the second quarter. is beneficial given our significant short exposures in the latter ones,
and if the Reflation theme remains most concentrated in the U.S.,
Our currency strategy changes also took advantage of shifts in this may continue.
relative opportunities and contributed positively to performance in
the quarter. For some time, we have regarded the Brazilian real and Our long-term investment objective is to deliver positive investment
the Russian ruble as two of the most compelling long opportunities, returns above inflation through a market cycle. We remain
and we further boosted these positions in April. Although inflation grounded in fundamental valuation as our first stage—we strive to
is surging in both countries (as mentioned above), their respective take only compensated risk and are unwilling to extend exposures
central banks began lifting interest rates in March and, as such, are unduly in a reach-for-yield that would be dictated not by
leading most of the world in the monetary policy cycle. In addition, opportunities and risks, but by very low real interest rates. There
in both cases, prolonged currency undervaluation has led to will be environments in which we conclude that macro markets do
external balances of payments that are improved, or in surplus. not provide returns and risks compatible with portfolio objectives,
Higher commodity prices have also benefited their terms of trade. alongside other periods where compensation is abnormally high.
Although real interest rates are unusually negative in Brazil and During the last decade, the challenge of navigating these evolving
Russia because inflation has risen faster than nominal interest rates, environments has remained a significant component in the
investors appear to hold in high regard the ability of central banks investment landscape, but we find our investment process, dialogue,
to contain domestic inflation. and decision-making well-equipped to meet this challenge in an
appropriate way. We remain vigilant as we assess new and relevant
In contrast, we have reduced long exposure to the Mexican peso and information to capture future investment opportunities in a timely
South African rand, which are two currencies that have recovered manner and will continue balancing the relationship between risk
the most since the 2020 pandemic trough and are now less taken and compensation expected.
compellingly attractive. We have also increased exposure to the
Colombian peso, which is similarly attractive to the real and the
ruble, and we have taken increased exposure to some Asian
currencies, including the Malaysian ringgit and Indian rupee. Our
currency strategy remains short of the U.S. dollar and is also
significantly short of the euro and Swiss franc, and the Australian
and New Zealand dollars. The Fed’s (modest) increase in interest
rate hawkishness in June indicates that—even though higher U.S.
interest rates are still some distance into the future—the U.S. mayInvestment Performance June 2021
The below table shows the performance of the William Blair SICAV – Dynamic Diversified Allocation Fund for the quarter.
Since
Periods ended 30/06/2021 Quarter YTD 1 Year Inception*
William Blair SICAV – Dynamic Diversified
5.24% 4.29% 10.82% 7.46%
Allocation Fund (Class RUSD)
ICE BofAML 3M T-Bill 0.00% 0.02% 0.09% 1.22%
U.S. CPI Index + 5%** 7.72%
*Inception: 19/12/2018
**Long-Term Return Objective
The primary benchmark for this fund is the ICE BofAML 3-Month U.S. Treasury Bill Index, which is an unmanaged market index of U.S. Treasury securities
maturing in 90 days that assumes reinvestment of all income. The U.S. CPI Index + 5% is included as a supplemental reference and represents the
performance target of outperforming inflation by five percentage points. This is a long-term performance target and, therefore, is only included for the
period since inception. The Consumer Price Indexes (CPI) program produces monthly data on changes in the prices paid by urban consumers for a
representative basket of goods and services.
Periods greater than one year are annualised. All charges and fees have been included within the performance figures. For the most current month-end
performance information, please visit our Web site at sicav.williamblair.com.
Please refer to the ‘Important Disclosures’ section at the end of this document for further information on investment risks and returns.Performance Analysis June 2021
The below table shows the calculated regional performance attribution of DDA SICAV by asset segment for the reporting period.
Total (%) 5.2
Equity 2.6
North America 1.0
Europe 0.5
Asia 0.4
Emerging 0.6
Other 0.1
Fixed Income 0.9
North America Rates 0.3
Europe Rates 0.0
Asia Rates 0.0
Emerging 0.4
Credit 0.1
Low Duration 0.0
Currency 1.2
North America 0.0
Europe -0.1
Asia 0.1
Emerging 1.2
Security Selection 0.7
Residual -0.1
Source: Cloud Attribution Ltd.
Past performance does not guarantee future results. Portfolio exposures based on the William Blair DDA SICAV. Past performance does not guarantee future results. Performance attribution is
sourced from Cloud Attribution Ltd. Using the Karnosky-Singer performance attribution methodology.Performance Analysis June 2021 The below chart shows the calculated market segment performance attribution for DDA during the reporting period. Source: Cloud Attribution Ltd. Past performance does not guarantee future results. Portfolio exposures based on the William Blair DDA SICAV. Past performance does not guarantee future results. Performance attribution is sourced from Cloud Attribution Ltd. Using the Karnosky-Singer performance attribution methodology.
Performance Analysis                                                                                                                                                       June 2021

The below chart shows the calculated active currency segment performance attribution for DDA during the reporting period.

Source: Cloud Attribution Ltd.

Past performance does not guarantee future results. Portfolio exposures based on the William Blair DDA SICAV. Past performance does not guarantee future results. Performance attribution is
sourced from Cloud Attribution Ltd. Using the Karnosky-Singer performance attribution methodology.
Performance Analysis                                                                                                                                                       June 2021

The below chart shows the calculated security-selection-oriented performance attribution for DDA during the reporting period.

Source: Cloud Attribution Ltd.

Past performance does not guarantee future results. Portfolio exposures based on the William Blair DDA SICAV. Past performance does not guarantee future results. Performance attribution is
sourced from Cloud Attribution Ltd. Using the Karnosky-Singer performance attribution methodology.
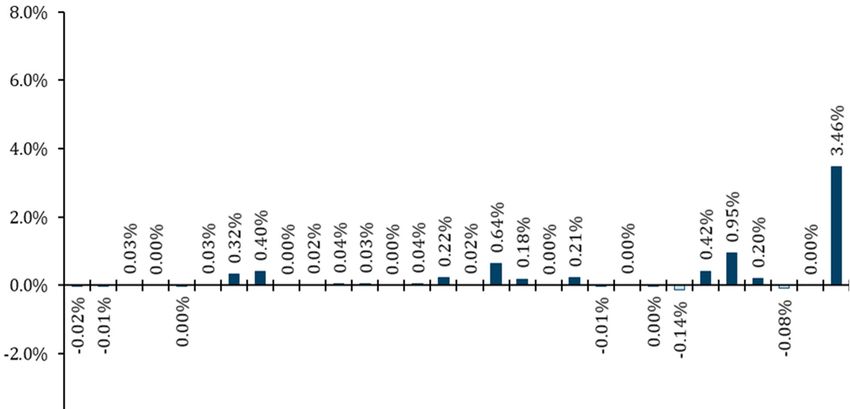
Forward-Looking Risk                                                                                                                                     June 2021

The below chart shows the expected sources of investment risk* for DDA as of quarter-end.

Source: William Blair.
*The DAS team’s expectation of the portfolio’s volatility as viewed through the team’s proprietary Outlook risk model, in which the team’s near-term risk assumptions
are quantified.
Selected Strategy Exposures                                                                                                                                                     June 2021

The table below shows select market and currency strategy exposures as of quarter end.

                    Equity                                                   43.4%             Active Currency
                    U.S.                                                      9.4%             U.S. Dollar (USD)                                                       -10.6%
                    Canada                                                    0.6%             Canada Dollar (CAD)                                                      -6.2%
                    Europe (ex-U.K.)                                          6.7%             Other Americas                                                          20.5%
                    UK                                                        8.1%             Euro (EUR)                                                               -8.0%
                    Asia Developed                                            5.8%             Switzerland Franc (CHF)                                                  -4.8%
                    Emerging                                                 12.9%             Great Britain Pound (GBP)                                                2.1%
                                                                                               Other Europe                                                             -2.1%
                    Fixed Income                                             33.0%             Australia Dollar (AUD) and New Zealand Dollar (NZD)                     -20.0%
                    U.S. Treasury & Credit1,*                                12.6%             Japan Yen (JPY)                                                          9.6%
                    Non-U.S. Treasury & Credit1,*                             6.7%             China Yuan (CNY)                                                         0.0%
                    Emerging                                                 13.7%             Asia (Excluding JPY and CNY)                                            13.1%
                                                                                               Other                                                                    6.4%
                    Unencumbered Cash                                        36.2%

                                             *Credit Detail                                                               Select Exposures Detail 2
                                             U.S. Investment Grade Spread      5.1%                                                             Russian Ruble (RUB)      8.8%
                                                    U.S. High Yield Spread     1.5%                                                             Brazilian Real (BRL)     8.8%
                                                         U.S. MBS Spread       0.0%                                                            Colombian Peso (COP)      7.1%
                                        European Investment Grade Spread       3.3%
                                               European High Yield Spread      0.0%

                    1
                     Reflected as 10-year exposures
                    2
                     Select currency exposures by largest expected contribution to portfolio risk

Market and currency strategy exposures shown above are as of quarter-end. For illustrative purposes only and not intended as investment advice. Allocations are subject to change without notice.
Important Disclosures June 2021 GENERAL INFORMATION Recipients of this document should be aware of the risks detailed in this paragraph. Please be advised that any return estimates or indications of past performance on this document are for information purposes only. Both past performance and yield may not be a reliable guide to future performance. The value of investments and income from them may fall as well as rise and investors may not get back the full amount invested. The value of shares and any income from them can increase or decrease. An investor may not get back the amount originally invested. Where investment is made in currencies other than the investor's base currency, the value of those investments, and any income from them, will be affected by movements in exchange rates. This effect could be unfavourable as well as favourable. Levels and bases for taxation may change. Specific securities identified and described to do not represent all of the securities purchased or sold and you should not assume that investments in the securities identified and discussed were or will be profitable. Holdings are subject to change at any time. References to specific securities and their issuers are for illustrative purposes only and are not intended and should not be interpreted as investment advice, offer or a recommendation to buy or sell any particular security or product. Any discussion of particular topics is not meant to be complete, accurate, comprehensive or up-to-date and may be subject to change. Factual information has been taken from sources we believe to be reliable, but its accuracy, completeness or interpretation cannot be guaranteed. Information and opinions expressed are those of the author and may not reflect the opinions of other investment teams within William Blair. Information is current as of the date appearing in this material only and subject to change without notice. Further specific risks may arise in relation to specific investments and you should review the risk factors very carefully before investing. Intended risk profile of the Fund may change overtime. The Fund is designed for long-term investors. The most current month-end performance information is available on sicav.williamblair.com. FUND INFORMATION The SICAV has appointed FUNDROCK MANAGEMENT COMPANY S.A., a "société anonyme" incorporated under the laws of the Grand Duchy of Luxembourg and having its registered office at 33, rue de Gasperich, L-5826 Hesperange as its management company (the "Management Company").The Management Company is authorised and regulated by the Luxembourg Supervisory Authority of the Financial Sector (the "CSSF") as the management company of UCITS (defined below) under the EU directive 2009/65/EC, as amended. The Management Company has been appointed as the management company of WILLIAM BLAIR SICAV, a "société d'investissement á capital variable", incorporated under the laws of the Grand Duchy of Luxembourg having its registered office at 31, Z.A.I. Bourmicht, Bertrange, registered in the R.C.S. Luxembourg under n° 98806 and approved by the CSSF as an undertaking for collective investment in transferable securities (UCITS) in accordance with the EU directive 2009/65/EC, as amended (the "Fund").
Important Disclosures                                                                                                                  June 2021

The Management Company has appointed WILLIAM BLAIR INVESTMENT MANAGEMENT, LLC, having its registered office at 150 North
Riverside Plaza Chicago, IL 60606-1598, USA ("William Blair Group") as the investment manager for the Fund (the "Investment Manager").

The Articles of Incorporation, the Prospectus, the Key Investor Information Documents (KIID), the Annual and Half-yearly Reports of the Fund
and the Subscription Form are available free of charge in English and German from our website SICAV.williamblair.com or at the registered
office of the Management Company (33, rue de Gasperich, L-5826 Hesperange, Grand Duchy of Luxembourg), at the registered office of the Fund
(William Blair SICAV, 31, Z.A. Bourmicht, L-8070 Bertrange, Grand Duchy of Luxembourg) or from the Swiss representative, First Independent
Fund Services Limited, Klausstrasse 33, CH-8008 Zurich, and in German language at Marcard, Stein & Co., Ballindamm 36, 20095 Hamburg,
Germany, and at Bank of Austria Creditanstalt AG, Am Hof 2, 1010 Vienna, Austria.

This is a marketing document and does not contain personalized recommendations or investment advice. Recipients of this document should
make their own investment decisions based upon the Fund Documents listed above (which can be obtained free of charge) and in accordance
with their own financial objectives and financial resources and, if in any doubt, should seek advice from independent professional advice as to
risks and consequences of any investment.

William Blair makes no representations that this document or any contents contained on it are appropriate or available for use in any
jurisdiction. This information is not intended to be published or made available to any person in any jurisdiction where doing so would result in
contravention of any laws or regulations applicable to the user. The SICAV Fund is currently registered for marketing in: Austria, Denmark,
Finland, France, Germany, Ireland, Luxembourg, Norway, Singapore, Spain, Sweden, Switzerland and the UK. Therefore the SICAV Fund is either
not registered to be marketed in your jurisdiction or may only be marketed or offered to professional investors in your jurisdiction.

To the extent permitted by applicable law, William Blair will accept no liability for any direct or consequential loss, damages, costs or prejudices
whatsoever arising from the use of this document or its contents.

Copyright © 2021 William Blair. "William Blair" refers to William Blair & Company, L.L.C., William Blair Investment Management, LLC, and
affiliates. No part of this material may be reproduced in any form, or referred to in any other publication, without express written consent.
You can also read