Q1 2021 MARKET AND ECONOMIC REVIEW - ENCASA Financial
←
→
Page content transcription
If your browser does not render page correctly, please read the page content below
Q1 2021
MARKET AND
ECONOMIC
REVIEW

PREPARED BY ENCASA FINANCIAL
Q1 MARKET AND ECONOMIC REVIEW | 2

INTRODUCTION

While 2020 was a year for the record books for equity
markets, the first quarter of 2021 has proved of equal
significance for fixed income markets.

The bond market experienced its worst quarter in four
decades, effectively bringing an abrupt end to the bond bull
market that began in 1982! The first quarter of 2021 is also a
great illustration of the power of dropping a bad quarter from     AUDREY L. ROBINSON
                                                                   PORTFOLIO MANAGER
a return calculation.

As the table above highlights, on a year over year basis to the end of March 2021, equity
markets globally provided a range of outstanding returns from a low of 27% to a high of
56.4%!

If we delve more closely in the table above, we can see the impact that dropping Q1 2020
had on those outsized returns. Take Canada – for calendar year 2020, the S&P/TSX
returned a comparatively tame 5.6%; fast forward to the one year (or four quarters) ending
March 31, 2021 and the Canadian market returned 44.3% - a giant leap as a result of
dropping the Q1 2020 return of (20.9%). And the same holds true (although not as
spectacularly) for the other equity markets.

The S&P 500 returned 56% (in USD) for the one year ending March 2021 versus 18% for
2020. International markets in the form of MSCI EAFE in Canadian dollars returned 27%
over the one year ending March versus 5.9% in 2020.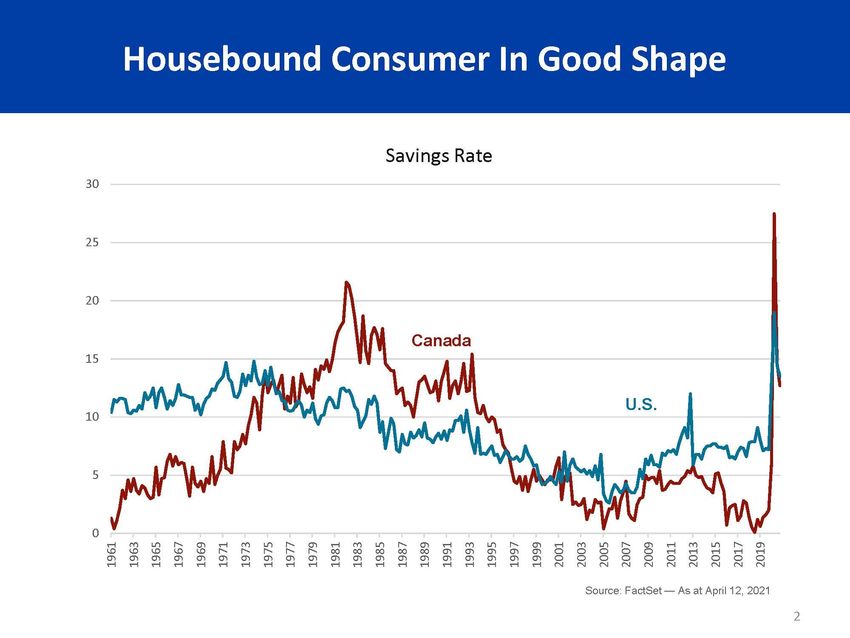
Q1 MARKET AND ECONOMIC REVIEW | 3

Industry Sector Returns 2021
                                                S&P/TSX                 S&P 500
                                             Q1'21   2020            Q1'21      2020

Consumer Discretionary                       12.5        17.1          3.1        33.3
Consumer Staples                              2.5         4.3         1.2         10.8
Energy                                      20.3       (26.6)        30.9        (33.7)
Financials                                  13.9          1.6        16.0         (1.7)
Health Care                                 38.0       (23.0)         3.2          13.5
Industrials                                  6.6        17.0          11.4         11.1
Information Technology (IT)                  (1.1)      80.7          2.0         43.9
Materials                                   (6.9)       21.2          9.1         20.7
Real Estate                                 10.0        (8.7)         9.0         (2.2)
Communication Services                        7.1       (3.7)         8.1        (23.6)
Utilities                                    3.4         15.3         2.8          0.5

Last quarter, we wrote about the rotation from growth into value that had begun in the
last half of 2020. We noted that in Canada, the rotation was most visible in the energy
and financial sectors. The chart above confirms that the rotation into value oriented
sectors continued into the first quarter, not just in Canada but also in the US. Energy, in
particular, made a remarkable comeback erasing almost all of its negative returns in
2020. Equally notable was the dramatic fall off in the IT sector – recording a negative
return (1.1%) in Canada in Q1 and an anemic 2% in the US versus 80.7% and 43.9%
respectively in 2020.

It was not a good quarter for fixed income markets. With the short end of the yield
curve controlled by central banks, those trading bonds express themselves at the long
end. With the vaccine rollouts underway and with additional fiscal stimulus measures
being introduced, bond investors turned their attention to signs of positive economic
growth and the seeds of rising inflation – with the result that government bond yields
rose sharply especially at the long end of the yield curve, albeit from very low levels. The
rise in yields translated into a loss of (5%) for the broad Canadian bond market in the
first quarter. Short-term bonds (between 1 and five years) posted a more modest
decline of (0.6%) reflecting the anchoring of the short end by the central banks. As a
result over the one year period, the FTSE Canada Short Term Bond Index outperformed
the FTSE Universe index returning 2.8% and 1.6% respectively.

The Canadian dollar continued to rally against the USD in the first quarter, although
more modestly than happened last year. Over the course of the past year, the Canadian
dollar climbed close to 10% against the USD while to date in 2021, the appreciation has
been a more modest 1.6%. A significant marker was achieved earlier in March when
CAD broke through 80 cents before settling back down just below that level. With the
currency appreciation, US returns were lower in Canadian dollar terms than in USD.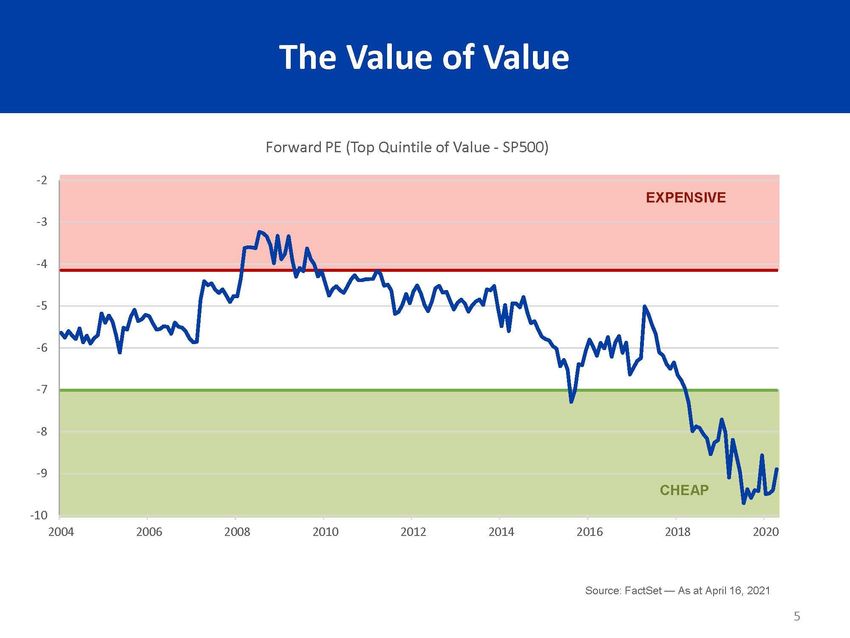
Q1 MARKET AND ECONOMIC REVIEW | 4

Equity Markets

Although the pandemic continued to upend global economies as we entered 2021, the
vaccination campaigns that began in earnest in some countries (notably Israel, the UK
and the US) and the fiscal stimulus programs gave investors a level of optimism that
allowed them to look through the pandemic and express optimism through rising
equity prices. Is that optimism justified?

Stock markets have been on a 12 year tear, despite recording the shortest bear market in
history just over a year ago. In fact, on a rolling 12 month basis, as the chart below
identifies, the US market has recorded its best performance since 1936. The last time it
came close was post 2008 when monetary policy tools were deployed to avert a major
financial collapse.

So, the 12 year bull market remains on trend with last year’s bear market a mere, short-
lived interruption.
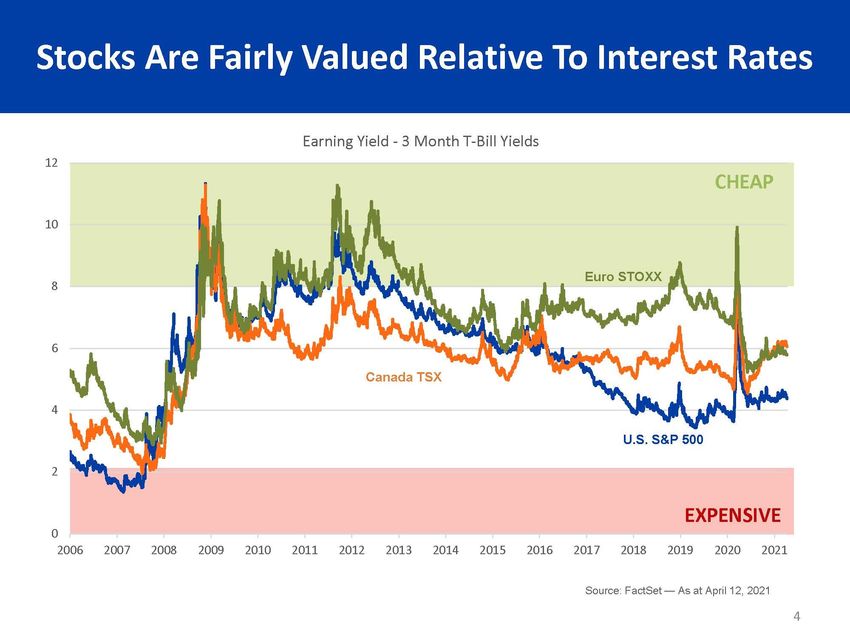
Q1 MARKET AND ECONOMIC REVIEW | 5

And stocks continue to be fairly valued relative to interest rates which bodes well for the
bull market continuing to have legs, at least for the near term. Therefore, from a
valuation perspective, the optimism appears justified.
Q1 MARKET AND ECONOMIC REVIEW | 6

It is almost unfathomable to consider that equity markets year over year to the end of
                                                       1
March, in the midst of one of the worst exogenous shocks to global economies,
produced double digit returns in the order of magnitude of 27% to 56%! Despite the
optimism from vaccines and fiscal stimulus, there is a definite schism between those
investment professionals who are optimistic and those who expect the bubble to burst.

There are a couple of additional factors at play beyond valuation that suggest that
optimism may be justified … at least for now. They are the level of personal savings that
have been accumulated over the pandemic and the rotation out of growth (think tech
stocks) and into value (think banks and energy companies).

Savings Rates

One of the unexpected outcomes of the various governments’ fiscal stimulus programs
has been the almost unprecedented increase in personal savings rates. Both Canadian
and US households have accumulated significant savings during the course of the
pandemic. In fact, in the US, cumulative personal savings is close to 9% of US GDP! This
is in stark contrast to the last great economic upheaval in 2008 when savings rates in
both Canada and the US were at all time lows, providing little cushion for those who lost
their jobs.

1. Exogenous is defined as coming from outside or being an independent variable.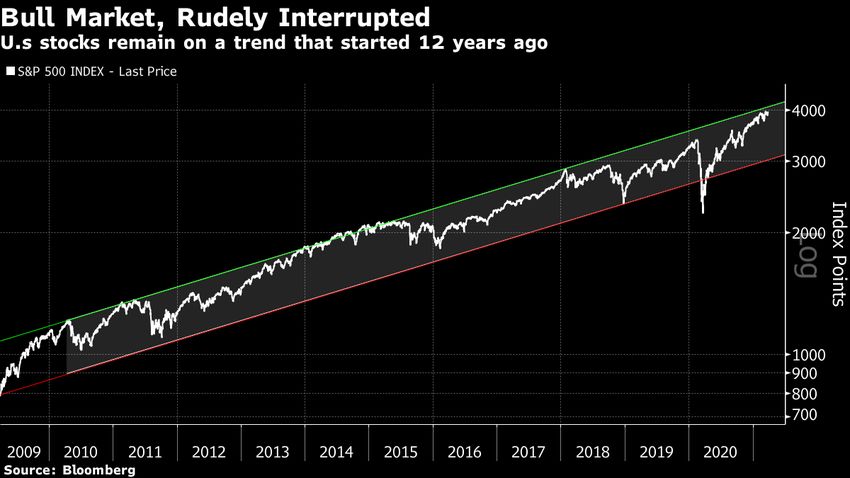
Q1 MARKET AND ECONOMIC REVIEW | 7
Q1 MARKET AND ECONOMIC REVIEW | 8

As the chart above highlights, these heightened savings are not just the result of
stimulus cheques to individual households, but stem almost equally from a pronounced
reduction in discretionary spending.

With non-essential retail, restaurants, personal service salons (hair and nail), and gyms all
closed or severely restricted, and hotels/motels and airlines at significantly reduced
capacity due to travel restrictions, there were few places for us to spend our dollars.
 While online shopping certainly took off (who hasn’t waited for eagerly for a courier to
knock on our door with our latest purchase), it could not completely fill the vacuum
caused by so many closures in the retail and service industries. And while there is no
expectation that once a semblance of normality returns these savings will be disgorged
completely, it is reasonable to presume that some will end up in the stock market.
Why?

FOMO 2 could well be at play as investors who sat on the sidelines in 2020 push back
into the market to get their double digit returns.

An equally compelling case can be made that the rotation out of growth and into value
may also underpin the bull market as investors view these “unloved” stocks as new
opportunities with significant upside.

As we have noted in previous commentaries, value stocks have underperformed growth
stocks in general for the better part of the past two decades. The underperformance in
2019 was especially pronounced. As a result, value stocks are extraordinarily cheap
relative to growth stocks.

2. Fear of Missing Out
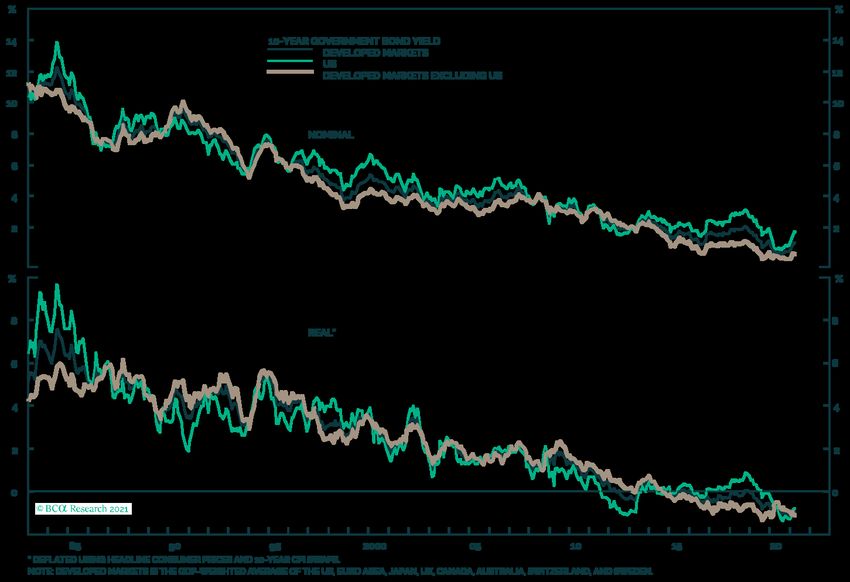
Q1 MARKET AND ECONOMIC REVIEW | 9

While there appeared to be a tug of war between growth and value in 2020, the
market started to shift to favouring value in the last quarter of 2020, a shift which
has been sustained through the first quarter of 2021. And as noted earlier, the
industry sectors that have benefitted from this rotation include financials (banks)
and energy – two sectors that are important components of the Canadian stock
market (S&P/TSX). The level of underperformance of value to growth means that
there is a fair bit of runway available for value stocks to “mean revert”.3 A positive
factor for equity markets that have enhanced exposure to commodities and
financials like Canada and Australia.

Interest Rates and the Fixed Income Market

If equity markets appear to have some positive momentum, what are we to make
of the fixed income markets which as we noted earlier had their worst quarter in
over four decades? Has the bull market in bonds come to its unceremonious end
with the rise in rates? 4

The charts below provide excellent illustrations of the forty year-long bull market
in bonds (denoted by the 10-year US treasury bond index) that bond managers
have had the good fortune of experiencing. In fact, I would hazard a guess that
there is a whole generation (or two) of bond managers who have only ever
managed bond portfolios in a declining interest rate environment! For them, the
first quarter may have been a very rude awakening.

3. Mean reversion is an important theoretical concept in the investment industry. Essentially it posits that asset price
volatility and historical returns will revert to their long-run average or mean level. It is especially applicable where there has
been a pronounced deviation from the long -run average as has been the case with value stocks.

4. A reminder that bond yields and bond prices have an inverse relationship; as yields decline, prices increase while prices
decline as yields increase – the latter being situation in Q1 2021.
Q1 MARKET AND ECONOMIC REVIEW | 10
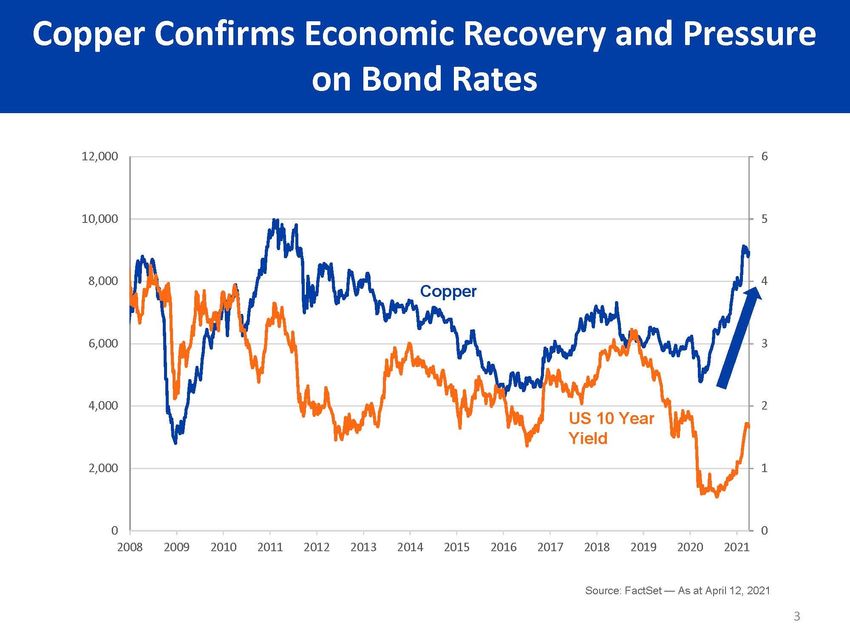
What has bond managers bidding up yields at the long end? The prospect of a
sustained economic recovery is definitely a key factor. While we are still in the throes of
a global pandemic, there are signs that global economies are well into their recovery
phases. These signs are referred to as leading indicators of economic health. A key one
is the price of copper.
5
Investment managers often refer to copper as Dr Copper for its ability to predict turning
points in the global economy. The chart below confirms copper as a leading indicator
in that the 10 year treasury yield increase followed the mid-2020 rise in the price of
copper by a few months. (An interesting side note regarding copper - BCA noted in
their Second Quarter Global Investment Strategy Outlook that a battery-powered
electric vehicle can contain more than 180 pounds of copper compared to 50 pounds in
conventional automobiles.)
5. The term Doctor Copper is market lingo for this base metal that is reputed to have a “Ph.D.in economics” because of its
ability to predict turning points in the global economy. Because of copper’s widespread applications in most sectors of the
economy – from homes and factories to electronics and power generation and transmission – demand for copper is often
viewed as a reliable leading indicator of economic health. This demand is reflected in the market price of copper.
(https://www.investopedia.com/terms/d/doctor-copper.asp)Q1 MARKET AND ECONOMIC REVIEW | 11
With respect to interest rates, there are two additional factors worth considering – the
level of nominal rates and the level of real rates.6
Nominal 10 year rates, even with the recent increase, remain at historically low levels,
well below the top and bottom bands of the secular decline trendline from 1982. And
real rates, despite the increase in nominal rates remain negative. In other words, from
either a nominal or real rate perspective, we continue to be in a low interest rate
environment.
However, of equal if not greater importance, is the position that central banks have
repeatedly expressed (including as recently as early April 2021) regarding rates –
that they are committed to keeping rates low at the short end of the yield curve for
the foreseeable future (aka lower for longer). Why?
Central banks from the stagflation period of the late 60’s and 70’s adopted price
stability (aka inflation management) as their principal monetary policy objective.
But as the levels of income inequality have grown ever starker over the past two
7
decades, and especially since 2008 and the GFC , central banks have added full
employment as a secondary equally important objective.
6. Real rates are rates after inflation has been subtracted.
7. Great Financial Crisis - the period during and post 2008.Q1 MARKET AND ECONOMIC REVIEW | 12
The charts below provide meaningful information for why central banks are
committed to a low interest rate environment.
Employment, especially for the bottom quartile of wage earners, has not recovered
to pre-pandemic highs, despite the headlines. In point of fact, full employment has
not recovered, and it is especially not the case for those at the bottom of the wage
scale. Raising rates at this juncture would unnecessarily impact those who can
least afford to see an economy slowed down by higher rates… because that is what
raising rates is designed to do … slam the breaks on an economy which in turn
leads to rising unemployment.
As Alliance Bernstein noted in their Q2 Global Macro Outlook, there are still nearly
10 million people out of work in the US! And for many of them, the layoff is no
longer temporary. Fully 70% of people who have been unemployed for over 15
weeks are not on temporary layoffs. It is these types of data that have central
banks committed to a “lower for longer” interest rate policy, irrespective of the
impact that policy might have on inflation. They are prepared to look through
8
current inflation rates, especially headline versus core inflation as millions of
workers remain unemployed. And growing income inequality has become a key
issue for central bankers.
8. Core inflation removes food and fuel from headline inflation; food and fuel tend to be volatile and are perceived to create
“noise” in headline inflation numbers.Q1 MARKET AND ECONOMIC REVIEW | 13
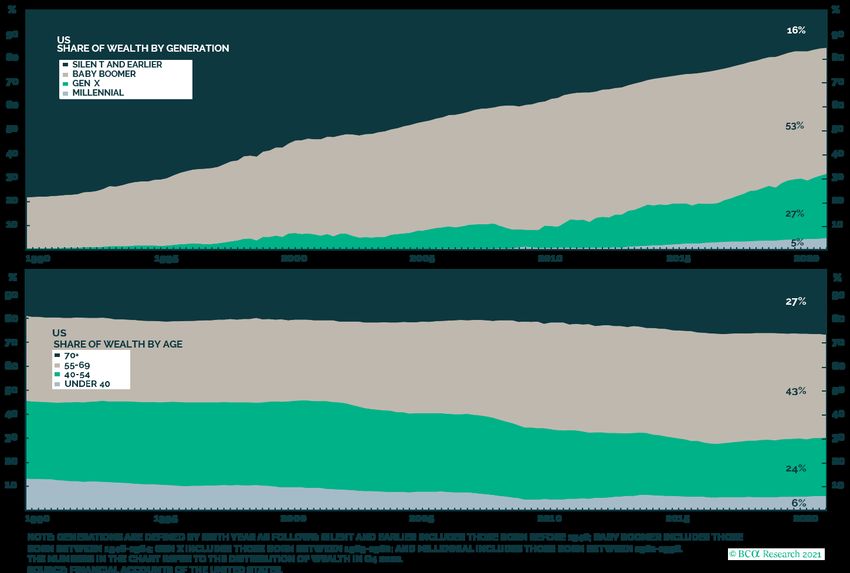
Q1 MARKET AND ECONOMIC REVIEW | 14

Demographics

Lastly, it is hard not to conjecture that demographics had and will continue to have
a part to play in sustaining the bull market in stocks.

The “boomer” generation (of which I count myself a member) control 53% of US
wealth! Given our demographics are similar if not identical, it is likely very similar
in Canada.

While historically a “boomer’s” asset allocation would shift to favour fixed income
over equities as one approaches and enters retirement, because of the paltry level
of interest rates over the past several years, retired “boomers” have been forced to
maintain a higher level of risk assets than financial planning traditionally
recommends to maintain a semblance of purchasing power in retirement. And
while interest rates may be rising, the absolute level of rates is still not sufficiently
robust to provide the financial cushion required in retirement. So, boomers who
control 53% of wealth, and the over 55’s who control 70% of wealth, are forced to
maintain a higher proportion of their capital in risk assets, like equities to generate
the financial cushion – a tendency that it is hard to see shifting as long as rates
remain relatively low, thereby offering support to the equity markets.
Q1 MARKET AND ECONOMIC REVIEW | 15

Conclusion

Although the bond bull market appears to be over, the bull market in stocks likely
still has legs at least for the near term. And while many are concerned that today’s
equity market feels like the TNT bubble that burst in 2000, there is one significant
difference between then and now – the shape of the yield curve. In 2000, the yield
curve was inverted meaning short rates were higher than long rates (a harbinger of
recession); today the yield curve is positively sloped with short rates lower than
long rates. And as BCA noted recently, bubbles burst when monetary policy
tightens – which is not the case today given central bank policy pronouncements.
 Are there clouds on the horizon? Most definitely but for the time being, the fiscal
and monetary conditions are supportive for equity markets. Fixed income markets
are definitely under pressure, although rates continue to be at historically low
levels despite the increase in the first quarter.

As always, the best defense against uncertainty and volatility is to have the
appropriate asset allocation for your portfolio.
IMPORTANT INFORMATION

 This material is not intended to be relied upon as research, investment, or tax advice
 and is not an implied or express recommendation, offer or solicitation to buy or sell any
 security or to adopt any particular investment or portfolio strategy. Any views and
 opinions expressed do not take into account the particular investment objectives,
 requirements, restrictions and circumstances of a specific investor and, thus, should not
 be used as the basis of any specific investment recommendation. Please consult your
 financial advisor for information applicable to your specific situation.

 Certain statements may be considered forward-looking information, which may involve
 risks and other assumptions related to factors. Factors include, but are not limited to,
 global financial and market conditions, interest and foreign exchange rates, economic
 and political factors, competition, legal or regulatory changes and general events. Any
 predictions, projections, estimates or forecasts should be construed as general
 information.

 While this information has been compiled from sources believed to be reliable, no
 representation or warranty, express or implied, is made by Encasa Financial Inc., as to its
 accuracy, completeness, timeliness or reliability. Encasa Financial takes no responsibility
 for any errors and omissions contained herein and accepts no liability whatsoever for
 any loss arising from any use of, or reliance on, this material.

 The views expressed in this material are based on the author's assessment and are
 subject to change without notice. The author may update or supplement their views
 and opinions whether as a result of new information, changing circumstances, future
 events or otherwise.

 Encasa Financial is an social purpose investment fund manager. Our goal is to provide
 investors with access to professional money management and expert advice from
 individuals who hold deep-rooted expertise in the non-profit and investment industries.
 We successfully manage the investment of capital reserves, security deposits, member
 share capital and operating reserves of social purpose non-profit organizations,
 co‑operatives, and affordable housing providers.

 Learn more at www.encasa.ca.

PHONE: 1-888-791-6671
FAX: 416-205-9459
EMAIL: INFORMATION@ENCASA.CA

TORONTO                                            VANCOUVER
119 SPADINA AVENUE, SUITE 400                      1651 COMMERCIAL DRIVE, SUITE 220
TORONTO, ONTARIO                                   VANCOUVER, BRITISH COLUMBIA
M5V 2L1                                            V5L 3Y3
You can also read