Hotel & Leisure Advisors - Hotels & Waterpark Industry - Insights, Trends and Valuation Keys y - Hotel Leisure Advisors
←
→
Page content transcription
If your browser does not render page correctly, please read the page content below

Hotel & Leisure Advisors

           Hotels & Waterpark Industry –
        Insights,
            g , Trends and Valuation Keysy

   Presented by David J. Sangree, MAI, CPA, ISHC – Hotel
                    & Leisure Advisors

Presentation by David J. Sangree, MAI, CPA, ISHC
Hotel & Leisure Advisors

                           Presentation Outline:

   1. National Hotel Overview
   2. National Waterparks Overview
   3 Appraisal and Market Analysis for Hotels and
   3.
      Waterparks

Presentation by David J. Sangree, MAI, CPA, ISHC
National Hotel Overview
Operating Performance Forecasts

•   Smith Travel Research (STR) reported 2015 was the strongest on record
    for the hotel industry. Records were set for supply (more than 1.8 billion
    room nights) and demand (almost 1.2 billion room nights). Performance
    metrics were the highest STR has ever benchmarked with occupancy at
    65.5%, ADR at $120.01 and RevPAR at $78.67.

                                     Overall U.S. Lodging Performance
                       Occupancy     % Change           ADR      % Change   RevPAR     % Change
                2011         60.0%          4.2%       $101.71       3.8%     $61.03        8.1%
                2012         61.4%          2.3%       $105.96       4.2%     $65.06        6.6%
                2013         62.2%          1.3%       $110.09       3.9%     $68.49        5.3%
                2014         64.4%          3.5%       $115.03       4.5%     $74.04        8.2%
                2015         65.5%          1.7%       $120.01       4.4%     $78.67        6.3%
          Source: Smith Travel Research

    Presentation by David J. Sangree, MAI, CPA, ISHC
National Hotel Overview
Regional Hotel Overview

•      Smith Travel Research also tracks key performance metrics by region.
       The following table shows the performance of U.S. hotels by region for
       the past four years, based on statistics from Smith Travel Research’s
       Hotel Review.
             Review
                                                        U .S . H ote l P e rformance by Re gions
                                          O ccupancy                                 AD R                                Re v P AR

                              2012       2013   2014       2015      2012      2013      2014       2015     2012     2013     2014     2015

       N e w Engla nd         61.4%   62.4%     63.5%      64.8%    $127.18   $131.85   $139.15    $145.84   $78.11   $82.22   $88.37   $94.48
      M iddle Atlantic        66.5%   65.9%     66.9%      67.6%    $150.64   $155.90   $160.87    $162.13   $100.12 $102.73 $107.58 $109.61
      S outh Atlantic         60.8%   61.9%     64.9%      66.6%    $103.49   $106.63   $110.77    $116.36   $62.89   $65.96   $71.91   $77.49
    East N orth C e ntra l    58.4%   59.0%     60.5%      61.5%    $92.47     $95.54    $99.68    $104.72   $53.97   $56.47   $60.34   $64.37
    Ea st S outh C e ntra l   56.2%   56.8%     59.2%      61.1%    $79.48     $82.00    $85.96    $90.62    $44.69   $46.54   $50.92   $55.34
W e st N orth C e ntra l      57 3%
                              57.3%   57 7%
                                      57.7%     59 6%
                                                59.6%      59 7%
                                                           59.7%    $84 20
                                                                    $84.20     $86 52
                                                                               $86.52    $89 96
                                                                                         $89.96    $93 06
                                                                                                   $93.06    $48 23
                                                                                                             $48.23   $49 97
                                                                                                                      $49.97   $53 63
                                                                                                                               $53.63   $55 56
                                                                                                                                        $55.56
W e st S outh C e ntra l      60.5%   61.4%     63.9%      63.1%    $88.87     $93.06    $96.05    $98.21    $53.75   $57.10   $61.36   $61.94
         M ounta in           59.1%   60.2%     63.1%      65.0%    $96.20     $98.97   $103.07    $108.69   $56.86   $59.62   $65.05   $70.66
           P acific           67.8%   69.4%     71.4%      73.3%    $126.30   $133.75   $141.90    $150.79   $85.65   $92.83   $101.32 $110.54
         Tota l U .S .        61.3%   62.2%     64.4%      65.6%    $106.25   $110.30   $114.92    $120.01   $65.15   $68.58   $74.04   $78.67
So u rce : Smith Tra ve l Re s e a rch

       Presentation by David J. Sangree, MAI, CPA, ISHC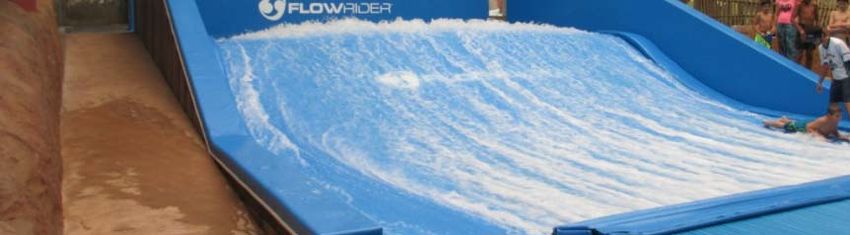
National Hotel Overview
Occupancy by Demand Segment

•   According to the 2015 TRENDS in the Hotel Industry report from CBRE Hotels/PKF,
    transient business dominates segmentation across all property types (except
    convention hotels), followed by group/contract business. Of note is that from 2014
    to 2015, transient demand at resort properties decreased while group demand
    increased. Contract demand makes up a very small portion of demand and was
    included in the group segment since those rooms are usually booked by the group
    sales team. Other demand makes up less than 1.3% in each category.
                                                     Hotel Customer Segmentation

                             100%

                              80%

                              60%
                                                                94.7%
                                              3.5%
                                     72.4%

                                                        72.4%

                                                                                            Other
                              40%
                                                                                53.4%
                                                                                    %
                                             83

                                                                9

                                                                        40.1%

                                                                                            Group/Contract
                              20%
                                                                                            Transient
                               0%

                                                                                        Source: CBRE Hotels

    Presentation by David J. Sangree, MAI, CPA, ISHC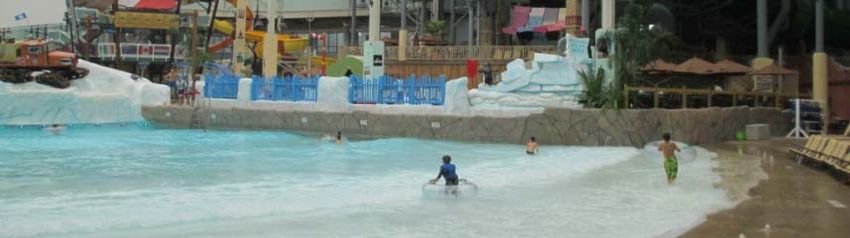
National Hotel Overview
New Supply of Lodging Rooms

•   With demand at an all-time high, the potential for oversupply of rooms is
    a concern; however, current projections point to continued absorption of
    new supply and steady occupancy rates. In late 2015, Lodging
    Econometrics reported that new hotel openings will accelerate over the
    next two years and peak in 2018-19.

                                      Hotel Openings 2012-2017
                                         Year          No. of Hotels
                                          2012             412
                                          2013             488
                                          2014             557
                                          2015             742
                                          2016             845
                                          2017             998
                                 Source: Lodging Econometrics

    Presentation by David J. Sangree, MAI, CPA, ISHC
National Hotel Overview
U.S. Pipeline by Chain Scale Segment

                                     U.S. Pipeline by Chain Scale Segment

                                               % Change                     % Change                  % Change
                                                                                     Total
                          Preliminary          vs.      In                  vs.                       vs.
                                                                                     Under
                          Existing Supply      Previous Construction        Previous                  Previous
                                                                                     Contract
                                               Year                         Year                      Year
    Chain scale
    Luxury                           108,485          0.4%          7,440       35.0%        11,549          18.7%
    Upper Upscale                    583,906          2.7%         11,524      -13.5%        38,885          23.4%
    Upscale                          660,640          4.7%         49,203       10.8%       135,580          18.1%
    Upper Midscale                   888,843          1.4%         47,954       36.1%       157,034          23.9%
    Midscale                         479,040         -0.8%          5,321        1.3%        29,533          17.0%
    Economy                          784,149          1.3%          1,512      130.8%         6,801          70.0%
    Unaffiliated                   1,533,422         -0.2%         17,749       13.2%        89,757         -11.0%
    Total                          5 038 485
                                   5,038,485          1 2%
                                                      1.2%        140 703
                                                                  140,703       17 2%
                                                                                17.2%       469 139
                                                                                            469,139          13 6%
                                                                                                             13.6%
    Note: Rooms under contract includes projects in In C onstruction, Final Planning and Planning stages.
    Source: STR

  Presentation by David J. Sangree, MAI, CPA, ISHC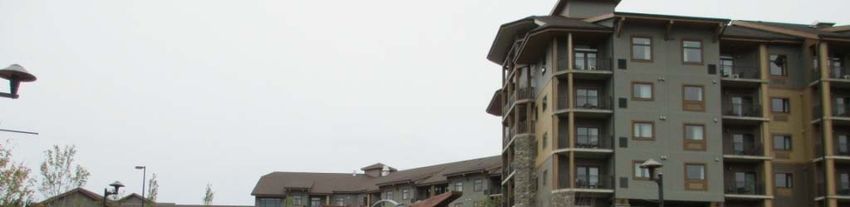
National Hotel Overview
Financial Performance
• These are financial statistics published in Smith Travel Research
                                                           Research’s
                                                                    s Host
   Almanac 2015, derived from income and expense statements of more
   than 5,300 hotels for year-end 2014 and trend data from more than
   30,000 hotels.

                               Revenue Per Occupied Room Night 2010-14

                                                        Full Service     Limited Service
                    $300.00

                    $250.00

                    $200.00

                                                                                                               $278.34
                                                                                           $271.78
                    $150.00                                            $2 44.76
                                                     40.08
                                  36.13

                                                   $24
                                $23

                                                                                                               $
                    $100 00
                    $100.00

                                                                                           $

                                                                                                                         $105.59
                                                                                                     $103.33
                                                                                  $95.13
                                          $91.01

                                                             $92.97

                     $50.00

                      $0.00
                                 2010               2011                2012                2013                2014
                     Source: STR Host Almanac 2015

  Presentation by David J. Sangree, MAI, CPA, ISHC
National Hotel Overview
Financial Performance
Gross Operating Profit* and NOI 2010-2014
60.0%
50.0%
50.3%
%
48.8%
%
49.8%
%
48.0%
%
48.0%
40.0%
39.3%
37.8%
37.8%
35.6%
34.6%
34.2%
34.0%
34.5%
31.5%
30.0% Full‐Service GOP
29.9%
7.3%
6.2%
Limited‐Service GOP
24.1%
%
27
26
2
20.0%
20.8%
19.1%
Full‐Service NOI
10.0%
Limited‐Service NOI
0.0%
2010 2011 2012 2013 2014
Note: NOI is "Amount Available for Debt Service and Other Fixed Charges" which is equivalent to "Earnings Before Interest, Taxes,
Depreciation and Amortization (EBITDA)."
*Before Management Fees and Franchise (Royalty) Fees
Source: Smith Travel Research
Presentation by David J. Sangree, MAI, CPA, ISHCNational Hotel Overview
Hotel Sales
In its 2015 Hotel Transaction Almanac,
Almanac STR Analytics reported $27
$27.88 billion
in U.S. hotel transactions occurred in 2014. During the year, $18.5 billion in
hotel assets changed hands while the remaining $9.3 billion resulted in new
hotel openings.
• The average price per key was a record $219,000, a 15.3% increase over
2013
• The total investment for acquisitions increased to $249,000, while the
average cost for construction was $186,000
• Distressed sales fell to normal levels,
levels with only 4% of hotel trades
involving a struggling asset
• The average cap rate declined to 8.2%, the lowest on record
Presentation by David J. Sangree, MAI, CPA, ISHCNational Hotel Overview
Hotel Sales
Hotel Sales by Chain Scale
Percentage
of Average Average Room
Transaction Room Price per Revenue
Transactions Activity Count Room Multiplier
Luxury 18 4% 366 $462,000 6.53
Upper Upscale 52 11% 381 $214,000 6.92
Upscale
Upsca e 178 40% 153 $227,000
, 6.42
Upper Midscale 61 14% 132 $111,000 4.12
Midscale 30 7% 129 $55,000 2.84
Economy 21 5% 96 $40,000 3.24
Independent
p 87 19% 196 $296,000 6.82
Total 447 100% 189 $219,000 5.50
Source: STR Hotel Transaction Almanac 2015
Presentation by David J. Sangree, MAI, CPA, ISHCNational Hotel Overview
Hotel Industry Outlook
• Looking ahead to 2016, projections from STR, CBRE Hotels, and
PricewaterhouseCoopers (PwC) show similar forecasts. Demand is
expected to outpace supply, and ADR and RevPAR growth will remain
strong The only noticeable difference between the forecasts is that STR is
strong.
forecasting more conservative ADR growth.
Industry Forecasts 2016
STR CBRE PwC
Supply 1.5% 1.8% 1.9%
Demand 2.3% 2.1% 2.1%
Occupancy 0 8%
0.8% 0 3%
0.3% 0 2%
0.2%
ADR 4.8% 5.2% 5.2%
RevPAR 5.7% 5.5% 5.5%
Source: STR/Hotel & Leisure Advisors
Presentation by David J. Sangree, MAI, CPA, ISHCNational Hotel Overview
Hotel Industry Outlook
• H&LA’s analysis indicates that the lodging industry will continue to enjoy
the steady success it has seen over the past few years
• We project continued improvement in 2016 with higher percentage ADR
gains for upscale, upper upscale and luxury properties
• Occupancy and ADR will start to show slight declines beginning in 2017 or
2018 on a national basis due to supply additions
Presentation by David J. Sangree, MAI, CPA, ISHCNational Waterpark Overview
Types of Waterparks:
• An outdoor waterpark is a facility offering three or more water slides and
other aquatic facilities.
• An indoor waterpark resort is a lodging establishment containing an
i d
indoor aquatic
ti facility
f ilit with
ith a minimum
i i off 10,000
10 000 square feet
f t off indoor
i d
waterpark space and inclusive of amenities such as slides, tubes, and a
variety of indoor water play features.
• A standalone indoor waterpark is an aquatic center without an attached
hotel, having a minimum of 10,000 square feet, inclusive of at least three
amenities such as slides, tubes, and a variety of indoor water play
features.
• A resort hotel with outdoor waterparkp is a hotel with three or more water
play features, such as slides, lazy rivers, or wave pools that require
lifeguards.
Presentation by David J. Sangree, MAI, CPA, ISHCNational Waterpark Overview Presentation by David J. Sangree, MAI, CPA, ISHC
National Waterpark Overview
                                       Types of Indoor Waterparks in Lodging Establishments

                                                                                                             Indoor Waterpark Destination
                                        Hotel with Water Features         Hotel with Indoor Waterpark
                                                                                                                       Resort

                                   1,000 to less than 10,000 square
Size of aquatic area                                                  10,000 to 30,000 square feet      30,000+ square feet
                                   feet

                                                                                                        multiple slides, tree house with
                                                                      multiple slides, tree house       slides, spray guns, tipping
                                   swimming pool, slide, toddler      with slides, spray guns,          buckets, Jacuzzi, various pools,
Possible Amenities
                                   area with mushroom, spray gun      tipping buckets, Jacuzzi,         lazy river, wave pool, water
                                                                      various ppools,, lazy
                                                                                          y river       coaster,, surfing,
                                                                                                                        g, outdoor
                                                                                                        waterpark features

Capacity                           up to 250 people                   250 to 750 people                 750 to 5,000 people

Minimum
Mi  i     Number
          N  b off
                                   1                                  3                                 10
Lifeguards

Size                               0 to 1,000 square feet             1,000 to 3,000 square feet        3,000 to 10,000 square feet

Source: Hotel & Leisure Advisors

       Presentation by David J. Sangree, MAI, CPA, ISHC
National Waterpark Overview
Growth in Indoor Waterpark Resorts in United States and Canada
Indoor Waterpark Resort Growth 2000 - 2015, United States and Canada
376OO
367OO 368OO 371OO
366OO
359OO 356OO
345OO
304OO
4,788,050
0
4,711,250
4,686,050
4,668,050
4,617,250
4,590,050
4,392,050
255OO
3,948,850
3,,351,850
195OO
149OO
2,460,350
121OO 145 147 148 149 146 148 149
136
1,836,600
96OO
116
79OO
1,527,600
100
64OO
1,900
1,085,,900
81
00
00
961
782,90
715,30
65
42
34 52
26
2000 2001 2002 2003 2004 2005 2006 2007 2008 2009 2010 2011 2012 2013 2014 2015
Total Resort Square Feet Total Number of Resorts Total Number of Resort Rooms
Source: Hotel & Leisure Advisors
Presentation by David J. Sangree, MAI, CPA, ISHCNational Waterpark Overview
Sizing of Indoor Waterparks
• The typical indoor waterpark resort property has approximately 150
square feet of net indoor waterpark space (waterpark area and play area
but excluding arcade, gift shop, offices) per guestroom
• This correlates with research that indicates an indoor waterpark should
have approximately 35 to 40 square feet of space per person
• Because a typical hotel room will house between three and four people,
this calls for between 105 and 160 square feet of indoor waterpark space
per guestroom. Some larger properties have up to 200 square feet of
indoor waterpark per guestroom
Presentation by David J. Sangree, MAI, CPA, ISHCNational Waterpark Overview
Indoor Waterparks Occupancy and Average Room Rates
Waterpark resorts generally outperform the non-waterpark hotels in the
same market. There are several reasons for this premium performance,
including:
• Year-round destination resorts
• Elimination of weather-related vacation risks
• Wide appeal of water
water-based
based recreation
• Increasing demand for short drive-to getaway vacations
• Themes with varying levels of appeal
• Location proximate to customer base
• Location within established family vacation market
Presentation by David J. Sangree, MAI, CPA, ISHCNational Waterpark Overview
Great Wolf Resort Performance Figures
G r e a t W o lf R e s o r ts , In c . O p e r a tin g S ta tis tic s fo r 2 0 0 8 - 2 0 1 2
2012 2011 2010 2009 2008
A ll P r o p e r t ie s
O ccupancy 6 6 .4 % 6 3 .3 % 5 9 .7 % 5 9 .8 % 6 3 .6 %
ADR $ 2 6 1 .5 5 $ 2 6 0 .1 0 $ 2 5 2 .3 0 $ 2 4 4 .7 9 $ 2 5 3 .8 5
RevPAR $ 1 7 3 .6 9 $ 1 6 4 .5 8 $ 1 5 0 .6 0 $ 1 4 6 .3 8 $ 1 6 1 .3 3
T o ta l R e v P O R $ 3 9 9 .3 0 $ 3 9 5 .1 8 $ 3 8 7 .8 3 $ 3 7 6 .9 3 $ 3 8 7 .7 0
T o ta l R e v P A R $ 2 6 5 .1 7 $ 2 5 0 .0 5 $ 2 3 1 .5 0 $ 2 2 5 .4 0 $ 2 4 6 .3 9
G e n e r a t io n I R e s o r t s ( W is c o n s in D e lls , S a n d u s k y , T r a v e r s e C ity , K a n s a s C it y )
O ccupancy 5 8 .9 % 5 6 .1 % 5 2 .7 % 5 2 .7 % 5 6 .6 %
ADR $ 2 0 0 .3 1 $ 2 0 1 .0 9 $ 1 9 8 .5 6 $ 1 9 1 .4 5 $ 1 9 6 .2 5
RevPAR $ 1 1 8 .0 5 $ 1 1 2 .7 7 $ 1 0 4 .7 0 $ 1 0 0 .9 2 $ 1 1 0 .9 8
T o ta l R e v P O R $ 3 0 2 .8 1 $ 3 0 2 .7 7 $ 3 0 0 .4 2 $ 2 8 8 .8 7 $ 2 9 3 .8 6
T o ta l R e v P A R $ 1 6 9 .7 9 $ 1 5 8 .4 2 $ 1 5 2 .2 8 $ 1 6 6 .1 9
G e n e r a tio n I I R e s o r t s ( W illia m s b u r g , P o c o n o s , N ia g a r a F a lls , M a s o n , G r a p e v in e , G r a n d M o u n d a n d C o n c o r d )
O ccupancy 6 9 .2 % 6 6 .0 % 6 3 .9 % 6 3 .7 % 6 7 .0 %
ADR $ 2 8 1 .2 4 $ 2 7 9 .0 5 $ 2 7 1 .8 6 $ 2 6 3 .9 5 $ 2 7 9 .5 8
RevPAR $ 1 9 4 .7 1 $ 1 8 4 .1 5 $ 1 7 3 .7 6 $ 1 6 8 .1 4 $ 1 8 7 .4 4
T o ta l R e v P O R $ 4 3 0 .3 3 $ 4 2 4 .8 4 $ 4 1 9 .9 2 $ 4 0 8 .3 6 $ 4 2 1 .5 0
T o ta l R e v P A R $ 2 8 0 .3 7 $ 2 6 8 .3 9 $ 2 6 0 .1 4 $ 2 8 2 .6 0
S o urce : G r e a t W o lf R e s o r t s , I n c . ( S E C F ilin
ili g s )
Presentation by David J. Sangree, MAI, CPA, ISHCNational Waterpark Overview
2015 Indoor Waterpark Openings
Indoor Waterpark Additions & Indoor Waterpark Resorts Opened in 2015
Indoor
State New
Indoor Waterparks and Resorts City Waterpark Sq.
/Prov Rooms
Ft
Ft.
Holiday Inn Express/Raptor Reef/Triple Play Laser Tag
Hayden ID 0 0
Arena and Ropes C ourse Addition
C amelback Lodge and Aquatopia Indoor Waterpark Tannersville PA 453 125,000
Kalahari Resort Pocono Manor PA 457 106 000
106,000
New Residence Inn at WaTiki Indoor Waterpark Resort Rapid C ity SD 144 0
Brookings Days Inn Waterpark Addition Brookings SD 0 12,000
Wilderness at the Smokies Boomerango Addition to
Sevierville TN 0 0
OWP
Total 1,054 243,000
Note: Resorts have a minimum of 10,000 square feet of indoor waterpark space
Source: Hotel & Leisure Advisors, LLC
Presentation by David J. Sangree, MAI, CPA, ISHCCamelback Lodge and
Waterpark
Presentation by David J. Sangree, MAI, CPA, ISHCCamelback Lodge and
Waterpark
Presentation by David J. Sangree, MAI, CPA, ISHCCamelback Lodge and
Waterpark
Presentation by David J. Sangree, MAI, CPA, ISHCNational Waterpark Overview
2016 Indoor Waterpark Openings
Indoor Waterpark Additions & Indoor Waterpark Resorts Open or Projected to Open in 2016
Indoor
State / New
Indoor Waterparks and Resorts City Waterpark Sq.
Prov Rooms
Ft.
Great Wolf Lodge Southern C alifornia Garden Grove CA 603 105,000
Great Wolf Lodge C olorado Springs CO 311 65,000
Four Points by Sheraton Hotel with an Expanded Former
Arlington Heights IL 161 10,000
C oC o Key Waterpark at Arlington Downs *
Ascend Hotel and Parrot C ove Indoor Waterpark Garden C ity KS 96 20,000
Expansion of C ape C odder Resort Hyannis MA 0 20,000
Holiday Inn Express Expansion Baxter MN 25 3,000
Treasure Island Resort Waterpark Addition Welch MN 0 30,000
Sahara Sams Expansion West Berlin NJ 0 10,000
Great Wolf Lodge addition of Wolf Tail Waterslide Niagara Falls ON 0 0
Hershey Lodge Water Works Addition Hershey PA 0 30,000
Valcartier Vacation Village Indoor Waterpark Resort Valcartier QC 153 102,000
McKinney Indoor Waterpark & Fitness C enter McKinney TX 0 24,000
Total 1,349 419,000
* In addition to existing 47,000 sf of indoor waterpark space
Presentation by David J. Sangree, MAI, CPA, ISHCNational Waterpark Overview
Outdoor Waterparks
Top Ten States with Outdoor
Waterparks
Rank State # of Waterparks*
1 Te as
Texas 72
Outdoor Waterpark and Population Comparison
2 Illinois 59
3 Florida 44 Region Number of Waterparks Population Number of People per Waterpark
4 C alifornia 39 Northeast 71 55,317,240 779,116
5 Ohio 44 Midwest 271 66,927,001 246,963
6 Missouri 49 South 267 114,555,744 429,048
7 I di
Indiana 25 West 121 71 945 553
71,945,553 594 591
594,591
8 Pennsylvania 23 Total 730 308,745,538 422,939
9 Minnesota 19 Source: Hotel & Leisure Advisors 2016 count of waterparks and 2010 U.S. C ensus
10 New Jersey 17
* with three or more slides
S
Source: Hotel
H l & Leisure
L i Advisors
Ad i
Presentation by David J. Sangree, MAI, CPA, ISHCNational Waterpark Overview
Outdoor Waterpark Top Attendance
Top 20 U.S. Waterparks
by Annual Attendance
2014 2013 % Change
Rank Park Location Attendance Attendance over 2013
1 Typhoon Lagoon at Walt Disney World Orlando, FL 2,185,000 2,142,000 2.0%
2 Blizzard Beach at Walt Disney World Orlando, FL 2,007,000 1,968,000 2.0%
3 Aquatica Orlando, FL 1,569,000 1,553,000 1.0%
4 Wet 'n Wild Orlando, FL 1,284,000 1,259,000 2.0%
5 Schlitterbahn New Braunfels, TX 1,037,000 1,027,000 1.0%
6 Water C ountry USA Williamsburg, VA 726,000 726,000 0.0%
7 Adventure Island Tampa, FL 644,000 638,000 0.9%
8 Schlitterbahn Galveston, TX 551,000 546,000 0.9%
9 Hyland Hills Water World Denver, C O 527,000 538,000 -2.0%
10 Six Flags Hurricane Harbor Arlington, TX 523,000 518,000 1.0%
11 Six Flags White Water Marietta, GA 510,000 505,000 1.0%
12 Wet 'n Wild Phoenix, AZ 467,000 472,000 -1.1%
13 Raging Waters San Dimas, C A 429,000 423,000 1.4%
14 Six Flags Hurricane Harbor Jackson, NJ 423,000 432,000 -2.1%
15 Splish-Splash Riverhead, NY 421,000 411,000 2.4%
16 Zoombezi Bay y Powell,, OH 416,000
, 360,000
, 15.6%
17 Dollywood's Splash C ountry Pigeon Ford, TN 408,000 400,000 2.0%
18 Wet 'n Wild Emerald Point Greensboro, NC 398,000 398,000 0.0%
19 Knott's Soak C ity USA Buena Park, C A 372,000 368,000 1.1%
20 Soak C ity at C edar Point Sandusky, OH 371,000 379,000 -2.1%
Source: TEA 2014 Theme Index, The Global Attractions Attendance Report (released 2015)
Presentation by David J. Sangree, MAI, CPA, ISHCNational Waterpark Overview
Outdoor Waterpark 2015 Openings
Outdoor Waterpark 2015 Openings
Total
Park Location Slides
Priv ate
Splash Kingdom Nacogdoches TX 8
Total 8
Municipal
P
Parrot Island
I l d Waterpark
W k F
Fort Smith
S i h AR 7
Del Mar Family Aquatic C enter Aurora CO 3
Paradice Island C ommerce C ity CO 5
Surf Lagoon Pooler GA 4
Freedom Springs Greenwood IN 4
y Waterpark
River Run Family p New Albany
y IN 5
West River C ommunity C enter Dickinson NC 3
Hillside Aquatics C enter Bismarck ND 3
Lyons C ity Pool Lyons NE 3
Avon Municipal Aquatic Facility Avon OH 5
Alameda Waterpark Butler PA 3
S l
Splash
h I
Island
l d (at
( t D.W.
D W Wilson
Wil C ommunity
it C enter)
t ) T ll h
Tullahoma TN 3
Doug Russell Pool Midland TX 7
Strawberry Park Pool Pasadena TX 5
Kaiser Pool renovation Wausau WI 5
Surf 'n Fun Waterpark San German PR 14
Total 79
Source: Hotel & Leisure Advisors
Presentation by David J. Sangree, MAI, CPA, ISHCNational Waterpark Overview
Outdoor Waterpark 2016 Openings
2016 Outdoor Waterpark Proposed Openings
Park Location Major Attractions
Priv ate
Water World Warner Robins GA 11 slides, lazy river, wave pool
Laguna Splash @ DelGrosso's
Amusement Park Tipton PA 9 slides, lazy river, wave pool
Lake Wylie Aquatic C enter C lover SC Olympic-size pool, children's pool with slides
Sandy Harbor Family Fun C enter
@Ocean Lakes Family C ampground Myrtle Beach SC Adventure river, 4-lane mat racer, slide
Scuttle's Island North Augusta SC 11 slides, lazy river, wave pool
NLand Surf Park Austin TX Surfing wave pool
Splash Kingdom Air Patrol Greenville TX 12 slides, wave pool, lazy river
Typhoon Texas Katy TX 27 slides, wave pool, lazy river
Municipal
Batesville Aquatic C enter Batesville AR 2 large slides, lazy river, dive pool, wading pool, splash pad
2 speed slides, a lazy river, a family slide and a zero-depth-
C abot Aquatic Park C abot AR
entry pool with play structures
The Pocahontas C ity Pool Pocahontas AR 5 slides, multiple pools, splash structure
Municipal Pool C arlsbad CA 3 slides, children's area with three smaller slides, lazy river
Longbranch Lagoon Dodge C ity KS 6 slides, wave pool, lazy river
Southwest Aquatic Facility Shawnee C ounty KS Zip line (into pool), 5 slides, bow tie pool with wave feature
American Legion Park Aquatic C enter Elizabethtown KY 6 slides, lazy river, climbing wall
Greenview Park Waterpark C olumbia SC 5 slides, children's pool, and lap pool
2 large slides, lazy river, children's area with slides and
Sisters of Mercy Waterpark Laredo TX water features
McKinney Aquatic & Fitness C enter McKinney TX 4 slides, current channel, leisure and tot pools
Victoria Municipal Pool and Waterpark Victoria TX 4 smaller slides, spray ground, lap lanes
Source: Hotel and Leisure Advisors
Presentation by David J. Sangree, MAI, CPA, ISHCNational Waterpark Overview
Waterpark Industry Outlook
• The
e waterpark
ate pa industry
dust y continues
co t ues to expand
e pa d in North
o t America,
e ca, with
t moreo e than
t a $500
million of new investment in indoor and outdoor waterparks and their related resorts in
2015.
• Total waterpark related development spending is expected to grow in 2016 with a
number of new facilities opening and many expansions of the existing waterparks
occurring.
• We attribute the waterpark industry's continued growth to properties offering a variety
off amenities and
d attractions that
h attract existing and
d new guests to the
h waterpark k
experience.
• The waterpark industry continues to face challenges in getting larger projects financed
as investors and lenders perceive the industry to be more risky than more traditional
real estate investments such as apartments.
• The industry has more risk due to a shorter operating season for outdoor waterparks,
which are typically open during the summer season only
only.
Presentation by David J. Sangree, MAI, CPA, ISHCAppraisal and Market Analysis
of Hotels and Waterparks
Appraisals have Unique Challenges
• Going concerns
• Very management intensive
• Hotels and waterparks have new customers every single day as
compared to apartments and office buildings which have annual leases
• Waterparks
p are riskier than hotels as they
y are entertainment-based
leisure real estate and are seasonal
Presentation by David J. Sangree, MAI, CPA, ISHCAppraisal and Market Analysis
of Hotels and Waterparks
Market Analysis
• A thorough market analysis of the local hospitality and indoor
waterpark resort market is an essential component of an hotel or
waterpark appraisal
• The value conclusion will depend heavily upon the data gathered for
this section
• Market research encompasses
p a large
g range
g of data.
Presentation by David J. Sangree, MAI, CPA, ISHCAppraisal and Market Analysis
of Hotels and Waterparks
Market Analysis – Economics and Demographics
When gathering economic and demographic data, the appraiser should look
within a market of the subject property and gather the following data:
• Population
p trends
• Household growth
• Household economics
• Area economics
• Area transportation
p
• Comparative data
Presentation by David J. Sangree, MAI, CPA, ISHCAppraisal and Market Analysis
of Hotels and Waterparks
Market Analysis – Economics and Demographics
Understanding
g the Hotel Market
Smith Travel Research Trend report profiles the daily, monthly, and annual occupancy,
average daily rate, and RevPAR of a market area.
• Existing competitors: How many competitors exist in the market? To what degree are they
competitive? How have they performed in past years in terms of occupancy, ADR and RevPAR?
• Recent hotel openings: How many hotels have opened in the past few years in the market?
• Potential hotel openings:
p g How many
y hotel projects
p j are in the works? What types
yp of hotels will
they be? How many rooms? What is their projected impact?
• Market segmentation and market penetration: What is the market segmentation and
penetration of each competitor in the market?
• Projections:
P j ti S
Synthesize
th i theth data
d t gathered
th d in
i the
th previous
i steps
t andd project
j t the
th performance
f
potential for the subject property. Based on the current market situation, is the subject likely
to perform well in terms of occupancy and ADR? What are its potential penetration rates and
market segmentation?
Presentation by David J. Sangree, MAI, CPA, ISHCAppraisal and Market Analysis
of Hotels and Waterparks
Market Analysis – Economics and Demographics
Understanding
g the Waterpark
p Market
• Existing and potential competitors: How many other waterparks are there
in the area? How many are proposed in the area? How are existing waterparks
performing in terms of attendance? To what degree will existing and potential
waterparks be competitive in terms of waterpark size,
size amenities,
amenities etc.?
etc ?
• Waterpark pricing and usage: What are waterparks in the area charging for use
of their waterpark? How many visitors do they receive in a year?
• Projections: Based on the data gathered above, how many waterpark visitors
can the subject property expect, and will these visitors come from hotels or will
they be local residents? What is a reasonable rate to charge for admission to the
waterpark?
Presentation by David J. Sangree, MAI, CPA, ISHCAppraisal and Market Analysis
of Hotels and Waterparks
Market Analysis – Economics and Demographics
Subject
j Property
p y Data
Information specific to the subject property is collected in the following areas.
• Financial data: When appraising an existing property one needs to interview the
management and obtain historical financial statements from them
them. For a
proposed property, the interview will be with the developer, and the appraiser will
need to obtain the financial forecast and the development budget.
• Performance data: If the property is existing, historical market segmentation
reports, usage figures, and other performance statistics are needed.
• Physical plant information: For an existing property one will look at the building
plans. For a proposed property, the appraiser will obtain the architectural plans.
• Governmental impacts: The subject’s ad valorem taxes, zoning information, sales
history, governmental restrictions, environmental regulations and other factors
which may affect the subject property should be collected.
Presentation by David J. Sangree, MAI, CPA, ISHCAppraisal and Market Analysis
of Hotels and Waterparks
The Valuation Process: Approaches to Value
Income Capitalization
p Approach
pp
• The discounted cash flow (DCF) analysis is most appropriate for hospitality
properties
• The appraiser
Th i should
h ld analyze
l andd estimate
ti t various
i revenue andd expense
departments in determining the projected net operating income and value for the
property
pp
•The appraiser should analyze
y and estimate various revenue and expense
p categories
g in
determining the projected net operating income and value for the property.
Presentation by David J. Sangree, MAI, CPA, ISHCAppraisal and Market Analysis
of Hotels and Waterparks
The Valuation Process:
Sales Comparison
p Approach
pp
• Because of this heavy reliance on market data, this approach is more difficult for properties
with limited sales, such as hotels and waterparks
• When using the sales comparison approach, the appraiser should fully analyze sales of
comparable
bl quality.
li
• Information should be obtained on sale price, historical performance, ADR or per capita
spending, financial performance, renovation cost information, amenity offerings of the
property, and special circumstances concerning the sale.
• Once the sales data have been fully analyzed, the appraiser will probably find a wide range of
values.
• Use an adjustment grid to account for differences in location, size of the property, time and
circumstances of the sale,, etc.
Presentation by David J. Sangree, MAI, CPA, ISHCAppraisal and Market Analysis
of Hotels and Waterparks
The Valuation Process:
Cost Approach
pp
In this approach, the cost to replace the improvements is estimated. Once replacement
costs are determined, a deduction is made for any depreciation. The result is then
combined with the estimated value of the underlying land. This approach is most
appropriate when appraising a proposed development where development budgets and land
cost are available.
It is typically not appropriate for an older hotel or waterpark due to the difficulty in
estimating depreciation.
Presentation by David J. Sangree, MAI, CPA, ISHCAppraisal and Market Analysis
of Hotels and Waterparks
The Valuation Process:
Valuation Conclusion
All three approaches to are reconciled to a final value conclusion:
• The income approach
pp is g
generally
y given
g greatest
g consideration,, while
the sales comparison approach and the cost approach support the
value conclusion
Presentation by David J. Sangree, MAI, CPA, ISHCAppraisal and Market Analysis
of Hotels and Waterparks
Breakdown of the Going Concern
• Personal Property
• Real Estate
• Business Value
Presentation by David J. Sangree, MAI, CPA, ISHCAppraisal and Market Analysis
of Hotels and Waterparks
Issues Related to Acquisitions
• Cost to Cure
• Before and After Value
• Estimate of Compensation
Presentation by David J. Sangree, MAI, CPA, ISHCQuestions?
David
D id JJ. S
Sangree, MAI,
MAI CPA,
CPA ISHC
Hotel & Leisure Advisors
14805 Detroit Ave.
Suite 420
Cleveland OH 44107
Cleveland,
Phone: 216-228-7000
dsangree@hladvisors.com
www.hladvisors.com
Presentation by David J. Sangree, MAI, CPA, ISHCNewer Cleveland Hotels Presentation by David J. Sangree, MAI, CPA, ISHC
Newer Cleveland Hotels

Presentation by David J. Sangree, MAI, CPA, ISHC
Newer Cleveland Hotels

Presentation by David J. Sangree, MAI, CPA, ISHC
Newer Cincinnati Hotel

Presentation by David J. Sangree, MAI, CPA, ISHC
Newer Columbus Hotel

Presentation by David J. Sangree, MAI, CPA, ISHC
Largest Hotel and Indoor
       Waterpark in Ohio

Presentation by David J. Sangree, MAI, CPA, ISHC
You can also read