Analysts' Ideas of the Week - Lowering our Estimate of Vaccine Rollout in the U.S. from Six to Five Months - Baystreet.ca
←
→
Page content transcription
If your browser does not render page correctly, please read the page content below

Analysts' Ideas of the Week
Lowering our Estimate of Vaccine Rollout in the U.S. from Six to Five Months

                             January 25, 2021
                          www.researchfrc.com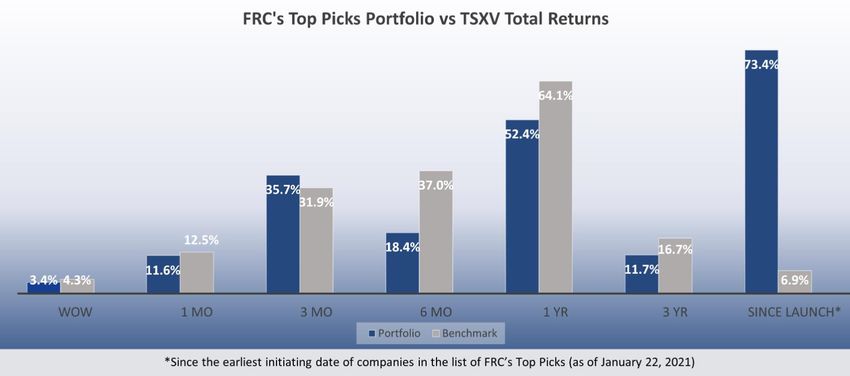
Page 2

                                             FRC Top Picks

Electric Vehicle (EV) metals stocks continue to dominate our list of best performers. The
following table shows last week’s top five performers among our Top Picks, including
three electric vehicle metals’ juniors, one silver junior, and a cannabis retailer. The top
performer, Giga Metals (TSXV: GIGA), was up 42% WoW on no company specific
news.

                                   Top Five Performers Last Week

                                                  Source: FRC

Overall, our portfolio (equally weighted) was up 36% in the past three months vs
the benchmark’s (TSXV) 32%. Our top picks were up 73% (on average) since initiation
of coverage vs the benchmark’s 7%.

                                                  Source: FRC

   ©2021 Fundamental Research Corp. “17+ Years of Bringing Undiscovered Investment Opportunities to the Forefront”
                    Click here to view FRC’s complete list of top picks
      PLEASE READ THE IMPORTANT DISCLOSURES AT THE BACK OF THIS REPORT
Page 3
Performance by Sector
Source: FRC
Our complete list of top picks (updated weekly) can be viewed here.
Weekly Mining Commentary
Four of the seven global equity indices we track declined WoW (orange bars).
Source: FRC / Various
Gold and silver prices gained strength, amid weakness in the US$. Among base metals,
copper prices are holding up as inventory levels continue to decline on the LME and
SHFE (Shanghai).
©2021 Fundamental Research Corp. “17+ Years of Bringing Undiscovered Investment Opportunities to the Forefront”
Click here to view FRC’s complete list of top picks
PLEASE READ THE IMPORTANT DISCLOSURES AT THE BACK OF THIS REPORTPage 4
As shown below, LME inventory levels of copper are down 51% YoY, which is a
key factor supporting prices.
©2021 Fundamental Research Corp. “17+ Years of Bringing Undiscovered Investment Opportunities to the Forefront”
Click here to view FRC’s complete list of top picks
PLEASE READ THE IMPORTANT DISCLOSURES AT THE BACK OF THIS REPORTPage 5
Valuations of both gold and base metals producers inched up by 1.1%, after a 4%
decline in the prior week.
©2021 Fundamental Research Corp. “17+ Years of Bringing Undiscovered Investment Opportunities to the Forefront”
Click here to view FRC’s complete list of top picks
PLEASE READ THE IMPORTANT DISCLOSURES AT THE BACK OF THIS REPORTPage 6
Our outlook has marginally improved since last week because of a decline in the
number of daily new cases of COVID-19 in most of the hardest hit nations, and a
pick-up in the pace of vaccine rollouts. Currently, 5.3% of the U.S. population has
received vaccinations vs 3.2% at the same time last week. This compares to 2.1% for
Canada (up from 1.5%), and 9.4% in the U.K. (up from 6.0%). Israel leads the pack at
29.5% (up from 25%).
©2021 Fundamental Research Corp. “17+ Years of Bringing Undiscovered Investment Opportunities to the Forefront”
Click here to view FRC’s complete list of top picks
PLEASE READ THE IMPORTANT DISCLOSURES AT THE BACK OF THIS REPORTPage 7
The U.S. is currently administering over 1M doses per day vs 0.8M at the same time
last week. At this rate, we estimate it will take approximately five months to
vaccine 25% of the U.S. population vs our last week’s estimate of six months. Our
estimate in the week prior to last was eight month.
As shown below, the U.S., U.K., Russia, and India reported a decline in daily new cases.
However, Mexico, and most of South America are reporting record high figures.
©2021 Fundamental Research Corp. “17+ Years of Bringing Undiscovered Investment Opportunities to the Forefront”
Click here to view FRC’s complete list of top picks
PLEASE READ THE IMPORTANT DISCLOSURES AT THE BACK OF THIS REPORTPage 8
Source: https://www.worldometers.info/coronavirus/
We are maintaining our outlook, and do not expect a recovery until H2-2021. We
continue to believe there is a disconnect between investor sentiment/ valuations, and
the expected weakness in H1-2021. As mentioned last week, Biden is expected to
announce a stimulus package focused on infrastructure, which we believe will be
positive for base metals. Our commodity price forecasts are shown below (unchanged):
In the following section, we review companies that announced key developments in the
past week.
©2021 Fundamental Research Corp. “17+ Years of Bringing Undiscovered Investment Opportunities to the Forefront”
Click here to view FRC’s complete list of top picks
PLEASE READ THE IMPORTANT DISCLOSURES AT THE BACK OF THIS REPORTPage 9
Mining / Exploration
Company Ticker Current Share FRC Fair Value Date of PR:
Name: Symbol Price: Estimate:
QMX Gold TSXV: QMX $0.28 $0.31 Jan 21, 2021
Corporation
PR Content FRC Opinion
Entered into a definitive agreement with Positive – The acquisition price is almost
Eldorado Gold (TSX: ELD), wherein inline with our fair value estimate of $0.31
Eldorado will acquire QMX for $132M, or per share. We had initiated coverage on
$0.30 per share, reflecting a 40% QMX on December 16, 2020, when its
premium to the share price prior to the shares were trading at just $0.15 per share.
announcement. Eldorado currently owns We had stated in our report that QMX is a
17% of QMX’s shares. The transaction is likely M&A target.
expected to close in March/April 2021.
Company Ticker Current Share FRC Fair Value Date of PR:
Name: Symbol Price: Estimate:
Noram TSXV: NRM $0.93 $1.27 Jan 21, 2021
Ventures Inc.
PR Content FRC Opinion
Completed its sixth hole of a 12-hole Positive - The current program is targeting
program. The latest hole was drilled to a mineralization to a depth of up to 500 ft. The
depth of 462 ft, making it one of the four existing resource on the project only
deepest holes drilled to date. accounts for mineralization to a depth of
Approximately 301 ft of favourable 100 m. Assays from the first three holes
claystones have been identified. were encouraging as all three showed
potential mineralization to depths of up to
400 ft. Near-term catalysts include
additional results from the ongoing drill
program, an updated resource estimate,
followed by a PEA. We also believe that
Noram is a likely M&A candidate.
©2021 Fundamental Research Corp. “17+ Years of Bringing Undiscovered Investment Opportunities to the Forefront”
Click here to view FRC’s complete list of top picks
PLEASE READ THE IMPORTANT DISCLOSURES AT THE BACK OF THIS REPORTPage 10
Company Ticker Current Share FRC Fair Value Date of PR:
Name: Symbol Price: Estimate:
Vista Gold NYSE: VGZ US$0.94 US$1.93 Jan 21, 2021
Corp.
PR Content FRC Opinion
Announced results of an ongoing drill Positive – These preliminary results
program (2,400 m) at the 100% owned Mt indicate expansion potential outside the
Todd gold project in Northern Territory, existing resource. A 2019 Preliminary
Australia. Feasibility Study had returned an After Tax-
NPV5% of US$1.13B, with an After Tax –
IRR of 30%, based on US$1,500 per oz
gold. Vista’s current enterprise value is just
US$85M.
Company Ticker Current Share FRC Fair Value Date of PR:
Name: Symbol Price: Estimate:
Southern Silver TSXV: SSV $0.46 $1.06 Jan 21, 2021
Exploration
Corp
PR Content FRC Opinion
An ongoing 10,000 m drill program on the Positive - These results are promising
Cerro Las Minitas project in Durango considering the program is focused on step-
state continues to return promising out drilling for resource expansion.
values. Key highlights are listed below: Approximately 7,500 m of drilling has been
completed to date. Note that the project
• 9.3 m down-hole interval (6.1mest.
already has a resource estimate of 134 Moz
TT) averaging 344 g/t Ag, 0.59 g/t Au.
AgEq indicated, and 138 Moz inferred
5.7% Pb and 3.9% Zn (728 g/t AgEq;
18.5% ZnEq);
• 1.4m interval (1.0m est. TT) grading
1070 g/t Ag, 0.09g/t Au, 23.3% Pb
and 3.2% Zn (1,937 g/t AgEq; 49.1%
ZnEq).
• 2.2m interval (1.4m est. TT)
averaging 520 g/t Ag, 0.34 g/t Au,
10.6% Pb and 9.8% Zn (1268 g/t
AgEq; 32.2% ZnEq);
• 7.5 m interval (5.0m est. TT)
averaging 364 g/t Ag, 0.3g/t Au, 7.0%
Pb and 1.8% Zn (678 g/t AgEq;
17.2% ZnEq);
©2021 Fundamental Research Corp. “17+ Years of Bringing Undiscovered Investment Opportunities to the Forefront”
Click here to view FRC’s complete list of top picks
PLEASE READ THE IMPORTANT DISCLOSURES AT THE BACK OF THIS REPORTPage 11
Company Ticker Current Share FRC Fair Value Date of PR:
Name: Symbol Price: Estimate:
E3 Metals Corp. TSXV: ETMC $1.73 $2.53 Jan 19, 2021
Jan 21, 2021
PR Content FRC Opinion
Announced a $7M bought deal financing Positive – We have identified a number of
at $1.19 per unit. Each unit consists of a catalysts for E3 in our recent update report.
common share and one warrant (exercise A test facility is expected to open in Calgary
price of $1.65 per share for two years). shortly to complete ongoing technology
development work. In addition, the
construction of a pilot plant will commence
in 2021. A Preliminary Economic
Assessment completed in late 2020 showed
an After Tax NPV8% of US$820M, and an
AT-IRR of 27%. E3’s market capitalization is
$59M.
Company Ticker Current Share FRC Fair Value Date of PR:
Name: Symbol Price: Estimate:
Sonoro Gold TSXV: SGO $0.24 $0.32 Jan 19, 2021
Corp
PR Content FRC Opinion
Released the remaining assay results of Positive – We believe the 2020 program
its 2020 drilling program at the Cerro supports the project’s viability for a bulk-
Caliche gold project in Sonora state, tonnage/heap-leach operation. SGO has
Mexico. already commenced its 2021 drill program,
which is expected to be completed by the
end of this quarter. The company is working
on an updated resource estimate, expected
in Q2, followed by a PEA. A 2019 maiden
resource estimate showed 201 Koz gold at
0.55 g/t AuEq (gold equivalent). An internal
Project Development Report in 2020
showed an exploration target (in addition to
the known inferred resource) of 0.7 Moz to
1.6 Moz in shallow mineralized areas. We
are expecting the updated resource
estimate to report a significant increase.
©2021 Fundamental Research Corp. “17+ Years of Bringing Undiscovered Investment Opportunities to the Forefront”
Click here to view FRC’s complete list of top picks
PLEASE READ THE IMPORTANT DISCLOSURES AT THE BACK OF THIS REPORTPage 12
Company Ticker Current Share FRC Fair Value Date of PR:
Name: Symbol Price: Estimate:
Golden Arrow TSXV: GRG $0.17 NA Jan 19, 2021
Resources
Corporation
PR Content FRC Opinion
Completed a shallow diamond drilling Positive – We believe these programs have
program, and an induced polarization allowed the company to delineate targets for
geophysical program at the Tierra Dorada a larger drill program, which is expected to
gold project in Paraguay. Key results include over 2,000 metres of diamond
included: drilling. The company needs a permit for
this program. GRG’s portfolio includes early
• 143.5 g/t gold over 0.5m, within 6m stage precious-metal projects in Paraguay,
averaging 14.53 g/t gold at 3-9m Chile and Argentina. The company’s current
• 11.8 g/t gold over 3.16m, within 7.75m market capitalization of $21M is less than its
averaging 6.09 g/t gold at 1.70-9.35m $23M working capital, implying that the
depth market is not even fully valuing its liquid
assets.
The geophysical program identified
multiple new targets along a 1,700 m
anomalous trend.
Special Situations and Technology
Company Ticker Current Share FRC Fair Value Date of PR:
Name: Symbol Price: Estimate:
Diginex Limited NASDAQ: US$16.22 US$24.70 Jan 21 & 25,
EQOS 2021
PR Content FRC Opinion
Announced the closing of a US$38.6M Positive – We are pleased to see
private placement at US$15 per share, management taking steps to capitalize on
along with a warrant (three years, with an the recent surge in cryptocurrency trading.
exercise price of $18.75). The company We think the partnership with GSR will bring
also announced a partnership with GSR more users to the trading platform for
Markets, a trading firm in the digital asset Diginex as a result of added liquidity. For
ecosystem, that will bring more liquidity 2021E and 2022E, we are estimating
for EQOS, Diginex’s cryptocurrency revenue of $10.21M and $87.15M,
exchange. respectively (unchanged).
©2021 Fundamental Research Corp. “17+ Years of Bringing Undiscovered Investment Opportunities to the Forefront”
Click here to view FRC’s complete list of top picks
PLEASE READ THE IMPORTANT DISCLOSURES AT THE BACK OF THIS REPORTPage 13
Company Ticker Current Share FRC Fair Value Date of PR:
Name: Symbol Price: Estimate:
Kontrol Energy CSE: KNR $2.59 $6.74 Jan 20, 2021
Corp.
PR Content FRC Opinion
Announced expansion of distribution Neutral – While broadening the distribution
network for BioCloud. The company also network is a positive step in reaching a
mentioned potential applications of the wider customer base, the fact that the
device in the sports sector, such as company is yet to announce any significant
dressing rooms and training facilities. The sales of BioCloud is slightly disappointing.
company is also in the process of We are maintaining our projections, but will
obtaining the Conformitè Europëenne be closely monitoring for updates in the
(CE) standard for the device, which would upcoming weeks.
enable it to initiate sales in Europe.
Cannabis
Company Ticker Current Share FRC Fair Value Date of PR:
Name: Symbol Price: Estimate:
Grown Rogue CSE: GRIN $0.12 $0.22 Jan 19, 2021
International Inc.
PR Content FRC Opinion
Announced it is in the process of raising Positive – We are pleased to see the
US$400k in two tranches in a non- company moving forward with the
brokered private placement. GRIN will acquisition of Golden Harvest. We expect
use the raised funds for the acquisition of the acquisition to close in Q2-2021. The
Golden Harvest. Golden Harvest issued expansion of Golden Harvest’s facility will
an unsecured note of $250k. These funds add to GRIN’s revenue generating capacity
will be used for expanding the Bay City once the acquisition is closed. For 2020E
facility in Michigan. and 2021E, we are estimating revenue of
$4M and $10M (unchanged), respectively.
©2021 Fundamental Research Corp. “17+ Years of Bringing Undiscovered Investment Opportunities to the Forefront”
Click here to view FRC’s complete list of top picks
PLEASE READ THE IMPORTANT DISCLOSURES AT THE BACK OF THIS REPORTPage 14
Company Ticker Current Share FRC Fair Value Date of PR:
Name: Symbol Price: Estimate:
Inner Spirit CSE: ISH $0.24 $0.47 Jan 21, 2021
Holdings Ltd.
PR Content FRC Opinion
Announced the launch of Spiritleaf Positive – We are pleased to see the
Origins, a private label cannabis brand; company add another potential revenue
expecting to be brought to market in generating unit to its portfolio. ISH is a
spring 2021. These products will be leader in the Canadian cannabis retail
developed through a partnership with space by store count. Our current estimates
Zenabis Global Inc. (TSX: ZENA). do not include Spiritleaf Origins. We will
incorporate once details of the product lines
are released. Our revenue projections for
FY2020E and FY2021E are $27M and
$35M (unchanged), respectively.
Company Ticker Current Share FRC Fair Value Date of PR:
Name: Symbol Price: Estimate:
Blueberries CSE: BBM $0.14 N/A Jan 20, 2021
Medical Corp.
PR Content FRC Opinion
Raised $1M through a non-brokered Neutral – Even though the use of funds was
private placement at $0.065 per share. not indicated by management, we are
The company also had a change in top pleased to see the company able to raise
management, as it appointed a new funds that we think will be used in its
Chairman and Interim CEO, and a new expansion efforts in Argentina. BBM has
member to its board of directors. indicated that the JV with the Argentinean
state-owned company, Cannabis Avatara,
S.E., is moving forward through BBM’s
recent acquisition of BBV Labs.
We have been waiting for a production
update from BBM’s operations in Colombia.
As our revenue estimates for 2020 and
2021 are primarily based on Colombian
operations, we are temporarily retracting our
fair value estimate due to lack of production-
related updates from the company.
©2021 Fundamental Research Corp. “17+ Years of Bringing Undiscovered Investment Opportunities to the Forefront”
Click here to view FRC’s complete list of top picks
PLEASE READ THE IMPORTANT DISCLOSURES AT THE BACK OF THIS REPORTPage 15
Weekly Cannabis Commentary
Cannabis Industry Performance
January 22, 2020
Company YTD 1-Week 1-Year
Aphria Inc. 85% 5% 118%
Aurora Cannabis Inc. 26% -11% -58%
Canopy Growth Corp. 36% 2% 36%
Cronos Group Inc. 54% -2% 24%
Tilray Inc. 114% -6% -14%
HEXO Corp. 80% -6% 11%
Organigram Holdings Inc. 28% -6% -44%
The Supreme Cannabis Co., Inc. 27% -5% -63%
AVERAGE 56% -4% 1%
MIN 26% -11% -63%
MAX 114% 5% 118%
Indexes YTD 1-Week 1-Year
HMMJ 35% -1% 57%
MCAN 31% -3% 34%
XCAN 37% -4% 8%
Source: TMX Money, FRC
Over the past week, the Horizons Marijuana Life Sciences ETF (TSX: HMMJ / “HMMJ”),
the Standard & Poor’s/MX International Cannabis Index (“MCAN”), and the Standard &
Poor’s/TSX Cannabis Index (“XCAN”) generated returns of -1%, -3%, and -4%,
respectively. There were no noteworthy industry developments last week.
While there is growing optimism in the U.S. market for potential federal
legalization, the Canadian industry has been impacted by oversupply challenges
(see chart below). Also, the latest retail cannabis sales data showed a 3.2% MoM dip
in November. This is the first MoM decline since April. This data was recently published,
and we are trying to pinpoint the exact reason for the decline. Sources indicate that this
drop might be because of tighter restrictions in Ontario and Quebec. With inventories
piling up, we expect smaller producers to face challenges. Therefore, sector-wide
consolidation is highly likely this year.
©2021 Fundamental Research Corp. “17+ Years of Bringing Undiscovered Investment Opportunities to the Forefront”
Click here to view FRC’s complete list of top picks
PLEASE READ THE IMPORTANT DISCLOSURES AT THE BACK OF THIS REPORTPage 16
Source: Marijuana Business Daily
Canadian Cannabis Retail Sales ($B)
Source: FRC / Statscan
Valuation of Select Canadian LPs
The following chart shows the average Enterprise Value to Revenue (“EV/R”) ratio of
the Canadian cannabis companies we track.
©2021 Fundamental Research Corp. “17+ Years of Bringing Undiscovered Investment Opportunities to the Forefront”
Click here to view FRC’s complete list of top picks
PLEASE READ THE IMPORTANT DISCLOSURES AT THE BACK OF THIS REPORTPage 17
Average EV/R (October 2019 – January 2021)
January 15, 2021 January 22, 2021
Company Ticker TEV/Revenue TEV/EBITDA TEV/Revenue TEV/EBITDA
Aphria Inc. TSX: APHA 9.0 84.5 9.4 87.7
Aurora Cannabis Inc. TSX: ACB 10.3 NM 9.3 NM
Canopy Growth Corp. TSX: WEED 31.4 NM 31.8 NM
Cronos Group Inc. TSX: CRON 99.1 NM 95.4 NM
Tilray Inc. NASDAQ: TLRY 16.3 NM 15.0 NM
HEXO Corp. NYSE: HEXO 11.1 NM 10.2 NM
Organigram Holdings Inc. TSX: OGI 6.4 NM 6.1 NM
The Supreme Cannabis Co., Inc. TSX: FIRE 4.1 NM 4.1 NM
AVERAGE 23.5 NM 22.6 NM
MEDIAN 10.7 NM 9.8 NM
MINIMUM 4.1 NM 4.1 NM
MAXIMUM 99.1 NM 95.4 NM
Source: S&P Capital IQ, FRC
The average EV/R, as of January 22, 2021, was 22.6x – a WoW decrease from 23.5x.
The average EV/R, from October 7, 2019 to January 15, 2021, was 12.4x.
©2021 Fundamental Research Corp. “17+ Years of Bringing Undiscovered Investment Opportunities to the Forefront”
Click here to view FRC’s complete list of top picks
PLEASE READ THE IMPORTANT DISCLOSURES AT THE BACK OF THIS REPORTPage 18
Canadian Retail Cannabis Pricing
Province (As of 2021/1/25) Average Price per Gram Average Price per Gram THC Average Price per Gram CBD # of Products Min. Price Max. Price
B.C. $ 9.55 $ 9.65 $ 8.42 159 $ 3.93 $ 15.71
Ontario $ 9.70 $ 9.90 $ 8.08 319 $ 4.00 $ 23.98
Quebec $ 9.26 $ 9.23 $ 9.55 219 $ 4.85 $ 15.06
Alberta $ 11.42 $ 11.41 $ 11.39 332 $ 3.93 $ 22.00
N.B. $ 9.96 $ 10.23 $ 7.58 170 $ 3.57 $ 16.28
P.E.I. $ 9.80 $ 9.82 $ 9.49 163 $ 2.20 $ 23.30
Newfoundland $ 10.12 $ 10.08 $ 10.36 155 $ 4.46 $ 15.40
Yukon $ 14.98 $ 15.07 $ 13.95 12 $ 10.49 $ 16.15
N.S. $ 10.37 $ 10.42 $ 9.82 180 $ 5.36 $ 42.85
Nunavut $ 11.73 $ 11.85 $ 12.41 33 $ 5.19 $ 17.91
Northwest Territories $ 12.44 $ 13.35 2 $ 12.08 $ 17.28
Manitoba $ 11.45 $ 11.40 $ 11.62 325 $ 4.90 $ 20.43
Saskatchewan $ 12.62 $ 12.66 $ 12.08 189 4.95 38.50
CANADA $ 11.03 $ 11.16 $ 10.40
Province (As of 2021/1/18) Average Price per Gram Average Price per Gram THC Average Price per Gram CBD # of Products Min. Price Max. Price
B.C. $ 10.10 $ 10.18 $ 8.42 285 $ 3.93 $ 80.29
Ontario $ 9.67 $ 9.87 $ 8.08 317 $ 4.00 $ 23.98
Quebec $ 9.27 $ 9.24 $ 9.55 221 $ 4.85 $ 15.06
Alberta $ 11.42 $ 11.42 $ 11.39 333 $ 3.93 $ 22.00
N.B. $ 9.98 $ 10.25 $ 7.58 162 $ 3.57 $ 16.28
P.E.I. $ 9.80 $ 9.82 $ 9.49 163 $ 2.20 $ 23.30
Newfoundland $ 10.12 $ 10.08 $ 10.36 155 $ 4.46 $ 15.40
Yukon $ 14.98 $ 15.07 $ 13.95 12 $ 10.49 $ 16.15
N.S. $ 10.39 $ 10.44 $ 9.82 177 $ 5.36 $ 42.85
Nunavut $ 11.73 $ 11.85 $ 12.41 33 $ 5.19 $ 17.91
Northwest Territories $ 11.54 $ 11.54 2 $ 12.08 $ 17.28
Manitoba $ 11.49 $ 11.46 $ 11.62 323 $ 4.90 $ 20.43
Saskatchewan $ 12.70 $ 12.74 $ 12.08 181 4.95 38.50
CANADA $ 11.01 $ 11.07 $ 10.40
Source: Online Provincial Cannabis Stores, FRC
The average retail price per gram increased week-over-week from $11.01 to
$11.03. The below chart shows Canadian retail dried cannabis flower pricing since we
initiated price coverage.
Canadian Retail Dried Cannabis Flower Pricing
Source: Online Provincial Cannabis Stores, FRC
Canadian Retail Cannabis Stores
As of January 25, 2021, there are 1,494 retail cannabis stores, a week-over-week
increase of 40 stores across Canada, including 35 in Ontario, three in Alberta, and two
in B.C. As noted earlier, we continue to see Ontario’s store growth significantly outpace
©2021 Fundamental Research Corp. “17+ Years of Bringing Undiscovered Investment Opportunities to the Forefront”
Click here to view FRC’s complete list of top picks
PLEASE READ THE IMPORTANT DISCLOSURES AT THE BACK OF THIS REPORTPage 19
other provinces due to the recent mandate of the Alcohol and Gaming Commission of
Ontario (AGCO) to increase retail store authorizations.
Nationwide Store Count
Jan-4-2021 Jan-11-2021 Jan-18-2021 Jan-25-2021
Geographic Region Store Count Store Count Store Count Store Count Population Population / Store
Alberta 547 551 553 556 4,428,247 7,964
B.C. 303 304 304 306 5,120,184 16,733
Manitoba 38 56 56 56 1,379,121 24,627
N.B. 20 20 20 20 780,890 39,045
N.S. 20 21 21 21 978,274 46,584
Newfoundland 27 30 30 30 520,437 17,348
Northwest Territories 5 5 5 5 44,982 8,996
Nunavut n/a na na na 39,486 N/A
Ontario 322 336 354 389 14,745,040 37,905
P.E.I. 4 4 4 4 158,717 39,679
Quebec 46 57 57 57 8,552,362 150,041
Saskatchewan 50 45 45 45 1,181,987 26,266
Yukon 5 5 5 5 41,293 8,259
CANADA 1,387 1,434 1,454 1,494 37,971,020 25,416
Source: Provincial Websites, FRC
©2021 Fundamental Research Corp. “17+ Years of Bringing Undiscovered Investment Opportunities to the Forefront”
Click here to view FRC’s complete list of top picks
PLEASE READ THE IMPORTANT DISCLOSURES AT THE BACK OF THIS REPORTPage 20
Disclaimers and Disclosure
The opinions expressed in this report are the true opinions of the analyst(s) about any companies and industries mentioned. Any
“forward looking statements” are our best estimates and opinions based upon information that is publicly available and that we
believe to be correct, but we have not independently verified with respect to truth or correctness. There is no guarantee that our
forecasts will materialize. Actual results will likely vary. Certain companies mentioned in pages 2, and 9-14 are covered by FRC
under an issuer paid model. FRC or companies with related management, and Analysts, may hold shares in some companies
mentioned in this report including KNR and Barrick. Distribution procedure: our reports are distributed first to our web-based
subscribers on the date shown on this report then made available to delayed access users through various other channels for a
limited time.
To subscribe for real-time access to research, visit https://www.researchfrc.com/website/subscribe for subscription options.
This report contains "forward looking" statements. Forward-looking statements regarding the Company, industry, and/or stock’s
performance inherently involve risks and uncertainties that could cause actual results to differ from such forward-looking statements.
Factors that would cause or contribute to such differences include, but are not limited to, continued acceptance of the Company's
products/services in the marketplace; acceptance in the marketplace of the Company's new product lines/services; competitive
factors; new product/service introductions by others; technological changes; dependence on suppliers; systematic market risks and
other risks discussed in the Company's periodic report filings, including interim reports, annual reports, and annual information forms
filed with the various securities regulators. By making these forward-looking statements, Fundamental Research Corp. and the
analyst/author of this report undertakes no obligation to update these statements for revisions or changes after the date of this
report.
Fundamental Research Corp DOES NOT MAKE ANY WARRANTIES, EXPRESSED OR IMPLIED, AS TO RESULTS TO BE
OBTAINED FROM USING THIS INFORMATION AND MAKES NO EXPRESS OR IMPLIED WARRANTIES OR FITNESS FOR A
PARTICULAR USE. ANYONE USING THIS REPORT ASSUMES FULL RESPONSIBILITY FOR WHATEVER RESULTS THEY
OBTAIN FROM WHATEVER USE THE INFORMATION WAS PUT TO. ALWAYS TALK TO YOUR FINANCIAL ADVISOR BEFORE
YOU INVEST. WHETHER A STOCK SHOULD BE INCLUDED IN A PORTFOLIO DEPENDS ON ONE’S RISK TOLERANCE,
OBJECTIVES, SITUATION, RETURN ON OTHER ASSETS, ETC. ONLY YOUR INVESTMENT ADVISOR WHO KNOWS YOUR
UNIQUE CIRCUMSTANCES CAN MAKE A PROPER RECOMMENDATION AS TO THE MERIT OF ANY PARTICULAR
SECURITY FOR INCLUSION IN YOUR PORTFOLIO. This REPORT is solely for informative purposes and is not a solicitation or an
offer to buy or sell any security. It is not intended as being a complete description of the company, industry, securities or
developments referred to in the material. Any forecasts contained in this report were independently prepared unless otherwise
stated, and HAVE NOT BEEN endorsed by the Management of the company which is the subject of this report. Additional
information is available upon request. THIS REPORT IS COPYRIGHT. YOU MAY NOT REDISTRIBUTE THIS REPORT WITHOUT
OUR PERMISSION. Please give proper credit, including citing Fundamental Research Corp and/or the analyst, when quoting
information from this report. The information contained in this report is intended to be viewed only in jurisdictions where it may be
legally viewed and is not intended for use by any person or entity in any jurisdiction where such use would be contrary to local
regulations or which would require any registration requirement within such jurisdiction.
©2021 Fundamental Research Corp. “17+ Years of Bringing Undiscovered Investment Opportunities to the Forefront”
Click here to view FRC’s complete list of top picks
PLEASE READ THE IMPORTANT DISCLOSURES AT THE BACK OF THIS REPORTYou can also read