Click to edit Master title style - Investor Update - CLR Investor Relations
←
→
Page content transcription
If your browser does not render page correctly, please read the page content below

Click to edit Master title style

  Investor Update
     April 2021

NYSE: CLR                PROPERTY
                    PROPERTY      OF CONTINENTAL
                             OF CONTINENTAL      RESOURCES,
                                            RESOURCES,       INC. REPRODUCTION
                                                       INC. REPRODUCTION       AND DISTRIBUTION
                                                                         AND DISTRIBUTION       WITH WRITTEN
                                                                                          WITH WRITTEN       PERMISSION
                                                                                                       PERMISSION ONLY ONLY
Click to edit MasterInformation
Forward-Looking      title style
Cautionary Statement for the Purpose of the “Safe Harbor” Provisions of the Private Securities Litigation Reform Act of 1995

This presentation includes “forward-looking statements” within the meaning of Section 27A of the Securities Act of 1933 and Section 21E of the Securities Exchange Act of 1934.
All statements included in this presentation other than statements of historical fact, including, but not limited to, forecasts or expectations regarding the Company’s business and
statements or information concerning the Company’s future operations, performance, financial condition, production and reserves, schedules, plans, timing of development, rates
of return, budgets, costs, business strategy, objectives, and cash flows, are forward-looking statements. When used in this presentation, the words “could,” “may,” “believe,”
“anticipate,” “intend,” “estimate,” “expect,” “project,” “budget,” “target,” “plan,” “continue,” “potential,” “guidance,” “strategy,” and similar expressions are intended to identify forward-
looking statements, although not all forward-looking statements contain such identifying words.

Forward-looking statements are based on the Company’s current expectations and assumptions about future events and currently available information as to the outcome and
timing of future events. Although the Company believes these assumptions and expectations are reasonable, they are inherently subject to numerous business, economic,
competitive, regulatory and other risks and uncertainties, most of which are difficult to predict and many of which are beyond the Company’s control. No assurance can be given
that such expectations will be correct or achieved or the assumptions are accurate. The risks and uncertainties include, but are not limited to, commodity price volatility; the
geographic concentration of our operations; financial, market and economic volatility; the effects of any national or international health crisis; the inability to access needed capital;
the risks and potential liabilities inherent in crude oil and natural gas exploration, drilling and production and the availability of insurance to cover any losses resulting therefrom;
difficulties in estimating proved reserves and other revenue-based measures; declines in the values of our crude oil and natural gas properties resulting in impairment charges; our
ability to replace proved reserves and sustain production; our ability to pay future dividends, reduce debt, or complete share repurchases; the availability or cost of equipment and
oilfield services; leasehold terms expiring on undeveloped acreage before production can be established; our ability to project future production, achieve targeted results in drilling
and well operations and predict the amount and timing of development expenditures; the availability and cost of transportation, processing and refining facilities; legislative and
regulatory changes adversely affecting our industry and our business, including initiatives related to hydraulic fracturing and greenhouse gas emissions; increased market and
industry competition, including from alternative fuels and other energy sources; and the other risks described under Part I, Item 1A Risk Factors and elsewhere in the Company’s
Annual Report on Form 10-K for the year ended December 31, 2020, registration statements and other reports filed from time to time with the SEC, and other announcements the
Company makes from time to time.

Readers are cautioned not to place undue reliance on forward-looking statements, which speak only as of the date on which such statement is made. Should one or more of the
risks or uncertainties described in this presentation occur, or should underlying assumptions prove incorrect, the Company’s actual results and plans could differ materially from
those expressed in any forward-looking statements. All forward-looking statements are expressly qualified in their entirety by this cautionary statement. Except as expressly stated
above or otherwise required by applicable law, the Company undertakes no obligation to publicly correct or update any forward-looking statement whether as a result of new
information, future events or circumstances after the date of this presentation, or otherwise.

Readers are cautioned that initial production rates are subject to decline over time and should not be regarded as reflective of sustained production levels. In particular,
production from horizontal drilling in shale oil and natural gas resource plays and tight natural gas plays that are stimulated with extensive pressure fracturing are typically
characterized by significant early declines in production rates.

We use the term "EUR" or "estimated ultimate recovery" to describe potentially recoverable oil and natural gas hydrocarbon quantities. We include these estimates to
demonstrate what we believe to be the potential for future drilling and production on our properties. These estimates are by their nature much more speculative than estimates of
proved reserves and require substantial capital spending to implement recovery. Actual locations drilled and quantities that may be ultimately recovered from our properties will
differ substantially. EUR data included herein, if any, remain subject to change as more well data is analyzed.

                                                             PROPERTY OF CONTINENTAL RESOURCES, INC. REPRODUCTION AND DISTRIBUTION WITH WRITTEN PERMISSION ONLY
                                                                                                                                                                                                  2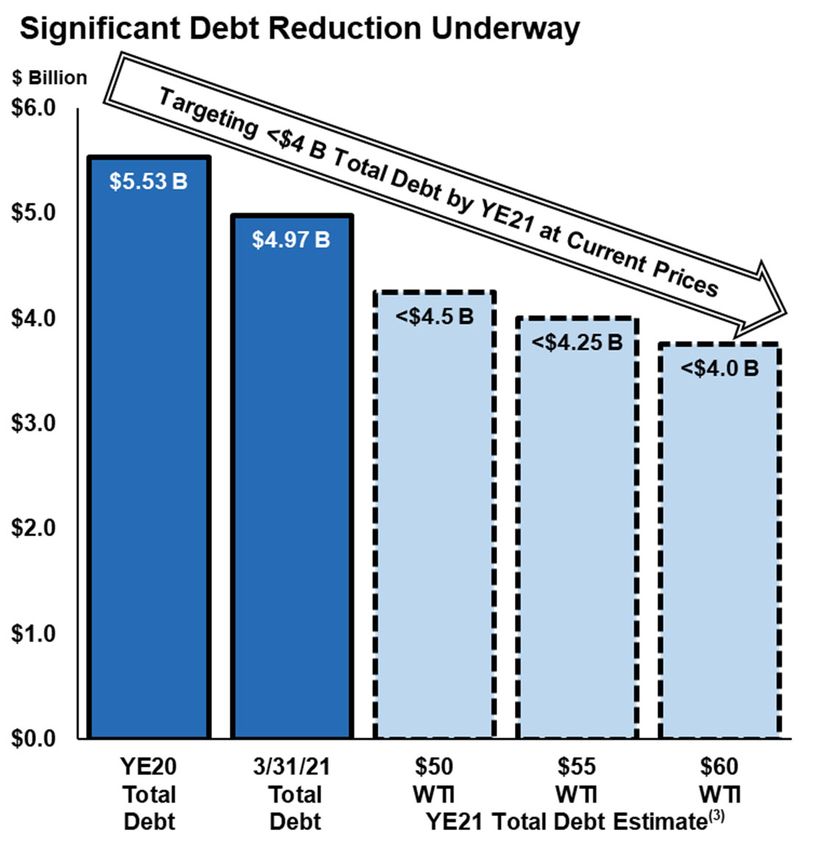
CLR Delivers Outstanding 1Q21 Financial Results
Click to edit Master title style
Reinstates Dividend & Accelerates Shareholder Returns

  Quarterly Dividend Doubled to $0.11 per Share
  Payable on May 24, 2021 to Stockholders of Record on May 10, 2021

  $260 Million Net Income & $0.72 Earnings per Share in 1Q21

  $3.1 Billion Projected Full-Year 2021 Cash Flow from Operations & $1.7 Billion
  Projected Full-Year 2021 Free Cash Flow(1) at $60 WTI & $2.75 HH

  Accelerating Projected Debt Reduction to Below $4.0 Billion Total Debt by YE21
  Ultimate Debt Target of Under $3 Billion

  Projecting Approximately 12% Return on Capital Employed(2) (ROCE) in 2021

  1. Free cash flow (FCF) is a non-GAAP measure. With respect to the projected amount, please see slide 15 for an explanation of the factors that make a quantitative reconciliation of this forward-looking estimate to U.S. GAAP not possible.
  2. Return on capital employed represents net income attributable to the Company before non-cash gains and losses on derivatives, income taxes, non-cash equity compensation expense, interest expense, and gains and losses on extinguishment of
     debt, the result of which is divided by average capital employed for the year, with capital employed representing the sum of total debt and total shareholders’ equity attributable to the Company.

                                                                            PROPERTY OF CONTINENTAL RESOURCES, INC. REPRODUCTION AND DISTRIBUTION WITH WRITTEN PERMISSION ONLY
                                                                                                                                                                                                                                                     3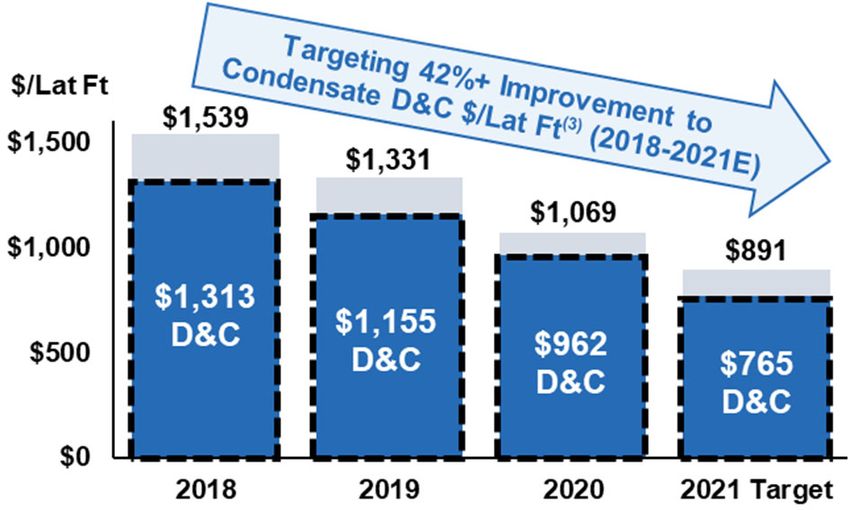
$1.7 B of Projected FCF(1) in 2021
Click to edit Master title style
Double Digit FCF Yield Underscores CLR’s Strong Value Relative to Broader Market

  1. FCF and FCF yield are non-GAAP measures. With respect to the projected amounts, please see slide 15 for an explanation of the factors that make a quantitative reconciliation of these forward-looking estimates to U.S. GAAP not possible.
     FCF yield is estimated by dividing the 2021 annual FCF estimate by the current market capitalization, as of April 27, 2021.
  2. FCF and FCF yield estimates are based on the full year average of each respective WTI price.
  3. Source: Stifel as of 3/31/21. FCF yield is calculated as discretionary cash flow less capital expenditures divided by market cap, where discretionary cash flow is calculated as cash flow from operations before changes in working capital. Cash flow
     from operations estimates are based on recent strip prices, company guidance, and Stifel projected activity levels.

                                                                                PROPERTY OF CONTINENTAL RESOURCES, INC. REPRODUCTION AND DISTRIBUTION WITH WRITTEN PERMISSION ONLY
                                                                                                                                                                                                                                                               4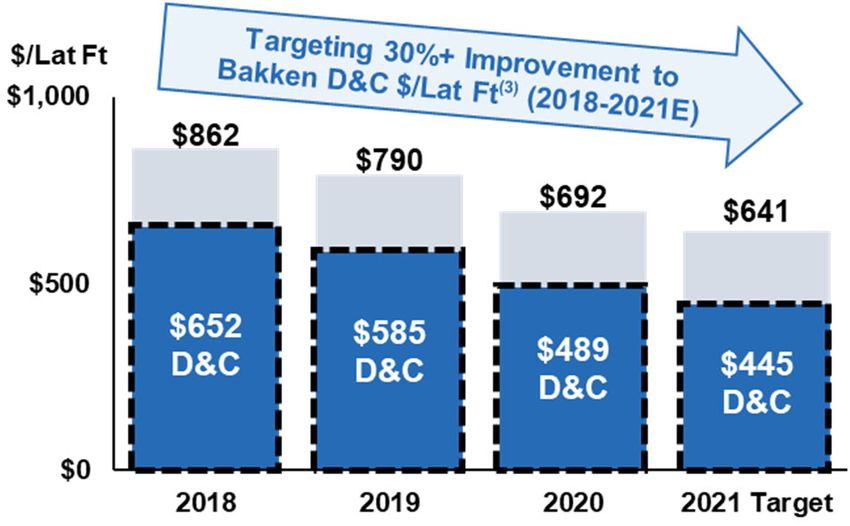
Stepping Up Shareholder Capital Returns in 2021
Click to edit Master title style
Reinstated Quarterly Dividend Alongside Accelerated Debt Reduction

  1. Dividend yield is calculated as the annual dividend per share divided by the stock price per share as of April 27, 2021.
  2. All future dividends require Board approval.
  3. Total debt estimates are based on the full year average of each respective WTI price.

                                                                                 PROPERTY OF CONTINENTAL RESOURCES, INC. REPRODUCTION AND DISTRIBUTION WITH WRITTEN PERMISSION ONLY
                                                                                                                                                                                      5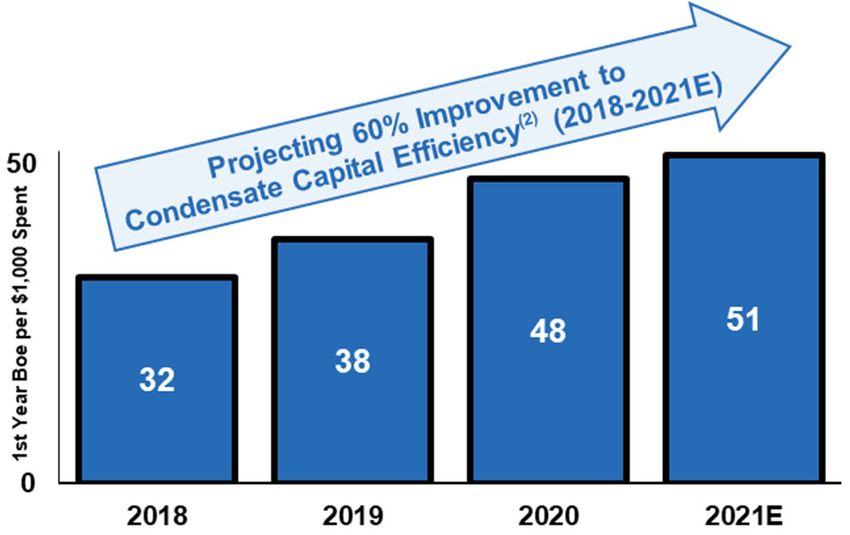
ClickStrong
1Q21: to editCost
Master title style
Performance & Operational Efficiencies
$0.72 EPS in 1Q21; Approx. 30% Above Analyst Consensus Estimates(1)
7% YoY Bakken Well Cost Improvement Target in 2021
17% YoY Oklahoma Condensate Well Cost Improvement Target in 2021
98.96% Gas Capture Rate in 1Q21 Highlights CLR ESG Stewardship
Completed $231 MM Redemption of 2022 Senior Notes on April 22, 2021
1Q21 Results 2021 Guidance
$606 MM in FCF(2) On Track to Exceed
$294 MM Non-Acquisition Capex On Track
152 MBopd and 937 MMcfpd On Track to Meet or Exceed
$3.35 Production Expense per Boe On Track
$1.29 Cash G&A(3) per Boe On Track
1. Bloomberg Analyst Consensus Estimates as of April 27, 2021.
2. FCF is a non-GAAP measure. See slide 15 for a reconciliation of FCF to net cash provided by operating activities as determined under GAAP.
3. Cash G&A is a non-GAAP measure. See “Cash G&A Reconciliation to GAAP“ on slide 21 for a reconciliation of GAAP Total G&A per Boe to Cash G&A per Boe.
PROPERTY OF CONTINENTAL RESOURCES, INC. REPRODUCTION AND DISTRIBUTION WITH WRITTEN PERMISSION ONLY
6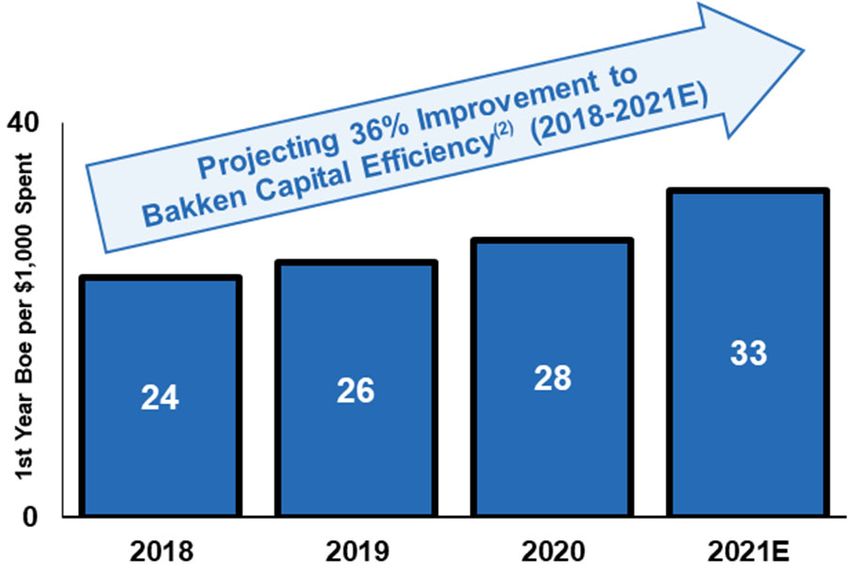
Bakken: Consistent and Low Cost Performance
  Click to edit Master title style
 Delivering Repeatable Results Alongside Significant Structural Well Cost Savings

Bakken Projected to Deliver 70%+ ROR(1) and
Another Year of Repeatable Well Performance in 2021

Improving Capital Efficiency(2) through Structural Cost Savings
• Enhanced Drilling Operations Reducing Cycle Times
• Optimizing Completion Designs
• Capitalizing on Lower Cost Production Lift Designs

Targeting 7% Lower Bakken Well Costs YoY in 2021

    1. At $60 WTI and $2.75 HH.
    2. Capital efficiency is the cumulative 12 month net Boe (6:1) divided by net Capex, in thousands, per well, averaged per program year based on the date a well is put on line. Down days included. Excludes wells impacted by shut ins.
    3. 10,000’ Average Bakken lateral length.

                                                                                 PROPERTY OF CONTINENTAL RESOURCES, INC. REPRODUCTION AND DISTRIBUTION WITH WRITTEN PERMISSION ONLY
                                                                                                                                                                                                                                               7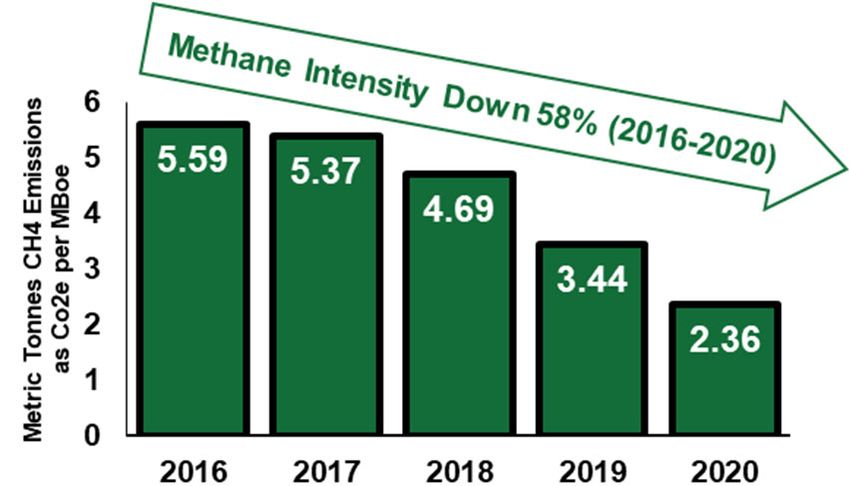
Oklahoma: Underscores Commodity Optionality
  Click to edit Master title style
Strong Year-over-Year Performance & Cost Improvements from Condensate Asset

Condensate Projected to Deliver 50%+ ROR(1) in 2021

Improving Capital Efficiency(2) through Structural Cost Savings
• Driven by Optimized Execution through More Reliable Tool Runs,
  Advanced Bit Technology, and Completion Designs

Targeting 17% Lower Condensate Well Costs YoY in 2021

Strategic Gas Hedging in 2021 & 2022
• Approx. 264 MMcfpd of 2Q-4Q21 CLR Natural Gas Hedged
  with Mid-Point of Swaps and Collars at $2.93

    1. At $60 WTI and $2.75 HH.
    2. Capital efficiency is the cumulative 12 month net Boe (6:1) divided by net Capex, in thousands, per well, averaged per program year based on the date a well is put on line. Down days included.
    3. 10,000’ Average Oklahoma Lateral Length in 2021; 7,700’ in 2020; 6,800’ in 2019; 6,100’ in 2018. 2020 Excludes 3-Mile Lateral Length Wells.

                                                                                 PROPERTY OF CONTINENTAL RESOURCES, INC. REPRODUCTION AND DISTRIBUTION WITH WRITTEN PERMISSION ONLY
                                                                                                                                                                                                          8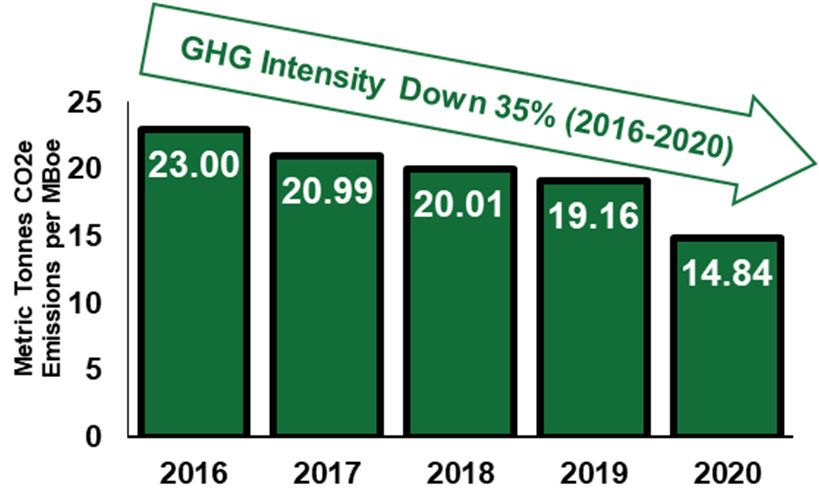
ESG Stewardship
Click to edit Master title style
Responsibly Sustaining America’s Energy Future
We Believe
Domestic Oil & Natural Gas Exploration is Fundamental to the Well-Being of Humanity, our Nation & the World. Supplying Clean Burning Natural
Gas & Light Sweet Crude Oil to U.S. & Global Markets should be Done in an Environmentally Responsible Manner, Safely, & with Integrity.
ESG Highlights
• 98.96% Gas Capture Rate in 1Q21 (Increased from 98.3% in 2020)
• Finalized 2020 Emissions Reporting
2020 GHG Intensity Reduced 23% from 2019
2020 Methane Intensity Reduced 31% from 2019
• Instituted Enhanced Contractor Qualification and Management Platform
• Continued Oklahoma Operations during Historic Winter Storm to Provide
the Bulk of the Natural Gas Needed to Avoid Deadly Power Outages
2021 ESG Focus Areas
• Continued Reductions in GHG and Methane Intensities
• No Routine Flaring Across our New Operations
• Expansion of Diversity and Inclusion Program
• Employee and Executive Compensation Remain Tied Directly to ESG
Performance via Bonus Program(1)
Gas Capture Performance Metric
Safety Performance Metrics
Environmental Spill Metrics
1. All aspects of the bonus program are subject to the complete discretion of the Compensation Committee of the Company’s Board.
PROPERTY OF CONTINENTAL RESOURCES, INC. REPRODUCTION AND DISTRIBUTION WITH WRITTEN PERMISSION ONLY
9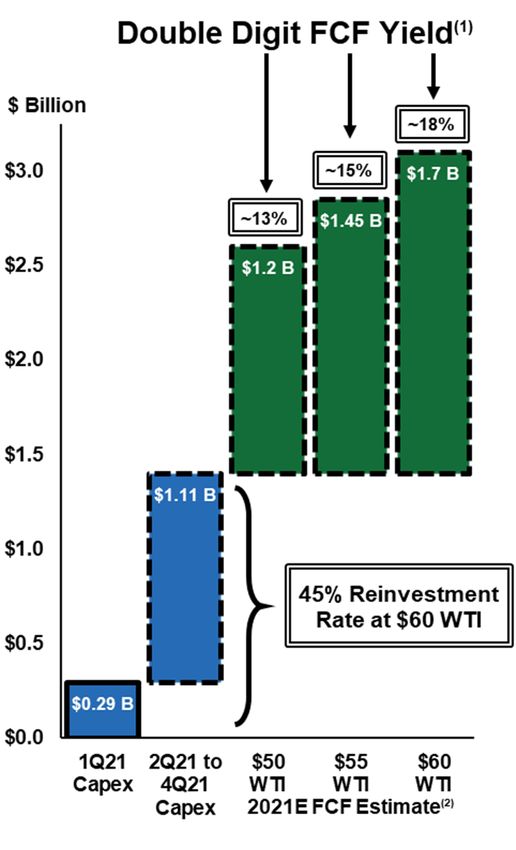
Click to
CLR’s    edit Mastertotitle
       Commitment           style
                        Shareholder Value

     Building                                                                                         Operational                                                                               Shareholder
Shareholder Returns                                                                                   Excellence                                                                                 Alignment

 Projecting 6th Consecutive                                                                                                                                                               ESG Stewardship:
                                                                                                 Maintaining Low Cost
   Year of Positive FCF(1)                                                                                                                                                              Responsibly Sustaining
                                                                                                      Leadership
           in 2021                                                                                                                                                                      America’s Energy Future

 Sustainable Reinvestment
                                                                                                      Repeatable Asset                                                                   2020 ESG Report to be
        Framework
                                                                                                        Performance                                                                      Published Midyear 2021
   (65-75% Long Term)

  Return of Capital through                                                                   Over 2.0 Million Net                                                                    Insider Ownership Provides
     Debt Reduction &                                                                      Reservoir Acres Across the                                                                   Unmatched Shareholder
    Reinstating Dividend                                                                   Bakken, Oklahoma & PRB                                                                              Alignment

 1. FCF is a non-GAAP measure. With respect to the projected amount, please see slide 15 for an explanation of the factors that make a quantitative reconciliation of this forward-looking estimate to U.S. GAAP not possible.

                                                                              PROPERTY OF CONTINENTAL RESOURCES, INC. REPRODUCTION AND DISTRIBUTION WITH WRITTEN PERMISSION ONLY
                                                                                                                                                                                                                                 10
Click to Information
Contact edit Master title style
Rory Sabino
Vice President, Investor Relations
Phone: 405-234-9620
Email: Rory.Sabino@CLR.com
Lucy Spaay
Investor Relations Analyst
Phone: 405-774-5878
Email: Lucy.Spaay@CLR.com
Website:
www.CLR.com/Investors
PROPERTY OF CONTINENTAL RESOURCES, INC. REPRODUCTION AND DISTRIBUTION WITH WRITTEN PERMISSION ONLY
11Click to edit Master title style
REFERENCE
MATERIALS
PROPERTY OF CONTINENTAL RESOURCES, INC. REPRODUCTION AND DISTRIBUTION WITH WRITTEN PERMISSION ONLY 12Click to edit Total
Accelerating Master title
Debt style
Reduction
Total Debt Reduced to $4.97 Billion as of 3/31/21
• Completed $231 MM Redemption of 2022 Senior Notes on April 22, 2021
• Targeting Debt Below $4.0 Billion by YE21
• Ultimate Debt Target of Under $3 Billion
PROPERTY OF CONTINENTAL RESOURCES, INC. REPRODUCTION AND DISTRIBUTION WITH WRITTEN PERMISSION ONLY
13Click to
2021 Guidance
edit Master
& Operating
title style Detail
Production & Capital Full-Year 2021 Capital Expenditures Budget ($ in Millions)
Capital expenditures budget $1.4 billion North D&C $732
Oil production (Bo per day) 160,000 to 165,000 South D&C $380
Natural gas production (Mcf per day) 880,000 to 920,000 Leasehold, Facilities, Other(3) $288
Operating Expenses Full-Year 2021 Total $1,400
Production expense ($ per Boe) $3.25 to $3.75
Production tax (% of net oil & gas revenue) 7.9% to 8.1%
Operational Detail North South Total
Cash G&A expense(1) ($ per Boe) $1.20 to $1.40
Average Rigs 7 4 11
Non-cash equity compensation ($ per Boe) $0.45 to $0.55
Gross Operated Wells 143 67 210
DD&A ($ per Boe) $16.50 to $18.50
Net Operated Wells 85 54 139
Average Price Differentials 2Q21 to 4Q21
Total Net Wells 94 57 151
NYMEX WTI crude oil ($ per barrel of oil) ($3.75) to ($4.75)
Henry Hub natural gas(2) ($ per Mcf) ($0.50) to $0.00
1. Cash G&A is a non-GAAP measure and excludes the range of values shown for non-cash equity compensation per Boe in the item appearing immediately below.
Guidance for 2021 total G&A (cash and non-cash) is an expected range of $1.65 - $1.95 per Boe.
2. Includes natural gas liquids production in differential range.
3. Includes $13 million of minerals acquisitions attributable to Continental. Excludes $52 million of minerals acquisitions attributable to Franco-Nevada.
PROPERTY OF CONTINENTAL RESOURCES, INC. REPRODUCTION AND DISTRIBUTION WITH WRITTEN PERMISSION ONLY
14ClickCash
Free to edit
FlowMaster title Cash
and Free style Flow Yield
Our presentation of free cash flow and free cash flow yield are non-GAAP measures. We define free cash flow as cash flows from operations before changes in working
capital items, less capital expenditures, excluding acquisitions, plus noncontrolling interest capital contributions, less distributions to noncontrolling interests.
Noncontrolling interest capital contributions and distributions primarily relate to our relationship formed with Franco-Nevada in 2018 to fund a portion of certain mineral
acquisitions which are included in our capital expenditures and operating results. Free cash flow is not a measure of net income or operating cash flows as determined by
U.S. GAAP and should not be considered an alternative to, or more meaningful than, the comparable GAAP measure, and free cash flow does not represent residual cash
flows available for discretionary expenditures. Free cash flow yield is calculated by taking free cash flow divided by the market capitalization of the Company at a given
date. Management believes these measures are useful to management and investors as measures of a company’s ability to internally fund its capital expenditures, to
service or incur additional debt, and to measure management’s success in creating shareholder value. From time to time the Company provides forward-looking free cash
flow and free cash flow yield estimates or targets; however, the Company is unable to provide a quantitative reconciliation of these forward-looking non-GAAP measures
to the most directly comparable forward-looking GAAP measure because management cannot reliably quantify certain of the necessary components of such forward-
looking GAAP measure. The reconciling items in future periods could be significant.
The following table reconciles net cash provided by operating activities as determined under U.S. GAAP to free cash flow for the period presented.
In thousands 1Q 2021
Net cash provided by operating activities (GAAP) 1,040,260
Exclude: Changes in working capital items (146,044)
Less: Capital expenditures (1) (294,278)
Plus: Contributions from noncontrolling interests 10,937
Less: Distributions to noncontrolling interests (4,927)
Free cash flow (non-GAAP) 605,948
(1) Capital expenditures are calculated as follows:
In thousands 1Q 2021
Cash paid for capital expenditures 428,182
Less: Total acquisitions (207,536)
Plus: Change in accrued capital expenditures & other 70,934
Plus: Exploratory seismic costs 2,698
Capital expenditures 294,278
PROPERTY OF CONTINENTAL RESOURCES, INC. REPRODUCTION AND DISTRIBUTION WITH WRITTEN PERMISSION ONLY
15Click
Net to edit
Debt Master titleTostyle
Reconciliation GAAP
Net debt is a non-GAAP measure. We define net debt as total debt less cash and cash equivalents as determined under U.S. GAAP. Net debt should not be considered an
alternative to, or more meaningful than, total debt, the most directly comparable GAAP measure. Management uses net debt to determine the Company’s outstanding debt
obligations that would not be readily satisfied by its cash and cash equivalents on hand. We believe this metric is useful to analysts and investors in determining the Company’s
leverage position since the Company has the ability to, and may decide to, use a portion of its cash and cash equivalents to reduce debt. This metric is sometimes presented as a
ratio with EBITDAX in order to provide investors with another means of evaluating the Company’s ability to service its existing debt obligations as well as any future increase in the
amount of such obligations. At March 31, 2021, the Company’s total debt was $4.97 billion and its net debt amounted to $4.88 billion, representing total debt of $4.97 billion less
cash and cash equivalents of $96.1 million. From time to time the Company provides forward-looking net debt forecasts; however, the Company is unable to provide a quantitative
reconciliation of the forward-looking non-GAAP measure to the most directly comparable forward-looking GAAP measure of total debt because management cannot reliably
quantify certain of the necessary components of such forward-looking GAAP measure. The reconciling items in future periods could be significant.
PROPERTY OF CONTINENTAL RESOURCES, INC. REPRODUCTION AND DISTRIBUTION WITH WRITTEN PERMISSION ONLY
16Click to edit
EBITDAX Master titleTostyle
Reconciliation GAAP
We use a variety of financial and operational measures to assess our performance. Among these measures is EBITDAX, a non-GAAP measure. We define EBITDAX as earnings
before interest expense, income taxes, depreciation, depletion, amortization and accretion, property impairments, exploration expenses, non-cash gains and losses resulting from
the requirements of accounting for derivatives, non-cash equity compensation expense, and gains and losses on extinguishment of debt as applicable. EBITDAX is not a measure
of net income or net cash provided by operating activities as determined by U.S. GAAP.
Management believes EBITDAX is useful because it allows us to more effectively evaluate our operating performance and compare the results of our operations from period to
period without regard to our financing methods or capital structure. Further, we believe EBITDAX is a widely followed measure of operating performance and may also be used by
investors to measure our ability to meet future debt service requirements, if any. We exclude the items listed above from net income/loss and net cash provided by operating
activities in arriving at EBITDAX because these amounts can vary substantially from company to company within our industry depending upon accounting methods and book
values of assets, capital structures and the method by which the assets were acquired.
EBITDAX should not be considered as an alternative to, or more meaningful than, net income/loss or net cash provided by operating activities as determined in accordance with
U.S. GAAP or as an indicator of a company’s operating performance or liquidity. Certain items excluded from EBITDAX are significant components in understanding and assessing
a company’s financial performance, such as a company’s cost of capital and tax structure, as well as the historic costs of depreciable assets, none of which are components of
EBITDAX. Our computations of EBITDAX may not be comparable to other similarly titled measures of other companies. From time to time the Company provides forward-looking
EBITDAX forecasts; however, the Company is unable to provide a quantitative reconciliation of the forward-looking non-GAAP measure to the most directly comparable forward-
looking GAAP measure of net income (loss) and net cash provided by operating activities because management cannot reliably quantify certain of the necessary components of
such forward-looking GAAP measure. The reconciling items in future periods could be significant.
See the following page for reconciliations of our net income (loss) and net cash provided by operating activities to EBITDAX for the applicable periods.
PROPERTY OF CONTINENTAL RESOURCES, INC. REPRODUCTION AND DISTRIBUTION WITH WRITTEN PERMISSION ONLY
17Click to edit
EBITDAX Master titleTostyle
Reconciliation GAAP
The following tables provide reconciliations of our net income (loss) and net cash provided by operating activities to EBITDAX for the periods presented:
Three months ended March 31,
In thousands 2021 2020
Net income (loss) $ 260,275 $ (186,784)
Interest expense 64,951 63,594
Provision (benefit) for income taxes 80,528 (52,235)
Depreciation, depletion, amortization and accretion 509,608 536,696
Property impairments 11,436 222,529
Exploration expenses 4,645 11,637
Impact from derivative instruments:
Total loss on derivatives, net 43,507 —
Total cash paid on derivatives, net (29,437) —
Non-cash loss on derivatives, net 14,070 —
Non-cash equity compensation 16,927 16,441
(Gain) loss on extinguishment of debt 196 (17,631)
EBITDAX (non-GAAP) $ 962,636 $ 594,247
The following table provides a reconciliation of our net cash provided by operating activities to EBITDAX for the periods presented.
Three months ended March 31,
In thousands 2021 2020
Net cash provided by operating activities $ 1,040,260 $ 663,818
Current income tax benefit — (2,223)
Interest expense 64,951 63,594
Exploration expenses, excluding dry hole costs 4,645 5,378
Gain (loss) on sale of assets and other, net 207 (4,502)
Other, net (1,383) (3,001)
Changes in assets and liabilities (146,044) (128,817)
EBITDAX (non-GAAP) $ 962,636 $ 594,247
PROPERTY OF CONTINENTAL RESOURCES, INC. REPRODUCTION AND DISTRIBUTION WITH WRITTEN PERMISSION ONLY
18Click to editEarnings
ADJUSTED Master Reconciliation
title style To GAAP
Our presentation of adjusted earnings and adjusted earnings per share that exclude the effect of certain items are non-GAAP financial measures. Adjusted earnings and adjusted
earnings per share represent earnings and diluted earnings per share determined under U.S. GAAP without regard to non-cash gains and losses on derivative instruments, property
impairments, gains and losses on asset sales, and gains and losses on extinguishment of debt as applicable. Management believes these measures provide useful information to
analysts and investors for analysis of our operating results. In addition, management believes these measures are used by analysts and others in valuation, comparison and
investment recommendations of companies in the oil and gas industry to allow for analysis without regard to an entity’s specific derivative portfolio, impairment methodologies, and
property dispositions. Adjusted earnings and adjusted earnings per share should not be considered in isolation or as an alternative to, or more meaningful than, earnings or diluted
earnings per share as determined in accordance with U.S. GAAP and may not be comparable to other similarly titled measures of other companies. The following tables reconcile
earnings and diluted earnings per share as determined under U.S. GAAP to adjusted earnings and adjusted diluted earnings per share for the periods presented.
Three months ended March 31,
2021 2020
In thousands, except per share data $ Diluted EPS $ Diluted EPS
Net income (loss) attributable to Continental Resources (GAAP) $ 259,642 $ 0.72 $ (185,664) $ (0.51)
Adjustments:
Non-cash loss on derivatives 14,070 —
Property impairments 11,436 222,529
Net (gain) loss on sale of assets and other (207) 4,502
(Gain) loss on extinguishment of debt 196 (17,631)
Total tax effect of adjustments (1) (6,247) (51,303)
Total adjustments, net of tax 19,248 0.05 158,097 0.43
Adjusted net income (loss) (non-GAAP) $ 278,890 $ 0.77 $ (27,567) $ (0.08)
Weighted average diluted shares outstanding 362,673 365,403
Adjusted diluted net income (loss) per share (non-GAAP) $ 0.77 $ (0.08)
1. Computed by applying a combined federal and state statutory tax rate of 24.5% in effect for 2021 and 2020 to the pre-tax amount of adjustments associated with our operations in the United States.
PROPERTY OF CONTINENTAL RESOURCES, INC. REPRODUCTION AND DISTRIBUTION WITH WRITTEN PERMISSION ONLY
19Click
Net to edit
Sales Master
Prices title style To GAAP
Reconciliation
Revenues and transportation expenses associated with production from our operated properties are reported separately. For non-operated properties, we receive a net payment
from the operator for our share of sales proceeds which is net of costs incurred by the operator, if any. Such non-operated revenues are recognized at the net amount of proceeds
received. As a result, the separate presentation of revenues and transportation expenses from our operated properties differs from the net presentation from non-operated
properties. This impacts the comparability of certain operating metrics, such as per-unit sales prices, when such metrics are prepared in accordance with U.S. GAAP using gross
presentation for some revenues and net presentation for others.
In order to provide metrics prepared in a manner consistent with how management assesses the Company's operating results and to achieve comparability between operated and
non-operated revenues, we may present crude oil and natural gas sales net of transportation expenses, which we refer to as "net crude oil and natural gas sales," a non-GAAP
measure. Average sales prices calculated using net crude oil and natural gas sales are referred to as "net sales prices," a non-GAAP measure, and are calculated by taking
revenues less transportation expenses divided by sales volumes, whether for crude oil or natural gas, as applicable. Management believes presenting our revenues and sales
prices net of transportation expenses is useful because it normalizes the presentation differences between operated and non-operated revenues and allows for a useful
comparison of net realized prices to NYMEX benchmark prices on a Company-wide basis.
The following tables present a reconciliation of crude oil and natural gas sales (GAAP) to net crude oil and natural gas sales and related net sales prices (non-GAAP) for the
periods presented.
Three months ended March 31, 2021 Three months ended March 31, 2020
In thousands Crude oil Natural gas Total Crude oil Natural gas Total
Crude oil and natural gas sales (GAAP) $ 768,768 $ 478,765 $ 1,247,533 $ 773,770 $ 88,973 $ 862,743
Less: Transportation expenses (40,079) (10,177) (50,256) (50,372) (10,130) (60,502)
Net crude oil and natural gas sales (non-GAAP) $ 728,689 $ 468,588 $ 1,197,277 $ 723,398 $ 78,843 $ 802,241
Sales volumes (MBbl/MMcf/MBoe) 13,726 84,289 27,774 18,251 87,453 32,826
Net sales price (non-GAAP) $ 53.09 $ 5.56 $ 43.11 $ 39.64 $ 0.90 $ 24.44
PROPERTY OF CONTINENTAL RESOURCES, INC. REPRODUCTION AND DISTRIBUTION WITH WRITTEN PERMISSION ONLY
20Click G&A
Cash to edit Master title To
Reconciliation style
GAAP
Our presentation of cash general and administrative (“G&A”) expenses per Boe is a non-GAAP measure. We define cash G&A per Boe as total G&A determined in accordance
with U.S. GAAP less non-cash equity compensation expenses, expressed on a per-Boe basis. We report and provide guidance on cash G&A per Boe because we believe this
measure is commonly used by management, analysts and investors as an indicator of cost management and operating efficiency on a comparable basis from period to period. In
addition, management believes cash G&A per Boe is used by analysts and others in valuation, comparison and investment recommendations of companies in the oil and gas
industry to allow for analysis of G&A spend without regard to stock-based compensation programs which can vary substantially from company to company. Cash G&A per Boe
should not be considered as an alternative to, or more meaningful than, total G&A per Boe as determined in accordance with U.S. GAAP and may not be comparable to other
similarly titled measures of other companies.
The following table reconciles total G&A per Boe as determined under U.S. GAAP to cash G&A per Boe for the periods presented.
Three months ended March 31,
2021 2020
Total G&A per Boe (GAAP) $ 1.90 $ 1.31
Less: Non-cash equity compensation per Boe (0.61) (0.50)
Cash G&A per Boe (non-GAAP) $ 1.29 $ 0.81
PROPERTY OF CONTINENTAL RESOURCES, INC. REPRODUCTION AND DISTRIBUTION WITH WRITTEN PERMISSION ONLY
21You can also read